Last close As at 05/08/2026
GBP2.91
▲ 1.00 (0.34%)
Market capitalisation
GBP504m
Research: Investment Companies
Utilico Emerging Markets (UEM) aims to generate long-term growth in capital and income from a portfolio of 60-90 emerging market equities. Exposure is diversified by geography, with a large concentration in infrastructure, utility and related sectors. Manager Charles Jillings is bullish on the outlook for emerging market equities in 2018 due to a widespread economic improvement, which should result in another year of robust corporate profits. UEM has announced that it is proposing to change its domicile from Bermuda to the UK, which has the potential to improve investor perception and may lead to a narrower discount.
Utilico Emerging Markets |
Proposal to re-domicile in the UK |
Investment companies |
26 February 2018 |
Share price/discount performance
Three-year performance vs index
Gearing
Analysts
|
|||||||||||||||||||||||||||||||||||||||||||||||||||||||||||||||||||||||||||||||||||||||||
Utilico Emerging Markets (UEM) aims to generate long-term growth in capital and income from a portfolio of 60-90 emerging market equities. Exposure is diversified by geography, with a large concentration in infrastructure, utility and related sectors. Manager Charles Jillings is bullish on the outlook for emerging market equities in 2018 due to a widespread economic improvement, which should result in another year of robust corporate profits. UEM has announced that it is proposing to change its domicile from Bermuda to the UK, which has the potential to improve investor perception and may lead to a narrower discount.
12 months ending |
Share price |
NAV |
MSCI Emerging Markets (%) |
MSCI EM Infrastructure Capped (%) |
Performance fee benchmark (%) |
31/01/14 |
(3.5) |
2.6 |
(13.0) |
(11.5) |
6.5 |
31/01/15 |
18.8 |
16.1 |
15.6 |
19.9 |
7.7 |
31/01/16 |
(10.5) |
(9.3) |
(15.9) |
(15.3) |
8.0 |
31/01/17 |
21.3 |
25.5 |
41.9 |
30.6 |
8.0 |
31/01/18 |
16.9 |
15.7 |
25.2 |
9.1 |
8.0 |
Source: Thomson Datastream. Note: All % on a total return basis in GBP. Performance fee benchmark subject to an 8% minimum from April 2014. MSCI indices are shown for illustrative purposes.
Investment strategy: Fundamental research
Jillings invests for the long term, avoiding stock market ‘noise’, seeking companies that can generate strong margins and cash flow, which can support above-average dividend yields. The investible universe of c 900 companies is screened and companies passing the selection criteria undergo thorough fundamental research, which includes construction of detailed financial models and valuation targets. Company meetings and site visits are an integral part of the research process. Since UEM’s launch in July 2005 to end-January 2018, its NAV total returns have compounded at 12.0% per annum.
Market outlook: Potential for higher equity volatility
Global equities have been in an uptrend since early 2016, in a period categorised by a synchronised improvement in the global economy. Unsurprisingly, over this period relatively defensive emerging market infrastructure shares have failed to keep pace with broader emerging market equities. During 2017, stock market volatility was particularly low compared with history, but has recently increased. In this environment, investors may wish to consider a fund of high-quality companies that are generating steady cash flows and offer relatively high dividend yields.
Valuation: Discount wider than average
UEM’s current 13.1% share price discount to cum-income NAV is wider than the averages of the last one, three, five and 10 years of 11.5%, 10.6%, 9.0% and 8.8%. The trust’s imminent simplified capital structure (the final exercise of subscription rights is 28 February 2018) and the proposed re-domicile have the potential to lead to a narrower discount. UEM has a progressive dividend policy; the annual distribution has been increased or maintained each year since the trust’s launch.
Exhibit 1: Company at a glance
Investment objective and fund background |
Recent developments |
||||||||||||||||||||||||||||||||||||||||||||||||||||||||||||||||||||||
Utilico Emerging Markets’ investment objective is to provide long-term total return by investing predominantly in infrastructure, utility and related sectors mainly in emerging markets. |
■ 23 February 2018: Announcement of fourth quarterly interim dividend of 1.80p, to be paid in April rather than June, due to proposed re-domicile. ■ 14 February 2018: Board announcement that UEM proposes to re-domicile in the UK. ■ 6 February 2018: Announcement of third quarterly interim dividend of 1.80p. ■ 21 November 2017: Six-month results to 30 September 2017. NAV TR +5.7% versus MSCI Emerging Markets Index TR +7.6%. Proposal to increase the third and final dividends from 1.70p to 1.80p. |
||||||||||||||||||||||||||||||||||||||||||||||||||||||||||||||||||||||
Forthcoming |
Capital structure |
Fund details |
|||||||||||||||||||||||||||||||||||||||||||||||||||||||||||||||||||||
AGM |
September 2018 |
Ongoing charges |
1.0% |
Group |
ICM |
||||||||||||||||||||||||||||||||||||||||||||||||||||||||||||||||||
Final results |
June 2018 |
Net gearing |
5.7% |
Manager |
Charles Jillings |
||||||||||||||||||||||||||||||||||||||||||||||||||||||||||||||||||
Year end |
31 March |
Annual mgmt fee |
0.65% |
Address |
UK office: PO Box 208, Epsom, Surrey KT18 7YF |
||||||||||||||||||||||||||||||||||||||||||||||||||||||||||||||||||
Dividend paid |
September, December, March, June |
Performance fee |
15% of outperformance (cap: 1.85% of average net assets) |
||||||||||||||||||||||||||||||||||||||||||||||||||||||||||||||||||||
Launch date |
20 July 2005 |
Company life |
Indefinite (subject to vote) |
Phone |
+44 (0)1372 271486 |
||||||||||||||||||||||||||||||||||||||||||||||||||||||||||||||||||
Continuation vote |
Five yearly, next 2021 AGM |
Loan facilities |
£50m |
Website |
|||||||||||||||||||||||||||||||||||||||||||||||||||||||||||||||||||
Dividend policy and history (financial years) |
Share buyback policy and history (financial years) |
||||||||||||||||||||||||||||||||||||||||||||||||||||||||||||||||||||||
The fund is managed for total return, but the board broadly seeks flat or rising dividends. |
Subject to annual renewal, UEM has authority to repurchase up to 14.99% and allot shares up to 10% of the issued share capital. |
||||||||||||||||||||||||||||||||||||||||||||||||||||||||||||||||||||||
|
|
||||||||||||||||||||||||||||||||||||||||||||||||||||||||||||||||||||||
Shareholder base (as at 21 February 2018) |
Portfolio exposure by sector (look through as at 31 January 2018) |
||||||||||||||||||||||||||||||||||||||||||||||||||||||||||||||||||||||
|
|
||||||||||||||||||||||||||||||||||||||||||||||||||||||||||||||||||||||
Top 10 holdings (as at 31 January 2018) |
|||||||||||||||||||||||||||||||||||||||||||||||||||||||||||||||||||||||
|
|||||||||||||||||||||||||||||||||||||||||||||||||||||||||||||||||||||||
Source: Utilico Emerging Markets, Edison Investment Research, Bloomberg, Morningstar. Note: *N/A where not in January 2017 top 10.
Market outlook: Valuations remain relatively attractive
The performance of indices is shown in Exhibit 2 (LHS). Over the last five years, emerging market shares on the whole have performed broadly in line with UK shares, while emerging market infrastructure shares have lagged, particularly during a period of strong global equity returns since early 2016. This is not surprising given the somewhat defensive nature of these companies that have long-lived assets and generate steady cash flows. During 2017, the stock market rally was orderly and volatility was very low versus history, although it has increased recently. Looking at valuations (right-hand chart), emerging market equities remain more attractively valued compared to global equities. Investors seeking emerging market exposure may wish to consider a fund comprising relatively stable, high-quality companies, which are generating strong cash flows and offer an above-average yield.
|
Exhibit 2: Market performance and valuation |
|
Indices’ total return performance (£ adjusted, last five years) |
Indices valuation metrics as at 31 January 2018 |
|
|
|
Source: Thomson Datastream, MSCI, Edison Investment Research |
|
Fund profile: Infrastructure and utility investment
UEM was launched in July 2005. It is currently registered in Bermuda, but the board has proposed a move to a UK registration to take advantage of its increasingly supportive regulatory and tax environment. This may also help improve investor perception and narrow UEM’s discount, which is currently higher than the historical averages. If the re-domicile, via a scheme of arrangement, is approved by shareholders at a special meeting on 20 March 2018, it will become effective on 28 March 2018. There will be no change to the investment objective or dividend policy. The trust is traded on the Main Market of the London Stock Exchange. Since launch, UEM has been managed by Charles Jillings who is a director at ICM, which is a Bermuda-based investment company with c £20bn assets under management. He aims to generate long-term total returns from a diversified portfolio of emerging market equities, which are primarily in infrastructure, utility and related sectors. Stocks are selected on a bottom-up basis and the manager is unconstrained by benchmark allocations, although the MSCI Emerging Market Index is used as a reference. The benchmark for UEM’s performance fee is the UK Gilt five- to 10-year index post-tax yield, plus RPIX inflation, plus 2%, subject to an 8% minimum and capped at 1.85% of average NAV. At the time of investment, a maximum of 60% may be in the top 10% holdings, 10% in a single stock, 30% in an individual country, 20% in a sector and 5% in unlisted securities (3% at end-September 2017). A maximum 20% may be invested outside of the infrastructure, utility and related sectors. At the time of drawdown, gearing (total borrowings versus gross assets) of up to 25% is permitted. At end-January 2018, net gearing was 5.7%. From launch to this date, UEM’s NAV total returns have compounded at 12.0% per annum. This compares to a broad annual hurdle rate of 15% for portfolio investments. Taking into account tax and other costs, the manager considers that the 12.0% return that has been achieved is an acceptable rate.
The fund manager: Charles Jillings
The manager’s view: Outlook remains optimistic
Jillings believes that earnings growth for portfolio companies will continue in 2018 due to increased economic activity. For example, he says that toll roads, ports and airports are all experiencing higher volumes. The manager says that currencies are a consideration – higher US interest rates could mean a stronger US dollar. Currently, the dollar is undergoing a period of weakness versus stronger emerging market currencies.
Regarding the political environment, Jillings says that most countries have a positive backdrop. In Argentina, President Macri is working to normalise the economy. In Brazil, reforms are being implemented that are driving economic momentum and more than offsetting the political uncertainty surrounding President Temer. Interest rates in Brazil have come down significantly, due to lower inflation, which allows larger companies to refinance their debt at lower rates, while encouraging loan demand from consumers and small -and medium-sized enterprises.
In terms of economic growth, the manager says that on balance the outlook for Latin America is positive led by Brazil, Chile and Argentina, which is outweighing a lack of growth in Mexico, which has an upcoming presidential election and economic activity is being affected by ongoing NAFTA negotiations. In Asia, Jillings believes that the Chinese economy will continue to grow; within the country he endeavours to align UEM’s holdings with government policy. These include gas distribution companies, where industry growth is positively affected by government initiatives to promote a cleaner environment. The trust continues to have meaningful exposure to Romania, which is enjoying the fastest economic growth in Europe, and is undergoing a programme of privatisation and restructuring of state-owned assets.
The manager comments that while equity valuations in general are close to the high end of their historical ranges, he believes that equities can continue to move higher, although he would not rule out a short-term correction. He is positive on the outlook for emerging market equities in 2018, but says that performance could be more of a challenge in 2019 due to higher inflation. This business cycle has been characterised by low inflation, due to a lack of wage growth, although there is evidence that wage gains are starting to come through. For example, Walmart, which is by far the largest private-sector employer in the US, has recently increased its minimum wage. Commodity prices have also rallied, including oil, which may affect economic growth in the future as central banks are forced to tighten monetary policy to combat higher inflation.
Asset allocation
Investment process: Diligent bottom-up stock selection
The manager aims to generate long-term capital and income growth from a diversified portfolio of emerging market equities, primarily in the infrastructure, utility and related sectors. He adopts a long-term time horizon, avoiding short-term stock market ‘noise’. He is able to draw on the broad experience of ICM’s investment team. Portfolio companies have long-dated assets, such as toll road, airport and gas and electricity transmission concessions. They typically generate strong cash flow, which can provide insulation during periods of economic weakness or currency fluctuations. Currently, 97% of the portfolio is invested in listed, operational assets and three quarters of investee companies pay a dividend. UEM’s portfolio currently has 80 holdings, out of an investible universe of c 900 companies, which is towards the high end of the typical 60-90 range. Companies considered for investment undergo thorough fundamental research, including construction of detailed financial models and valuation targets. They should have strong fundamentals such as revenue growth with strong margins and cash flows supporting above-average dividend yields. The ICM investment team place high importance on meeting company managements and site visits, along with meeting foreign government officials. Shares are only purchased when the manager considers that they are trading at a discount to their perceived value and have the potential to generate total returns of 15% pa. Jillings explains that due to the nature of UEM’s investments, the trust has tended to underperform the broader market in a cyclical upturn, when consumer cyclical and commodity stocks typically perform well. UEM tends to outperform in a falling market.
Current portfolio positioning
At end-January 2018, UEM’s top 10 positions made up 32.8% of the portfolio, which was a modestly lower concentration versus 37.2% a year earlier, with five names common to both periods. Looking at Exhibit 3, over the last 12 months to end-January 2018, UEM has increased exposure to Argentina (+8.3pp) and Brazil (+5.0pp) as a result of share price appreciation as well as additional investment. There is lower exposure in China including Hong Kong (-3.9pp), due to the manager taking some profits, along with weaker share price performance compared to other areas such as Latin America and Romania. On a sector basis, the largest additions are in road and rail (+3.1pp) and renewables (+2.4pp), with the largest reduction in water and waste (-3.1pp). However, despite identifying changes in geographic and sector exposure, it should be remembered that stock selection is made on a bottom-up basis.
Exhibit 3: Portfolio geographic and industrial exposure (% unless stated)
Portfolio end-Jan 2018 |
Portfolio end-Jan 2017 |
Change (pp) |
Portfolio end-Jan 2018 |
Portfolio end-Jan 2017 |
Change (pp) |
|||
Brazil |
23.3 |
18.3 |
5.0 |
Electricity |
24.0 |
21.9 |
2.1 |
|
China incl. Hong Kong |
16.4 |
20.3 |
(3.9) |
Gas |
17.1 |
18.8 |
(1.7) |
|
Romania |
10.4 |
9.3 |
1.1 |
Ports |
12.9 |
14.8 |
(1.9) |
|
Argentina |
8.3 |
0.0 |
8.3 |
Airports |
10.6 |
9.7 |
0.9 |
|
Philippines |
6.2 |
6.6 |
(0.4) |
Other |
8.5 |
7.1 |
1.4 |
|
India |
5.9 |
6.6 |
(0.7) |
Road and rail |
8.0 |
4.9 |
3.1 |
|
Middle East/Africa |
5.7 |
7.5 |
(1.8) |
Water and waste |
5.3 |
8.4 |
(3.1) |
|
Malaysia |
5.2 |
7.3 |
(2.1) |
Satellites |
3.9 |
5.7 |
(1.8) |
|
Other Europe |
4.7 |
4.5 |
0.2 |
Renewables |
3.1 |
0.7 |
2.4 |
|
Other Latin America |
4.5 |
7.7 |
(3.2) |
Telecoms |
2.6 |
4.1 |
(1.5) |
|
Chile |
3.8 |
3.4 |
0.4 |
Infrastructure inv. funds |
2.3 |
1.6 |
0.7 |
|
Other Asia |
3.7 |
3.4 |
0.3 |
Other infrastructure |
1.7 |
2.3 |
(0.6) |
|
Thailand |
1.9 |
5.1 |
(3.2) |
|||||
100.0 |
100.0 |
|
100.0 |
100.0 |
Source: Utilico Emerging Markets, Edison Investment Research
One of the relatively new positions in UEM’s portfolio is Bolsas Y Mercados Argentinos (BYMA), which is the Argentine stock exchange. The trust invested in the company when it was privately owned. UEM also participated in the company’s May 2017 initial public offering and has subsequently added to its position. BYMA’s share price has performed very strongly, for example in December 2017, the stock rallied by c 40% due to higher stock market trading volumes and the company’s inclusion in the Merval index (the primary Argentine stock market index). The manager is confident that following improvements in dealing and settlement arrangements, it is only a matter of time before Argentina is included in the MSCI Emerging Market Index, which should lead to higher investor demand for shares in Argentine companies.
Performance: Above performance fee benchmark
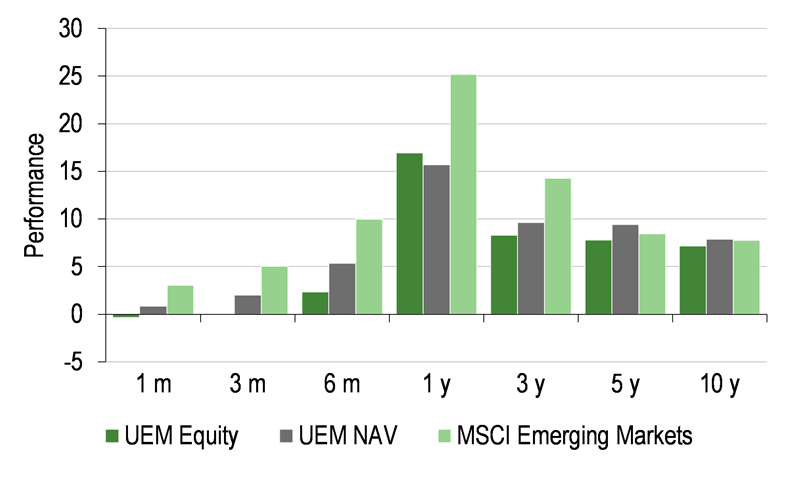
UEM’s absolute returns are shown in Exhibit 4. Over the last 12 months, the trust’s NAV and share price total returns of 15.7% and 16.9% respectively are behind the MSCI Emerging Market Index 25.2% total return, which is used as a reference rather than a performance benchmark. During the period, exposure to Brazil has been beneficial for performance as the rate of economic progress has surpassed expectations and the benefits have outweighed political uncertainty in the country. On the flip side, satellite exposure has detracted from returns. The industry has become increasingly competitive due to increased supply and rapid technological changes. Over the longer term, from the trust’s inception to end-H118, UEM’s total return of 302.3% is meaningfully higher than the MSCI Emerging Market Index’s 219.0% total return.
|
Exhibit 4: Investment company performance to 31 January 2018 (in sterling terms) |
|
Price, NAV and index total return performance, one-year rebased |
Price, NAV and index total return performance (%) |
|
|
|
Source: Thomson Datastream, Edison Investment Research. Note: Three, five and 10-year performance figures annualised. |
|
UEM’s NAV total return has outperformed the performance fee benchmark over all periods shown, while its share price has outperformed over one, three and five years (Exhibit 5).
|
Exhibit 5: Share price and NAV total return performance, relative to indices (%) |
||||||||
|
One month |
Three months |
Six months |
One year |
Three years |
Five years |
10 years |
|
Price relative to MSCI Emerging Markets |
(3.3) |
(4.8) |
(7.0) |
(6.6) |
(14.9) |
(3.0) |
(5.3) |
|
NAV relative to MSCI Emerging Markets |
(2.2) |
(2.9) |
(4.3) |
(7.6) |
(11.8) |
4.5 |
1.0 |
|
Price relative to MSCI EM Infrastructure |
0.5 |
0.2 |
2.1 |
7.2 |
5.3 |
13.8 |
9.5 |
|
NAV relative to MSCI EM Infrastructure |
1.7 |
2.2 |
5.0 |
6.1 |
9.2 |
22.6 |
16.8 |
|
Price relative to FTSE All-Share |
1.6 |
(1.0) |
(1.5) |
5.1 |
(0.3) |
(3.1) |
1.1 |
|
NAV relative to FTSE All-Share |
2.8 |
0.9 |
1.3 |
4.0 |
3.4 |
4.4 |
7.8 |
|
Price relative to performance fee benchmark* |
(1.0) |
(1.9) |
(1.6) |
8.3 |
0.8 |
0.7 |
(5.8) |
|
NAV relative to performance fee benchmark* |
0.1 |
0.0 |
1.3 |
7.1 |
4.6 |
8.5 |
0.4 |
|
|
Source: Thomson Datastream, Edison Investment Research. Note: Data to end-January 2018. Geometric calculation. *Benchmark for performance fee is UK Gilt five- to 10-year post-tax yield, plus RPIX, plus 2%, subject to an 8% minimum from 1 April 2014. |
||||||||
|
Exhibit 6: NAV total return performance relative to MSCI EM index over five years |
||||||||
|
||||||||
|
Source: Thomson Datastream, Edison Investment Research |
||||||||
Discount: Wider than the historical averages
UEM’s current 13.1% share price discount to cum-income NAV is towards the wider end of the 6.9% to 16.0% range over the last 12 months. It is also wider than the averages of the last one, three, five and 10 years (range of 8.8% to 11.5%). The board and the manager actively monitor the discount as there is an inclination, but not a commitment to repurchase shares when the discount exceeds 10%. So far in FY18, 9.8m shares have been repurchased at a cost of £12.8m, this compares to allotments of 4.1m shares over the period, which has raised £7.4m (Exhibit 1). The manager is hopeful that following the final exercise of subscription rights at end-February 2018 (see below) the simplified capital structure of the trust will contribute to a narrower discount.
|
Exhibit 7: Share price premium/discount to NAV (including income) over three years (%) |
|
|
Source: Thomson Datastream, Edison Investment Research |
Capital structure and fees
UEM has 210.4m ordinary shares outstanding. It also has 37.8m subscription shares in issue. The last date that these shares may be exercised is 28 February 2018 at 183.0p. If all subscription shares are exercised it will result in c 4.3% dilution to the current NAV.
At end-January 2018, bank debt of £37.2m compared with an available £50.0m loan, which is a two-year secured multicurrency revolving facility with Scotiabank Europe, due for renewal on 27 April 2018. Gross gearing was 6.6%; adding back cash, this equates to net gearing of 5.7%.
An annual management fee of 0.65% of NAV is paid to ICM. In H118, ongoing charges were 1.0% compared to 1.1% in FY17. No performance fees were payable, unlike in FY17, which increased total ongoing charges to 2.9%. Subject to an 8% minimum hurdle, a 15% performance fee on returns above the UK gilt five- to 10-year index post-tax yield plus RPIX inflation plus 2% is payable; the NAV must exceed the high watermark NAV when the performance fee was last paid. The performance fee is capped at 1.85% of net assets, paid 50% in shares and 50% in cash.
Dividend policy and record
UEM is managed for total return and the board has a progressive dividend policy. Annual dividends have been increased or maintained since the trust was launched in 2005. Distributions may be from income or capital and are paid quarterly in September, December, March and June. Over the last five years, dividends have compounded at an annual rate of c 4%. In H118, dividends of 3.4p were c 1.9x covered by income and the revenue reserve increased by c 50% to £19.9m, which is equivalent to 9.5p per share (nearly 1.5x the FY16 annual dividend). Over the period, income was boosted by increased dividend payments from portfolio companies, higher exposure to countries that generally pay larger dividends, such as Brazil and Romania, and special dividends.
On a seasonal basis, UEM generates more income in H1 compared with H2. The directors have announced an increase in the third and final interim dividends from 1.7p to 1.8p, implying a total dividend for FY18 of 7.0p, which is 5.3% higher than in FY17. Based on the current share price, UEM has a dividend yield of 3.2%.
Peer group comparison
Exhibit 8 shows the members of the AIC Global Emerging Markets sector that have been trading for more than a year with market caps above £100m. UEM cannot be directly compared to the peers due to its focus on infrastructure and utilities, however its diversified emerging market exposure means a comparison is valid. The trust’s NAV total returns are above average over five and 10 years, while lagging over one and three years. UEM’s discount is one of the widest in the selected peer group. Both its level of gearing and dividend yield are above the peer group average.
Exhibit 8: Selected peer group as at 23 February 2018*
% unless stated |
Market cap £m |
NAV TR |
NAV TR |
NAV TR |
NAV TR |
Discount (ex-par) |
Ongoing charge |
Perf. |
Net gearing |
Dividend yield (%) |
Utilico Emerging Markets |
465.0 |
11.1 |
35.2 |
48.6 |
112.0 |
(12.5) |
1.0 |
Yes |
107 |
3.2 |
Aberdeen Emerging Markets |
322.5 |
13.7 |
46.4 |
35.4 |
49.0 |
(12.5) |
1.1 |
No |
106 |
3.3 |
BlackRock Frontiers |
310.5 |
17.1 |
51.1 |
89.2 |
|
2.9 |
1.5 |
Yes |
113 |
3.1 |
Fundsmith Emerging Equities Trust |
309.2 |
11.0 |
18.1 |
|
|
1.3 |
1.9 |
No |
100 |
0.0 |
Genesis Emerging Markets Fund |
970.4 |
14.7 |
40.9 |
36.2 |
113.3 |
(12.8) |
1.4 |
No |
100 |
1.5 |
JPMorgan Emerging Markets |
1,111.3 |
18.9 |
49.6 |
53.5 |
116.0 |
(11.1) |
1.1 |
No |
99 |
1.2 |
JPMorgan Global Emerging Markets |
400.7 |
12.9 |
33.2 |
35.3 |
|
(3.8) |
1.3 |
No |
105 |
3.6 |
Templeton Emerging Markets |
2,151.4 |
17.5 |
43.7 |
31.3 |
100.2 |
(10.2) |
1.2 |
No |
102 |
1.1 |
Average |
755.1 |
14.6 |
39.8 |
47.1 |
98.1 |
(7.3) |
1.3 |
104 |
2.1 |
|
Rank (out of eight funds) |
4 |
7 |
6 |
3 |
3 |
6 |
8 |
2 |
3 |
Source: Morningstar, Edison Investment Research. Note: *Performance data as at 22 February 2018. TR=total return. Net gearing is total assets less cash and equivalents as a percentage of net assets.
The board
There are five non-executive directors on UEM’s board, of which four are independent of the manager. The chairman is John Rennocks, he was appointed to the board in November 2015 and assumed his current role in September 2016. Garth Milne is deputy chairman and was appointed in November 2014. The other two independent directors and their dates of appointment are Garry Madeiros (June 2007) and Anthony Muh (October 2010). The non-independent director is Susan Hansen, she was appointed in September 2013 and is also on the board of Homeloans, which is associated with ICM. UEM’s manager Charles Jillings was historically on the board, but stood down in March 2012 to increase the board’s independence and improve corporate governance.
|
|
Investment Companies
Research: TMT
FY17 was a year of strong growth for DATAGROUP, with revenues rising by 28% and EBITDA surging 42%. The EBITDA margin rose by 120bp to a record 12.1%. The core cloud services continue to grow strongly, rising by 64% and recurring sales represented 70% of total revenue (which translated to 88% of gross profit), up from 66% in FY16. In August 2017, DATAGROUP acquired ikb Data to extend the group’s offering into the financial services sector and in January 2018 it announced the acquisition of Almato, a pioneer in Robotic Process Automation. Consequently, DATAGROUP is building a number of key differentiators in its markets.