Last close As at 05/08/2026
—
— 0.00 (0.00%)
Market capitalisation
—
Research: Financials
With earnings on an improved trend over the past three years and having considered its strategic options, Lloyd Fonds (LF) is looking to grow. The focus is now set on exploiting its experience and know-how in developing its established position in investment and asset management for real assets. It is targeting innovative fund offerings that will appeal to a competitive institutional market and a retail market that management believes will recover over time. The valuation is not building in a high expectation of AUM progress, and the shares offer an attractive dividend meanwhile.
Lloyd Fonds |
Positive performance sets platform for growth
Financial services |
Scale research report - Initiation
07 June 2017 |
Share price graph
Share details
Business description
Bull
Bear
Analysts
|
||||||||||||||||||||||||||||
With earnings on an improved trend over the past three years and having considered its strategic options, Lloyd Fonds (LF) is looking to grow. The focus is now set on exploiting its experience and know-how in developing its established position in investment and asset management for real assets. It is targeting innovative fund offerings that will appeal to a competitive institutional market and a retail market that management believes will recover over time. The valuation is not building in a high expectation of AUM progress, and the shares offer an attractive dividend meanwhile.
Positive performance trend continuing
FY16 net attributable earnings of €3.2m were in line with the upwardly revised guidance provided in November 2016, continuing the trend of strong improvement that began in FY13. Management guides to further revenue growth in the current year, including a first-time contribution from the recently launched social housing investment vehicle, and a broadly flat result despite the absence of disposal and deconsolidation gains that contributed in FY16. Recognising the trend of improving group financial performance, the dividend increased from €0.07 per share in FY15 to €0.16.
Successful AUM growth the medium-term key
Management is now in a phase of seeking to capitalise on recent progress by implementing a new strategy for growing its investment and asset management activities. It has a medium-term goal of increasing AUM from c €1.4bn to c €3.0bn, despite the drag of existing funds running off. It sees strong growth potential in its innovative social housing vehicle (target €1bn AUM by 2022) with other fund projects, across a range of asset types, under consideration aimed at institutional and retail investors alike.
Valuation: Attractive dividend with earnings potential
We note that consensus estimates pre-date the FY16 results release and are ahead of management guidance. Based on consensus forecasts for FY18, LF’s P/E is c two-thirds of the peer group average or a c 15% discount assuming no earnings growth on FY16. If LF can successfully grow its AUM over the medium term then there is good potential for earnings to move meaningfully higher over time. Meanwhile the shares benefit from a well-supported dividend yield.
|
Consensus estimates
Source: Lloyd Fonds (historic), Bloomberg (prospective) as at 2 June 2017. |
Edison Investment Research provides qualitative research coverage on companies in the Deutsche Börse Scale segment in accordance with section 36 subsection 3 of the General Terms and Conditions of Deutsche Börse AG for the Regulated Unofficial Market (Freiverkehr) on Frankfurter Wertpapierbörse (as of 1 March 2017). Two to three research reports will be produced per year. Research reports do not contain Edison analyst financial forecasts.
Company description: Ready for growth
Lloyd Fonds is an investment and asset manager, developing, marketing, and managing investment funds based on alternative real assets for both institutional and retail investors. It is involved in all stages of the value chain, identifying suitable investment assets and bringing them together with investors by creating, structuring, and arranging financing for investment vehicles, subsequently managing the assets with a view to an eventual exit strategy. LF has a track record spanning more than 20 years and has been listed on the Frankfurt Stock Exchange since 2005 and joined Deutsche Börse’s Scale Segment in March 2017. During this period it has arranged more than 100 products to invest in alternative real assets, raising equity of c €2bn and, including debt within the funds, representing an aggregate original investment volume of c €5bn. Allowing for fund reimbursements and valuation changes, the current investment volume (or assets under management, AUM) is c €1.4bn. Shipping funds are the historical core of Lloyd Fonds and shipping remains the largest segment of AUM (Exhibit 1). However, the group has increasingly applied its expertise in structuring, placing, and managing alternative real assets to diversify its asset base to include real estate, aircraft, energy, private equity, and traded UK endowment policies.
|
Exhibit 1: Breakdown of assets under management |
Exhibit 2: Breakdown of sales/revenues |
|
|
|
Source: Lloyd Fonds. Note: Assets at fair value. |
Source: Lloyd Fonds |
|
Exhibit 1: Breakdown of assets under management |
|
|
Source: Lloyd Fonds. Note: Assets at fair value. |
|
Exhibit 2: Breakdown of sales/revenues |
|
|
Source: Lloyd Fonds |
As discussed below, along with other issuers of closed-end funds in Germany, LF was hit hard by the global financial crisis and its impacts on global growth and the shipping sector in particular. Closed-end fund issuers were particularly squeezed by ship orders placed before the crisis for which fund investors could no longer be sourced. A financial restructuring was completed in 2011, with a €15m equity capital increase allowing LF to refinance financial liabilities and meet payments that had become due to the banks as a result of the global financial crisis and ensuing stress on the shipping market.
|
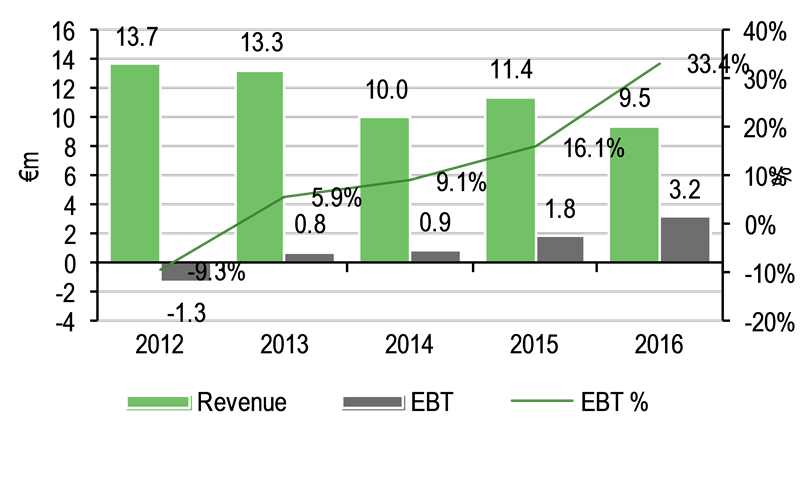
Exhibit 3: Revenue & earnings before tax (EBT) history |
Exhibit 4: Lloyd Fonds market capitalisation |
|
|
|
Source: Lloyd Fonds |
Source: Bloomberg |
|
Exhibit 3: Revenue & earnings before tax (EBT) history |
|
|
Source: Lloyd Fonds |
|
Exhibit 4: Lloyd Fonds market capitalisation |
|
|
Source: Bloomberg |
The financial crisis also brought about new regulatory arrangements and Germany’s adoption of the AIFM Directive in 2013 brought the closed-end fund sector (issuance and management) under regulatory control and subject to a similar regulatory regime as the open-ended fund sector. The new regulations have encouraged changes in business models, including that of LF, with a move away from reliance on predominantly retail customer based issuance fees towards a greater focus on traditional fund and asset management to generate recurring revenues from institutional and retail investors alike.
An inevitable consequence of the abrupt halt to new issuance and stresses in the shipping market was that management focus shifted towards the active asset management of existing funds. In combination with the completion of the financial restructuring, this has seen a recovery in LF’s profitability over the past three years, and to a lesser extent in its market cap, which fell from a pre-global financial crisis high of more than €250m to as little as €8m in 2013 to reach more than €30m today. Management is now seeking to capitalise on this progress by implementing a new strategy for growth. It recently launched its first new investment vehicle since 2012, a fund for construction and investment in the niche area of German government-sponsored affordable housing in metropolitan areas.
A brief overview of the business segments and AUM
As we show in Exhibit 1, shipping remains the largest segment by AUM, with substantial positions in real estate and aircraft, and smaller positions in energy, private equity, and UK traded endowment policies. From a financial reporting perspective, the group is split between the operating divisions of real estate, shipping and other assets, and trusteeship, as well as the central overhead item, general and other expenses. The real estate and shipping and other assets divisions are each responsible for asset sourcing, fund structuring and asset management in their respective areas, whereas the trusteeship division represents the interests of investors in the funds in legal and administrative matters, as well as providing them with services including fund reporting and management reports.
Since LF was founded, the shipping segment has issued more than 70 shipping funds with an aggregate original investment volume of c €3.5bn. Allowing for fund closures as a result of maturities and insolvencies, it currently manages 29 funds of which 26 are directly invested in shipping assets and three are secondary funds of participations in a range of primary funds (source: 2016 annual report). The current investment volume or AUM is c €600m. The directly invested funds together represent a fleet of 32 ships under management (20 container ships, nine product and oil tankers, and three multi-purpose vessels). In addition, LF manages three secondary market funds. Conditions in the container shipping segment remain challenging and LF has been able to establish a shipping pool for 10 of the container ships in the fleet, working with contractual shipping companies and the banks. The aim of the pool is to stabilise income and optimise cost structures across the pool fleet.
The real estate segment has issued 12 closed-end funds, of which seven are in German assets and five are invested in real estate assets in the Netherlands, with an aggregate original investment volume of c €420m and current AUM of c €390m. An important new initiative in this asset class is the November 2016 creation, after 18 months of planning, of Lloyd WohnWert GmbH & Co. KGaA, an innovative capital market-oriented investment company offering institutional investors an opportunity to participate in the area of government-sponsored affordable housing construction and investment. The KGaA vehicle is a partnership limited by shares whereby the external shareholders hold limited partner status while LF is the owner of the managing partner with unlimited liability. We believe that fund is relatively small at this early stage but it has completed its first investment and management considers that AUM of €1bn by 2022 is a realistic target. Lloyd WohnWert seeks to satisfy the need for affordable housing generated by a growing demand and falling supply and believes that despite the lower rents that tenants pay, in combination with grants and subsidies and lower construction costs it will be possible to offer investors a relatively low-risk buy and hold investment strategy returning in excess of c 3% pa.
The closed-end real estate fund investments are focused on office and hotel properties and four of the funds are dedicated hotel funds. The real estate team had an active 2016, disposing of two hotel assets on behalf of funds and arranging the transfer, effectively acting as broker, of four hotels between third parties. A third hotel was sold on behalf of funds in Q117.
LF introduced aircraft funds in 2007 and has issued four funds with an aggregate investment volume of €350m and a current AUM (after distributions and asset value movements) of c €230m. The funds represent a fleet of four aircraft, including an Airbus A380 leased to Singapore Airlines, an Airbus A340-600, and two Airbus A319s. In addition to actively managing the assets, the airline team regularly seeks opportunities for aircraft transactions, acting as a broker, structurer or service provider.
In the renewable energy segment LF has invested in three wind farms since 2002, with an aggregate 20 wind turbines, in Germany and Scotland. The operations and the management contracts for two of the wind farms (12 wind turbines), one in Germany and one in Scotland, were recently exited. The two remaining active funds have AUM of c €40m.
LF has been participating in private equity since 2006 and does so via a feeder fund into an umbrella fund structure managed by Neuberger Berman. The total equity interest in the LF feeder fund, contained within the AUM total, is c €10m. The Neuberger Berman fund, the Global Partnership I fund, predominantly invests in a diversified portfolio of shares in US buy-outs.
The eight UK traded endowment policy funds issued by LF since 2004 are all still active. An aggregate investment volume since issue of c €270m has reduced with distributions to a current AUM of c €90m.
Strategic evolution
The current €1.4bn of AUM are virtually all in the form of closed-end German Limited Partnerships (“KGs”). The investors are predominantly (c 80%) retail investors. Within the KG, the liability of the investors (the limited partners) is limited to their original investment, while the LF group is invested in and controls the general partner to the fund, with unlimited liability, and provides the management of the fund. LF is also directly invested in all of the funds. With an average age of c 8.5 years since inception, these funds can be expected to run down over time (see below) as appropriate exits from investment assets are sought. Given the finite life of the existing AUM, management has obviously given a great deal of consideration to the longer-term growth strategy for LF in a world where regulatory and market changes have eliminated the pre-crisis model of asset growth.
Between 2013 and early 2015 management worked extensively on a plan that would have seen LF become a listed ship owning and managing vehicle by consolidating all of the 11 active closed-end shipping funds that it currently manages through an exchange of LF shares for the equity interest of investors in the funds. Management believed that the new structure would deliver operational, management, and financial synergies as well as creating a vehicle that would be able to capitalise on an eventual recovery in the shipping sector while benefiting from access to the capital markets. Current investors in the funds would also have swapped their illiquid participations for a listed equity investment. More than half of the investors who voted on the proposal were in favour, but the threshold of 75% was not met and the proposal failed.
Having been unsuccessful in its attempt to transform the group into a listed ship owning and management vehicle, LF management has returned its focus to growing its investment and asset management activities. It has a medium-term goal (which we would interpret as five to six years) of increasing AUM from the current c €1.4bn to c €3.0bn by capitalising on its more than 20 years of experience to provide a single platform for alternative investments across a range of asset types for institutional and retail investors alike. Unlike some peers, such as MPC Capital, LF has maintained a focused interpretation of asset management that extends to the strategic and financial management of the fund assets without vertical integration into areas of technical management (such as chartering of ships or management of individual properties). Historically, LF has exercised this management through its general partner participation in the funds. The vertical integration debate is finely balanced, but LF sees more value from working competitively with a range of outsourcing partners than it does from the potential to broaden the base of activities and revenues. Similarly, LF management retains its ambitions to grow its AUM in the retail market, which it believes will gradually improve, even eventually in the shipping sector. Regulatory changes mean, however, that future fund structures will be different from the historical book of ‘’KG’’ closed-end funds.
Meanwhile, the market continues to provide a supportive backdrop for LF. Low interest rates continue to stimulate demand for real assets from investors searching for sustainable yields and alternative assets (private equity, real assets, hedge funds) have been growing at twice the rate of traditional investments over the past decade. A report produced by PwC (Alternative Asset Management 2020: fast forward to centre stage) in 2015 forecast further strong growth for the alternative assets (c 8% compound annual growth to 2020). Within this, PwC expects faster than average growth (c 9% annual compound growth) from real assets. The shipping markets have remained depressed over a number of years since the global financial crisis but LF management believes that recovery will eventually take hold and provide new opportunities. Meanwhile, real estate remains in favour with investors for its steady income generating potential in an environment of generally low returns.
Against this background LF sees good market potential for new and innovative investment products based on alternative real assets, particularly while the low interest rate environment persists. In addition to growing and listing the new social housing fund, Lloyd WohnWert, management is at a relatively early stage of planning for a real estate investment trust (REIT) targeting secondary participations in closed-end real estate funds. Secondary positions are exchangeable but being unlisted and illiquid they generally do so at large discounts to NAV. The new REIT would benefit from acquiring secondary positions at a discount and would be able to offer listed shares as consideration. Other potential projects include a shipping debt fund; whereas the shipping market is not supportive of raising funds for ship investment, LF sees investor interest in, and an investment opportunity from, acquiring discounted shipping debt, most obviously from lending banks that wish to remove exposure from their balance sheets.
Management, organisation and corporate governance
Supervisory board and management board
As a listed German company, LF is overseen by a supervisory board that consists of six members. Dr Stefan Rindfleisch is the chairman of the supervisory board. He is specialised in structured maritime finance. In addition, he advises private equity funds, hedge funds and institutional investors on shipping investments. The other members of the supervisory board are Dr Thomas Duhnkrack (deputy), Jens Birkmann, Paul M Leand Jr, Stephen Seymour and Bote de Vries.
The management board is led by the chief executive officer, Dr Torsten Teichert, who joined LF as managing director in 2000 and became CEO in 2001. He is supported by an experienced senior management team in the fields of shipping and other assets, real estate, capital markets and trusteeship.
Below the management board LF, with 44 employees at the end of 2016 (2015: 43), is characterised by a flat management structure.
Organisation
The group comprises 17 fully consolidated subsidiaries, the most important of which are Lloyd Treuhand (responsible for the group’s trustee activities and communications with investors in the group’s funds), Lloyd Shipping (which develops, structures, and manages the group’s shipping and other funds), and Lloyd Fonds Real Estate Management (which develops, structures, and manages the group’s real estate funds).
88 associates are equity accounted. Most of these are fund management entities that receive fixed annual remuneration from the funds; others are entities that have been established as vehicles for future projects/funds.
LF’s investments in the funds, including the general partner investments, are recorded within the 177 available for sale investments (including 149 associates and 28 affiliates) that are carried in the balance sheet at fair value. Dividends received by LF as well as realised gains (or losses) are reported as investment income within net financial income, while unrealised changes in value are reported within other comprehensive income.
Shareholders and free float
AMA Capital Partners became the main shareholder during the 2011 financial restructuring and capital increase. It continues to be a supportive shareholder with just under 50% of LF’s capital and is represented on the supervisory board of LF through its chief executive officer and managing director Paul M Leand Jr. AMA was established in 1987 and is a leading advisor to investors in the shipping and offshore sectors including mergers and acquisitions, corporate restructuring, capital raising and strategic planning. The stake is held through ACP Fund V.
Dr Teichert and his family have a significant shareholding of 3.6%, while one-third of the shares are freely floating.
|
Exhibit 5: Shareholder structure |
|
|
Source: Lloyd Fonds |
Financials
Revenues along the value chain and returns from investments
By being active at all points along the value chain, LF generates income at all stages of the life of the investment funds that it initiates and manages, some recurring and some more one-off in nature, some fully consolidated and some as equity accounted associate income or investment returns on non-consolidated investments. Historically it earned significant fees from initiating and structuring investments, primarily targeted at the retail market. Since the financial crisis it has become more reliant on recurring management fees as well as recurring trusteeship fees. Management fees are primarily linked to the profits of the fund (c 0.75% on average but variable according to the nature of each fund). The trusteeship fees are linked to the original managed equity of each fund from inception to closure and are therefore more predictable and independent of market conditions and fluctuations in the value of assets managed. During the life of the fund, LF also earns income from “one-off” placement and structuring services, such as asset purchases and sales, and undertakes similar activities including investment structuring on behalf of third parties. At the maturity and closure of a fund there is also the potential to earn additional fees that are related to the overall fund returns achieved (relative to a pre-determined benchmark or hurdle rate.
A decline in the number of active funds, managed equity and AUM (down from €3.5bn in 2012 to €1.4bn today) in recent years has combined with weak investment markets for shipping in particular to put pressure on sales/revenues over recent years. However, the contribution made by the non-consolidated associate companies, reported in financial income and not sales, has recently become a significant element in LF’s overall returns. As a result, sales plus net finance income is an important measure for management, and this has been supported by the contribution of investment income to the net financial result from dividend income from, and realisation gains on, non-consolidated affiliated companies.
Exhibit 6: Trend in sales/revenues
Year to 31 December (€000s) |
2013 |
2014 |
2015 |
2016 |
4-year CAGR |
Sales/revenue |
13,292 |
10,040 |
11,424 |
9,463 |
-8.8% |
Net finance income |
677 |
1,362 |
1,227 |
2,363 |
|
Sales plus net finance income |
13,969 |
11,402 |
12,651 |
11,826 |
-3.4% |
% change in sales |
-2.8% |
-24.5% |
13.8% |
-17.2% |
|
% change in sales plus net finance income |
3.0% |
-18.4% |
11.0% |
-6.5% |
Source: Lloyd Fonds
Earnings have continued to recover strongly
Recently reported FY16 net attributable earnings of €3.2m were in line with the upwardly revised guidance provided in November. EBT has now grown for four years in a row and shows a strong recovery from the losses of 2012 (Exhibit 7). The performance of the real estate division was particularly strong, reflecting exit gains from the disposal of retail real estate funds and from “brokering” the sale of six tourist hotels, not owned by LF funds, to institutional investors. In contrast, profits in the shipping and special assets segment declined, mainly as a result of the impact on management fees from continued weakness in the shipping market.
Recognising the trend of improving group financial performance, a dividend of €0.07 per share was paid during 2016 in respect of the FY15 results, and for the FY16 year a dividend of €0.16 per share was recently paid.
Exhibit 7: Financial summary
Year to 31 December (€000s) |
2012 |
2013 |
2014 |
2015 |
2016 |
INCOME STATEMENT |
|||||
Management fees |
2,998 |
2,892 |
2,799 |
2,707 |
1,425 |
Arrangement & structuring services |
2,748 |
1,284 |
321 |
2,154 |
1,898 |
Trusteeship business |
7,925 |
7,828 |
6,735 |
6,562 |
6,066 |
Other |
0 |
1,288 |
185 |
1 |
74 |
Total revenue |
13,671 |
13,292 |
10,040 |
11,424 |
9,463 |
Cost of materials |
(4,574) |
(3,119) |
(1,573) |
(2,060) |
(1,039) |
Gross profit |
9,097 |
10,173 |
8,467 |
9,364 |
8,424 |
Gross profit margin |
66.5% |
76.5% |
84.3% |
82.0% |
89.0% |
Staff costs |
(6,625) |
(4,986) |
(4,747) |
(4,035) |
(4,303) |
Depreciation, amortisation, & impairment |
(1,037) |
(1,083) |
(365) |
(453) |
(494) |
Other operating income/(expense) |
(6,281) |
(4,836) |
(4,306) |
(4,761) |
(3,270) |
Share of profit of associates |
3,685 |
844 |
502 |
497 |
443 |
Operating profit/(loss) |
(1,161) |
112 |
(449) |
612 |
800 |
Investment income |
24 |
179 |
641 |
373 |
1,773 |
Other net financial income |
(138) |
498 |
721 |
854 |
590 |
Earnings before tax (EBT) |
(1,275) |
789 |
913 |
1,839 |
3,163 |
EBT margin |
-9.3% |
5.9% |
9.1% |
16.1% |
33.4% |
Tax |
(1,514) |
346 |
(162) |
(273) |
12 |
Consolidated net profit |
(2,789) |
1,135 |
751 |
1,566 |
3,175 |
Minority |
0 |
0 |
0 |
0 |
0 |
Consolidated attributable net profit |
(2,789) |
1,135 |
751 |
1,566 |
3,175 |
EPS (€) |
(0.30) |
0.12 |
0.03 |
0.17 |
0.35 |
DPS (€) |
0.00 |
0.00 |
0.00 |
0.07 |
0.16 |
BALANCE SHEET |
|||||
Investment in associates |
9,766 |
2,561 |
2,282 |
1,628 |
1,606 |
Available for sale assets -non-current |
4,049 |
3,506 |
3,548 |
3,640 |
2,573 |
Other non-current assets |
2,699 |
2,366 |
2,696 |
2,560 |
2,741 |
Available for sale assets - current |
6,952 |
6,052 |
5,648 |
5,085 |
3,326 |
Cash |
3,123 |
5,709 |
7,592 |
10,173 |
11,663 |
Other current assets |
10,213 |
6,685 |
6,055 |
5,064 |
5,709 |
Financial liabilities |
(10,229) |
(3,028) |
(2,837) |
(2,752) |
(1,552) |
Other liabilities |
(11,308) |
(7,874) |
(8,155) |
(7,007) |
(6,921) |
Shareholders' equity |
15,265 |
15,977 |
16,829 |
18,391 |
19,145 |
CASH FLOW |
|||||
Cash flow from operating activity |
(12,450) |
2,622 |
2,295 |
2,754 |
2,313 |
Cash from investing activity |
2,444 |
57 |
(149) |
41 |
1,176 |
Cash flow from financing activity |
(2,864) |
(109) |
(210) |
(173) |
(1,876) |
Other |
20 |
16 |
(53) |
(41) |
(123) |
Net change in cash |
(12,850) |
2,586 |
1,883 |
2,581 |
1,490 |
Closing cash |
3,123 |
5,709 |
7,592 |
10,173 |
11,663 |
Closing net cash/(debt) |
(7,106) |
2,681 |
4,755 |
7,421 |
10,111 |
Source: Lloyd Fonds
Although sales revenue, comprising management fees, income from arrangement and structuring, and income from the trustee business, declined by an additional 17% in FY16, to €9.463m (FY15: €11.424m), the decline in sales plus net finance income was significantly lower at c 6% to €11.826m (2015: €12.651m). Net finance income included increased investment income of €1.773m (2015: €373k) resulting mainly from the sale of the real estate assets held in the “Moderne Großstadthotels” hotel fund in addition to dividends received from non-consolidated affiliated companies.
Recurring fees reported as management fees and trusteeship fees declined from €9.269m to €7.491m. Within this, management fee revenues declined from €2.707m to €1.425m. When adjusted for the impact (€0.831m) of the deconsolidation of the Lloyd Fonds Singapore subsidiary, the decline was 17%. LF Singapore provides commercial management services for merchant shipping to third parties and had been doing so for the open-ended shipping fund (LF Open Waters OP) initiated and managed by LF until its last ships were sold, the trigger for deconsolidation of the subsidiary. Other pressure on management fees, in respect of the active closed-end funds, resulted from the continuing difficult conditions in the shipping market as well as the impact of asset sales, both ships and real estate. Trustee fees, the largest of the revenue streams, were negatively affected by the termination of fund contracts due to insolvency and the sale of fund assets with revenues declining by 8% to €6.066m.
Income from arrangement and structuring was 12% down on the previous year (€1.898m vs €2.154m), reflecting lower shipping related fees partly off-set by real estate fees.
Total group sales revenue included a small contribution from other (non-trustee) services provided by Lloyd Treuhand.
The LF Singapore deconsolidation also contributed significantly to the fall in cost of materials (which is mostly management fees, from €2.060m to €1.039m) as did the decline in arrangement and structuring activity. This limited the decline in gross profit to 10%, with the gross margin rising to a five-year high of 89%.
Operating profit (EBIT) continued to increase, reaching €800k (FY15: €612k) as a result of a more favourable balance of other income and expenses, including a gain of €957k from the sale of shares in a real estate fund and a €228k gain on the deconsolidation of the energy companies. The increase in staff costs reflects higher performance related remuneration, with average staff numbers down slightly from 47 to 45.
The increase in earnings before tax (EBT) was more significant, from €1.839m in FY15 to €3.163m, primarily as a result of the higher investment income noted above. The EBT margin at 33% was also at a five-year high.
A 2016 profit transfer agreement between Lloyd Fonds Real Estate Management GmbH and Lloyd Fonds AG contributed to a positive tax add-back of €12k. Under the agreement, the profit generated by Lloyd Fonds Real Estate will in future be taxed at the level of Lloyd Fonds AG, making it possible to utilise the unused tax losses arising in the past to lower the group tax rate. The recent AGM has approved a similar profit share agreement between Lloyd Fonds Shipping GmbH and Lloyd Fonds AG that similarly aims to reduce the group-level tax burden. Looking ahead, management anticipates an effective tax rate will be lower than the standard rate, but is unable to provide specific guidance.
With consolidated earnings after tax increasing to €3.163m, the return on average shareholders’ equity increased from 9.1% to 16.5%.
Within other comprehensive income, there was a €2.054m impairment on the value of fund investments.
Strong balance sheet and positive cash flow for dividends
A summary of the balance sheet and cash flow is also shown in Exhibit 7. At the end of FY16 LF had a cash position of €11.7m and minimal debt (net cash €10.1m). Payment of the FY16 dividend will consume c €1.5m of the cash. Shareholders’ equity of €19.1m (€2.09 per share) was 69% of total assets. In addition to cash, total assets of €27.6m include investments in associates of €1.6m, available for sale investments (investments in the funds) of €5.9m and a non-current receivable of €1.9m relating to KALP GmbH. A large part of the group’s receivables (€6.7m in total, including KALP) are due from fund entities and result from services provided by the group. Despite KALP having entered insolvency proceedings, LF anticipates recovery of the outstanding receivable, although the timing remains uncertain.
Operating cash flow remained in excess of €2m, with positive cash flow from divestment allowing for dividend payments and a small repayment of debt.
Outlook and consensus
The market consensus estimate, shown on page 1, is provided by just one broker. This looks for growth in sales/revenues of 56% and EBT of 37% in the current year, slowing to growth rates of 5% and 11%, respectively, for FY18. We note that the consensus estimate was published prior to the full year 2016 results being published, and while it reflects management’s growth ambitions for the medium term, is ahead of the near-term guidance that management has given for the current year. Management expects that FY17 sales/revenue will be higher than in FY16 and that consolidated net profit will be similar to the level reached in 2016.
Sales/revenue should benefit from a first time management fee contribution from Lloyd WohnWert, although this will be relatively small considering the current level of AUM. The progress that management expects in sales/revenues is likely to be offset by a non-repeat of the fund and asset disposal gains (gains from fund share sales and deconsolidation of c €1.2m within other income and investment income related to asset sale gains that we estimate at c €1.3-1.4m or c 75% of the total 2016 investment income of €1.8m).
Without attempting to forecast medium-term earnings progress for LF, it is nonetheless worth considering what impact a growth in AUM to c €3.0bn could potentially have. In terms of revenue mix, we would anticipate a shift away from the high issuance fees earned historically and the trusteeship fees earned on original equity invested (not AUM) that dominate currently. Instead, reflecting the issuance of alternative investment funds and listed entities rather than the historical “KG” closed-end funds, we would expect revenues to be based on fund structuring fees and recurring asset management fees. We think that structuring fees, one-off in nature, would reasonably fall in the range of 1.0% to 1.5%; and recurring management fees within the range of 0.5% to 1.5% pa. Assuming a c €1.6bn net increase in AUM €3.0bn, with a structuring fee of 1.0% spread over 10 years, and a recurring annual management fee of 0.8%, would imply additional revenues of c €14.0m (0.9% on AUM). The c €7.5m of recurring fees (management and trusteeship) earned in 2016 represented c 0.5% on the current €1.4bn of AUM. However, in coming years, this existing AUM is likely to be reduced and assuming a decline to €0.5bn, the volume of new AUM implied by a total AUM of €3.0bn would be €2.5bn. At 0.9% pa the potential management revenue from this €2.5bn would be c €22.5m while at current fee rates the potential management income on the remaining €0.5bn of existing AUM would be c €2.5m. In aggregate, this illustration implies a total recurring revenue potential of c €25.0m compared with the current (FY16) level of €7.5m.
Clearly, successful growth in AUM has the potential to significantly lift revenues from current levels and we doubt whether costs would need to rise proportionately, increasing the profitability impact through operational gearing.
Valuation
In this section we comment on the valuation of LF shares in the context of a broad peer group of listed asset managers, including private equity, specialist and conventional asset managers in Europe and North America, using consensus data sourced from Bloomberg.
The average of the consensus P/E multiples for each of the groups is surprisingly similar given the significant difference in business models that are represented. However, the spread within groups is larger. The Bloomberg consensus expectation for earnings growth for LF is c 19% this year and c 12% in FY18. However, as we note above, the consensus includes just one estimate and was first published prior to LF reporting its FY16 earnings, which guide to a broadly flat net profit in FY17.
Based on the consensus, LF’s prospective P/Es for both the current year (9.1x) and next year (8.1x) are significantly lower than the specialist group averages (14.0x and 12.0x) and the all sector averages. Assuming no growth in earnings, consistent with management guidance for the current year, the LF multiple of 10.5x is still noticeably lower.
Similarly, there is a high degree of similarity in terms of the average prospective ROEs for the groups, with the exception of conventional asset managers. This may reflect the obvious competitive pressures from lower-costs passive fund managers as well as the burden of regulatory change. Based on consensus, LF’s ROE is below the specialist sector average, although Apollo has a significant impact on increasing the average, but this seems to be more than reflected in its relatively low P/BV multiple. We estimate a 16.9% return on average equity for LF in FY16.
LF has an attractive dividend yield of more than 4% and we note that the 2016 dividend was twice covered by IFRS earnings.
The table below highlights the relatively small market capitalisation of Lloyd Fonds which, along with the narrow base of consensus forecasts, may be contributing to LF’s lower than average valuation. We also note in the sensitivities section below some remaining legal risks with respect to fund liability disputes. However, as we discuss in the financial section above, if LF can demonstrate an ability to successfully grow its AUM over the medium term, then there is good potential for earnings to move meaningfully higher over time. The well-supported dividend yield represents an attractive return meanwhile.
Exhibit 8: Peer valuation data
Share price (local currency) |
Market cap (m, |
Current year P/E (x) |
Next year P/E (x) |
Current year ROE (%) |
Next year ROE (%) |
Price/BV |
Dividend yield (%) |
|
Private equity group |
||||||||
Partners Group |
597 |
15,325 |
28.1 |
25.7 |
35.3 |
34.5 |
9.6 |
2.6% |
Blackstone |
33.45 |
40,135 |
11.5 |
10.5 |
25.6 |
32.8 |
5.8 |
5.0% |
Fortress |
7.96 |
3,086 |
7.9 |
7.8 |
N/A |
N/A |
N/A |
5.8% |
KKR |
18.76 |
15,255 |
8.5 |
7.7 |
16.4 |
17.9 |
1.4 |
3.4% |
3i Group |
9.27 |
11,601 |
10.6 |
10.1 |
14.7 |
14.0 |
1.4 |
2.9% |
Specialist group |
||||||||
Apollo |
27.4 |
11,007 |
10.8 |
9.8 |
33.8 |
69.1 |
6.9 |
4.6% |
Ashmore |
3.468 |
3,201 |
16.5 |
16.7 |
22.2 |
19.2 |
3.4 |
4.8% |
Man Group |
1.582 |
3,374 |
10.6 |
8.3 |
13.8 |
18.5 |
1.5 |
5.7% |
Patrizia |
17.15 |
1,615 |
22.3 |
17.8 |
8.2 |
9.5 |
1.8 |
0.0% |
Lloyd Fonds |
3.735 |
38 |
9.1 |
8.1 |
16.6 |
15.7 |
1.4 |
4.3% |
MPC |
6.00 |
206 |
15.0 |
11.3 |
12.8 |
15.1 |
1.8 |
0.0% |
Conventional group |
||||||||
Aberdeen |
2.894 |
4,889 |
13.4 |
12.9 |
13.1 |
12.4 |
2.3 |
6.7% |
Azimut |
18.11 |
2,936 |
13.8 |
13.0 |
28.8 |
28.5 |
3.6 |
5.5% |
Henderson |
232 |
6,755 |
14.0 |
12.6 |
15.0 |
15.9 |
2.0 |
0.0% |
Jupiter |
5.04 |
2,973 |
15.0 |
14.5 |
24.4 |
22.7 |
3.6 |
2.9% |
Schroders |
31.79 |
10,877 |
16.1 |
15.2 |
17.0 |
16.5 |
2.6 |
2.9% |
Averages |
||||||||
Private equity |
13.3 |
12.4 |
23.0 |
24.8 |
4.5 |
3.9% |
||
Specialist |
14.0 |
12.0 |
17.9 |
24.5 |
2.8 |
3.2% |
||
Conventional |
14.4 |
13.6 |
19.7 |
19.2 |
2.8 |
3.6% |
||
All |
13.9 |
12.6 |
19.8 |
22.8 |
3.3 |
3.6% |
Source: Bloomberg data as at 2 June 2017
Sensitivities
With an average age of c 8.5 years, LF’s existing assets will over time reduce as investments reach a mature stage and exits are sought. Management is focused on optimising the returns that can be realised from these assets, but for longer-term growth it is crucial that LF is able to source a sufficient quantity of attractive assets and investors for these. In addition to LF’s sourcing, asset management, and distribution strengths, there are a number of external factors that may affect its ability to achieve this, as listed below:
■
An increase in interest rates could be expected to have a dampening effect on investor demand for real assets and negatively affect LF’s ability to grow its assets under management, although the broad range of assets types offered by LF is likely to offer some protection.
■
An economic slowdown would be likely to reduce the returns available on real assets, limiting returns on existing funds and investor appetite for new investments.
■
Currency risks are a feature of shipping assets in particular (where revenues are typically denominated in US dollars) but are a factor for most international real assets. Most of this currency risk is carried by the separate fund entities and management indicates that the majority of LF revenues are denominated in euros. As such LF has no stated hedging policy. Currency risks within the funds may have an indirect impact on LF in terms of the profitability of the funds and their ability to pay fees to LF, as well as the potential returns that LF may earn on its fund investments. We understand that hedging is carried out at the fund level but the extent of this is not disclosed.
■
Legal risks, in particular related to the prospectus based issuing process of retail focused funds, can create issues many years after fund issuance if the information provided can be shown to be incomplete, inaccurate, or misleading. According to the 2016 annual report, as of 31 December 2016, LF was involved in a total of 207 (2015: 152) prospectus liability disputes for damages involving nominal capital of c €9.4m (2015: €7.1m), as well as a smaller number of disputes where it is indirectly a party to the claim. Management believes that its insurance arrangements adequately cover any potential liability. Management also notes the possibility that incorrect advice given by third parties (eg retail partners) involved in the selling of LF investment products may be deemed to come within the responsibility of the product supplier.
■
Competition for real assets is strong from large, well resourced asset managers and investors alike, and an inability to source attractive assets would negatively affect LF’s ability to grow assets under management.
Frankfurt +49 (0)69 78 8076 960 Schumannstrasse 34b 60325 Frankfurt Germany |
London +44 (0)20 3077 5700 280 High Holborn London, WC1V 7EE United Kingdom |
New York +1 646 653 7026 295 Madison Avenue, 18th Floor 10017, New York US |
Sydney +61 (0)2 8249 8342 Level 12, Office 1205 95 Pitt Street, Sydney NSW 2000, Australia |
|
Research: Healthcare
Photocure announced results for Q117 with 9% growth for the Hexvix/Cysview franchise compared to Q116. The US was a major driver, up 32% to NOK10m, though the Nordics fell by 4% to NOK9.7m due to currency and weakness in Denmark. Importantly, the company also recently announced that its Phase III trial in the bladder cancer surveillance market was successful, which should enable it to receive marketing authorisation in that market.