AJ Lucas’s FY18 (to end June 2018) results highlighted a material increase in drilling service revenues (+70%) and margins (+635% EBITDA). Based on AJL’s current order book and leading indicators, management expects rig utilisation and mining sector drilling activity to be sustained in FY19 with robust margins after AJL’s exit from legacy contracts in the coal seam gas and water markets. Our updated valuation reflects expected engineering and construction sales proceeds of A$25m and an increased valuation for drilling services. The net result is an increase in our P50 valuation for AJL Lucas of A$0.93/share (from A$0.86/share).
Written by
AJ Lucas Group |
Positive momentum in drilling services |
Business update |
Oil & gas |
24 September 2018 |
Share price performance
Business description
Next events
Analysts
AJ Lucas Group is a research client of Edison Investment Research Limited |
|||||||||||||||||||||||||||||||||||||||||||||||||
AJ Lucas’s FY18 (to end June 2018) results highlighted a material increase in drilling service revenues (+70%) and margins (+635% EBITDA). Based on AJL’s current order book and leading indicators, management expects rig utilisation and mining sector drilling activity to be sustained in FY19 with robust margins after AJL’s exit from legacy contracts in the coal seam gas and water markets. Our updated valuation reflects expected engineering and construction sales proceeds of A$25m and an increased valuation for drilling services. The net result is an increase in our P50 valuation for AJL Lucas of A$0.93/share (from A$0.86/share).
Year end |
Revenue |
Gross profit (A$m) |
Underlying EBITDA* (A$m) |
Capex |
Net debt |
06/17 |
122.6 |
1.4 |
(3.8) |
(12.8) |
85.1 |
06/18 |
127.1 |
21.6 |
15.4 |
(13.5) |
75.0 |
06/19e** |
127.2 |
17.8 |
13.5 |
(23.0) |
86.3 |
06/20e |
129.7 |
18.2 |
13.9 |
(3.0) |
77.7 |
Note: *Before share of loss from equity accounted investees, UK investment overhead, asset sales and one-off costs. **Assumes sale of Lucas Engineering & Construction.
Drilling services recovery
A reported step-change in drilling services profitability was well ahead of the prior year, with underlying FY18 EBITDA growing from a low base to A$19.7m (from FY17 A$2.7m). Higher rig utilisation and a shift away from low/negative margin contracts in the coal seam gas and water sectors were key drivers. We concur with management that current profitability appears to be sustainable in FY19 based on leading (exploration metres drilled) and lagging indicators (coal shipments) in the coal sector. Our drilling services valuation at 6x EBITDA (three-year average underlying drilling services EBITDA) increases to A$54m from A$34m previously.
Improved outlook provides options for re-finance
An improved outlook for AJL’s underlying drilling services business, combined with successful gas flows at Preston New Road, should provide the company with opportunities to recapitalise. Current debt facilities remain onerous at an interest rate of 18%, and sustained drilling services performance may provide access to more conventional and less expensive debt instruments.
Valuation: P50 valuation dominated by UK shale
Our updated AJL valuation at $A0.93/share is dominated by our P50 valuation of the company’s UK shale exposure. Ongoing maintenance capex and net share of UK shale capex through to end FY19 is likely to be funded through a combination of cash generated from drilling services, E&C sale proceeds and drawdown on available credit of US$9m. In addition, under Cuadrilla’s farm-in agreement with Spirit Energy (a subsidiary of Centrica), in order for Spirit to maintain its 25% interest in the PEDL165 licence it is obliged to fund a further £46.7m (gross) of costs once first gas has been flowing for six months.
Drilling services: Recovery underway
AJL’s drilling division had a significantly improved FY18 driven by coal mine de-gassing and directional drilling demand from tier 1 clients in Australia. Drilling revenues grew by 70% to A$124m with underlying EBITDA of A$19.7m (+635%), generating an EBITDA margin of 15.9%. This step change in revenues and profitability was driven by several factors: AJL’s rig fleet utilisation was materially higher year-on-year and margins benefitted from the completion of lower margin legacy contracts in the coal seam gas and water markets. Management shifted drilling rigs back to the company’s core competency, mine de-gassing, while allocating under-utilised rigs to the mining exploration and production sector. AJL’s strong customer relationships, track record of delivery, focus on efficiency improvement and safety have helped drive order book growth and make AJL well placed to continue to benefit from a recent up-tick in coal mine activity. We continue to track data on shipped coal tonnage from ports in New South Wales and Queensland as well as mining exploration expenditure/metres drilled, in order to take a view on the sustainability of current drilling activity. Mining exploration expenditure saw material uptick in 2018, while shipped coal tonnage from port data we analysed appears to have stabilised (six-month average) close to historic highs.
|
Exhibit 1: Australian mining exploration expenditure and metres drilled |
Exhibit 2: Shipped coal tonnage from three major ports* |
|
|
|
Source: Australian Bureau Statistics, Edison Investment Research |
Source: Edison Investment Research. Note: *Dalrymple bay, Hay point and Abbot point coal terminals. |
|
Exhibit 1: Australian mining exploration expenditure and metres drilled |
|
|
Source: Australian Bureau Statistics, Edison Investment Research |
|
Exhibit 2: Shipped coal tonnage from three major ports* |
|
|
Source: Edison Investment Research. Note: *Dalrymple bay, Hay point and Abbot point coal terminals. |
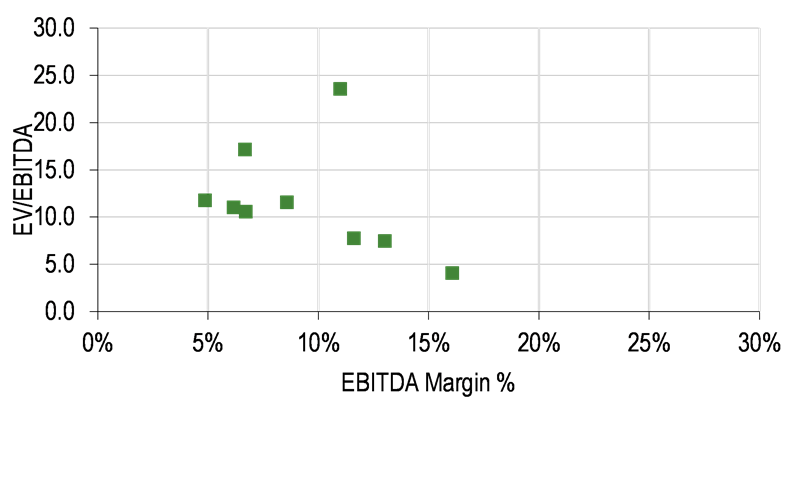
We continue to value drilling services based on three-year average underlying EBITDA and an EV/EBITDA multiple based on the company’s ASX listed peers. Given the volatility in both revenues and margins, we use an average of EBITDA for FY17, FY18 and FY19e and apply a valuation multiple of 6x EBITDA which values drilling services at A$54m (Book value of drilling service plant and equipment stands at A$26.6m and receivables at A$27.2m). We see room to increase our valuation as activity levels and margins stabilise and a higher EBITDA multiple is justified. Management currently guides at a similar outturn for FY19e as FY18 based on the group’s order book and coal mining activity levels. Current rig utilisation stands at c 28 rigs out of a fleet of 39 providing scope for top-line growth if activity levels continue to rise.
|
Exhibit 3: Drilling EBITDA and margin expectations |
Exhibit 4: ASX-listed comparables |
|
|
|
Source: Edison Investment Research |
|
Exhibit 3: Drilling EBITDA and margin expectations |
|
|
Source: Edison Investment Research |
|
Exhibit 4: ASX-listed comparables |
|
|
Source: Edison Investment Research |
UK shale: Potential gas flows in Q418
Cuadrilla (47.45% owned by AJ Lucas) completed drilling the UK’s first ever horizontal shale wells earlier this year. The first of two horizontal wells at Preston New Road (PNR) was completed in April 2018, penetrating the Lower Bowland shale to a depth of 2,300m and extended laterally by 782m. The second well at PNR was completed in July 2018 penetrating the Upper Bowland shale at 2,100m and extended horizontally for 743m. Cuadrilla has consent to hydraulically fracture the first of the two laterals (due imminently) and has submitted an application for consent to fracture the second horizontal.
Under Cuadrilla’s farm-in agreement with Spirit Energy, for Spirit to maintain its 25% interest in the PEDL165 licence it is obliged to fund a further £46.7m (gross) of costs once first gas has been flowing for six months. Our financial forecasts assume a net A$20m contribution to fund ongoing activity at Cuadrilla in FY19 prior to the drawdown of the outstanding Spirit Energy carry.
Edison recently carried out a probabilistic valuation of Cuadrilla’s UK shale acreage; this analysis can be found in our initiation report. Key outputs from our analysis include an estimated 67% chance of commercial success for UK shale based on input distributions for type curve (Anderson Thompson type curve as published by Cuadrilla), well cost (US analogues adjusted for UK), gas price (forward curve), activity rates and a risked valuation of US$2,142/acre.
UK shale unit NPV of risked diluted P50 US$2,142/acre
|
Exhibit 5: Bowland implied US$/acre values (commercial success case) |
|
|
■ The mean implied unrisked US$/acre value from our analysis is US$7,675/acre with P50 of US$6,418/acre. ■ This only assumes positive values for US$/acre, ie a commercial success case. ■ Including a commercial success risking of 67%, this drops to P50 US$4,284/acre. Reducing again by 50% to reflect potential farm-out dilution, this falls to US$2,142/acre. ■ Edison’s calculated unit value range and P50 value is comparable to historical UK shale transaction values. |
|
Source: Edison Investment Research |
|
Valuation sensitivities – type curve a key driver
Exhibit 6 below provides an insight into key valuation sensitivities. IP (initial production) rate, estimated ultimate recovery (EUR), gas price and well cost are key sensitivities. The sensitivity tornado shows the impact on our unrisked P50 UK shale valuation when the top and bottom 10% of our input distributions are used in our valuation. This demonstrates that given the known uncertainty ranges for key inputs the most sensitive factor from a valuation perspective is IP rate with low initial rate scenarios driving negative NPVs. We believe that Cuadrilla’s upcoming appraisal programme at Preston New Road will reduce uncertainty on the IP rate and EUR, providing for a tighter valuation range.
|
Exhibit 6: Key sensitivities to NPV distribution (US$m) – sensitivity bounded by top/bottom 10% point values from assigned input distributions (ranked by effect on output P50) |
|
|
■ Based on assigned distributions, the key sensitivities for NPV are well IP rate, EUR, gas price and well cost. ■ We expect uncertainty over IP rate to be reduced once the Preston New Road flow tests are concluded in late 2018, early 2019. ■ Recovery factor (ranging from 3% to 13%) is less of a driving factor over our modelling period out to 2050. ■ Negative values shown in dark green. |
|
Source: Edison Investment Research |
|
Our analysis also suggests that in generating a positive NPV15, IP rate needs to be at a minimum 5mmscfd and EUR at least 2.3bcf for a 2.5km lateral. We expect initial test rates from the first well at Preston New Road to be greater than those seen at the 2011 Preese Hall-1 vertical exploratory with 3 frac-stages at 400-500mscfd.
Valuation
Key changes to our valuation from our April 2018 initiation are highlighted below:
■
Mark to market for net debt positon at FY18 (June 2018)
■
Inclusion of expected cash proceeds from the sale of engineering and construction of A$25m
■
Higher valuation for drilling services based on 6x three-year average EBITDA (FY17, FY18 and FY19).
■
No changes to our UK shale gas P50 probabilistic valuation.
■
FX rate of A$/US$ of 1.3 (reflecting the six-month average rate to end June 2018).
A waterfall chart of our update valuation is provided in the Exhibit below.
|
Exhibit 7: AJL group valuation waterfall |
|
|
Source: Edison Investment Research |
P50 (mid-case) group valuation
Our sum of the parts (SOTP) group valuation incorporates a risked P50 commercial success case UK shale valuation, a deduction for UK shale overheads, balance sheet adjustments and valuation of Lucas Drilling Services (LDS). This equates to a group valuation of A$0.93/share, as broken down in Exhibit 8 below.
Exhibit 8: AJL SOTP valuation
Recoverable reserves |
|
Net risked |
Value per share |
|||||
Asset |
Country |
Diluted WI |
CoS |
Gross |
Net |
NPV/mcf |
value |
risked |
|
|
% |
% |
bcf |
bcf |
A$/mcf |
A$m |
A$/share |
Net (debt) at end 2018 actual |
100% |
(75) |
(0.10) |
|||||
UK SG&A - NPV10 of 2yrs |
UK |
100% |
(4) |
(0.01) |
||||
Lucas E&C sales proceeds |
Australia |
100% |
25 |
0.03 |
||||
Lucas Drilling Services 6x 3yr avg EBITDA |
Australia |
100% |
54 |
0.07 |
||||
Lucas net UK shale appraisal costs ex Spirit Energy carry |
UK |
100% |
(20) |
(0.03) |
||||
Net UK shale valuation P50* |
UK |
50% |
67% |
10,446 |
2,279 |
0.45 |
716 |
0.96 |
Valuation |
|
|
|
|
|
|
696 |
0.93 |
Source: Edison Investment Research. Note: *Based on risked P50 NPV output from probabilistic model.
Financials and funding
Following a A$51.2m equity fundraise in February 2018, which included partial conversion of the Kerogen loan facility and a A$11.3m repayment of AJL’s senior loan note, total debt was reduced to A$84m (net debt A$75m) from A$107m at FY17.
Following the end of the reported financial year, AJL reached agreement with OCP Asia to increase the headroom on its senior loan note facility to allow the ability to draw down an additional US$9m and to extend the maturity of the facility to 31 January 2020 (from July 2019). The requirement to reduce the facility principal by US$20m was also deferred to 30 June 2019 (from 30 September 2018). In addition, Kerogen has agreed to extend the term of its loan facility from 31 December 2019 to the earlier of 31 July 2020 or six months from the full repayment of senior loan notes.
Outstanding debt instruments command an 18% interest rate, therefore cost of capital is high relative to the company’s drilling service and E&P peers. We would expect re-financing to deliver a significantly lower cost of debt as drilling service profitability stabilises and in the event of successful gas flows from Cuadrilla. Both senior and subordinated are provided by material, supportive shareholders in AJL.
Exhibit 9: Debt instruments
Debt instrument |
Amount outstanding* |
Maturity |
Rate |
|
Kerogen Subordinated (US$) |
A$40.3m |
July 2020 or three months from full repayment of senior loan notes |
16% initially increasing to 18% from June 2018 |
|
Senior Loan note Senior Secured (US$) |
A$44.6m |
January 2020 |
18% paid 12% quarterly and 6% accruing until termination |
Source: Edison Investment Research. Note: Kerogen is AJL’s largest shareholder. *Carrying amount including interest bearing liability.
Short-term liquidity
At the end of FY18 (end June 2018), AJL had A$9.8m of cash and is expected to receive A$25m cash from the sale of engineering and construction (E&C) over the course of FY19. Depending on the timing of E&C, sale cash receipts and cash outflows (capex A$4m on drilling maintenance and A$20m contribution to Cuadrilla) we see a potential need for drawdown on AJL’s OCP debt headroom (US$9m) or an equity raise in the event of UK shale appraisal success. We provide a cash flow bridge below based on our modelled assumptions (which do not include any dividends from Cuadrilla in the event of gas sales).
|
Exhibit 10: Short-term net debt evolution* |
Exhibit 11: FY18 to FY19 cash flow bridge* |
|
|
|
Source: Edison Investment Research. Note: *Assumes net UK shale capex funded through farm-out in 2020. |
Source: Edison Investment Research. Note: *Assumed drawdown of $9m available under OCP facility and excludes accrued interest. |
|
Exhibit 10: Short-term net debt evolution* |
|
|
Source: Edison Investment Research. Note: *Assumes net UK shale capex funded through farm-out in 2020. |
|
Exhibit 11: FY18 to FY19 cash flow bridge* |
|
|
Source: Edison Investment Research. Note: *Assumed drawdown of $9m available under OCP facility and excludes accrued interest. |
Exhibit 12: Financial summary
June |
|
A$m |
2016 |
2017 |
2018 |
2019e |
2020e |
|
|
|
IFRS |
IFRS |
IFRS |
IFRS |
IFRS |
PROFIT & LOSS |
|||||||
Revenue (continuing operations) |
|
|
126.0 |
122.6 |
127.1 |
127.2 |
129.7 |
Cost of Sales |
(105) |
(121) |
(106) |
(109) |
(112) |
||
Gross Profit |
21 |
1 |
22 |
18 |
18 |
||
Underlying EBITDA* |
|
|
14.6 |
(3.8) |
15.4 |
13.5 |
13.9 |
Operating Profit (before amort. and except.) |
|
|
(11) |
(12) |
7 |
6 |
9 |
Intangible Amortisation |
0 |
0 |
0 |
0 |
0 |
||
Exceptionals |
0 |
0 |
0 |
0 |
0 |
||
Other / P&L equity accounted investees |
(7) |
(3) |
8 |
(2) |
56 |
||
Operating Profit |
(17) |
(15) |
16 |
4 |
64 |
||
Net Interest |
(2) |
(24) |
(24) |
(15) |
(13) |
||
Profit Before Tax (norm) |
|
|
(12.7) |
(36.3) |
(16.7) |
(8.9) |
(4.0) |
Profit Before Tax (FRS 3) |
|
|
(19) |
(39) |
(9) |
(11) |
52 |
Tax |
0 |
0 |
0 |
0 |
0 |
||
Profit After Tax (norm) |
(19) |
(39) |
(9) |
(11) |
52 |
||
Profit After Tax (FRS 3) |
(19) |
(39) |
(9) |
(11) |
52 |
||
Average Number of Shares Outstanding (m) |
395.0 |
585.0 |
749.9 |
749.9 |
749.9 |
||
EPS - normalised (c) |
|
|
(4.93) |
(6.67) |
(1.14) |
(1.47) |
6.89 |
EPS - normalised fully diluted (c) |
|
|
(4.93) |
(6.67) |
(1.14) |
(1.47) |
6.89 |
EPS (IFRS) (c) |
|
|
(0.00) |
(0.01) |
(0.00) |
(0.00) |
0.01 |
Dividend per share (c) |
0.0 |
0.0 |
0.0 |
0.0 |
0.0 |
||
Gross Margin (%) |
16.9 |
1.1 |
17.0 |
14.0 |
14.0 |
||
EBITDA Margin (%) |
-1.9 |
-7.1 |
-4.2 |
0.9 |
1.6 |
||
Operating Margin (before GW and except.) (%) |
-8.4 |
-9.9 |
5.8 |
5.0 |
6.7 |
||
BALANCE SHEET |
|||||||
Fixed Assets |
|
|
164 |
164 |
184 |
199 |
253 |
Intangible Assets |
18 |
21 |
36 |
36 |
36 |
||
Tangible Assets |
39 |
38 |
28 |
45 |
43 |
||
Investments |
106 |
105 |
121 |
118 |
174 |
||
Current Assets |
|
|
66 |
77 |
83 |
75 |
65 |
Stocks |
16 |
31 |
41 |
36 |
31 |
||
Debtors |
26 |
22 |
27 |
22 |
17 |
||
Cash |
23 |
22 |
10 |
16 |
16 |
||
Other |
1 |
1 |
5 |
0 |
0 |
||
Current Liabilities |
|
|
(70) |
(35) |
(59) |
(59) |
(59) |
Creditors |
(36) |
(34) |
(42) |
(42) |
(42) |
||
Short term borrowings |
(35) |
(1) |
(17) |
(17) |
(17) |
||
Long Term Liabilities |
|
|
(72) |
(107) |
(69) |
(86) |
(78) |
Long term borrowings |
(71) |
(106) |
(68) |
(86) |
(77) |
||
Other long term liabilities |
(1) |
(1) |
(1) |
(1) |
(1) |
||
Net Assets |
|
|
87 |
98 |
139 |
128 |
180 |
CASH FLOW |
|||||||
Operating Cash Flow |
|
|
(25) |
(27) |
(13) |
22 |
12 |
Net Interest |
0 |
0 |
0 |
0 |
0 |
||
Tax |
0 |
0 |
0 |
0 |
0 |
||
Capex |
(6.6) |
(12.8) |
(13.5) |
(23.0) |
(3.0) |
||
Acquisitions/disposals |
0 |
0 |
0 |
0 |
0 |
||
Financing |
5 |
15 |
15 |
0 |
0 |
||
Dividends |
0 |
0 |
0 |
0 |
0 |
||
Net Cash Flow |
(26) |
(25) |
(11) |
(1) |
9 |
||
Opening net debt/(cash) |
|
|
63 |
83 |
85 |
75 |
86 |
HP finance leases initiated |
0 |
0 |
0 |
0 |
0 |
||
Other |
6 |
23 |
22 |
(10) |
(0) |
||
Closing net debt/(cash) |
|
|
83.2 |
85.1 |
75.0 |
86.3 |
77.7 |
Source: AJ Lucas accounts, Edison Investment Research. Note: *Before share of loss from equity accounted investees, UK investment overhead, asset sales and one-off costs.
|
|
PureCircle’s FY18 results demonstrate the business is recovering well from the problems in North America. Transition to the superior StarLeaf stevia product is proceeding well and should continue to be accretive to margins. The innovation pipeline remains strong and the company is well positioned to continue to capitalise on the shift away from sugar and towards natural sweeteners.