Share plc’s FY16 result was modestly ahead of our expectation and it is making progress in its work to enhance its customer proposition and servicing through significant investment in IT. The results of this should become more evident in the current year and help continue the growth in assets under administration (AUA), potentially helped by further acquisitions of books of accounts and corporate partnerships. As a platform with relatively stable costs once the IT renewal has been completed, increasing scale should feed through to geared profit improvement. Our central valuation of 29p is maintained.
Written by
Share |
Poised for delivery |
FY16 results |
Financial services |
15 March 2017 |
Share price performance
Business description
Next events
Analysts
Share is a research client of Edison Investment Research Limited |
|||||||||||||||||||||||||||||||||||||||||||||||||
Share plc’s FY16 result was modestly ahead of our expectation and it is making progress in its work to enhance its customer proposition and servicing through significant investment in IT. The results of this should become more evident in the current year and help continue the growth in assets under administration (AUA), potentially helped by further acquisitions of books of accounts and corporate partnerships. As a platform with relatively stable costs once the IT renewal has been completed, increasing scale should feed through to geared profit improvement. Our central valuation of 29p is maintained.
Year end |
Revenue (£m) |
PBT* |
EPS* |
DPS |
P/E |
Yield |
12/15 |
14.1 |
0.6 |
0.40 |
0.74 |
68.0 |
2.7 |
12/16 |
14.6 |
0.0 |
0.00 |
0.25 |
N/A |
0.9 |
12/17e |
16.5 |
0.3 |
0.12 |
0.30 |
215.2 |
1.1 |
12/18e |
17.5 |
0.7 |
0.36 |
0.50 |
73.3 |
1.8 |
Note: *PBT and EPS are normalised, excluding exceptional items and share-based payments.
FY16 results
AUA increased by 32% to £3.7bn in 2016, reflecting both market strength (the FTSE All Share Index was up 12%), transfers in, organic growth and the benefit of book acquisitions and partnerships. Revenue was up by 4% but this includes interest income where lower rates depressed the contribution further, and fee and commission income alone were up 8%. Reported pre-tax profit was £1m (vs £0.9m in FY15), including a £2.1m profit on the sale of London Stock Exchange shares. There was a marginal normalised profit after tax (vs £0.6m) reflecting investment costs. Following the adoption of a new dividend policy based on earnings and cash generation a dividend of 0.25p was declared (vs 0.74p in FY15), slightly ahead of our estimate.
Outlook: More positive trends
Following a particularly poor market background for retail investment activity in H215 and the H116 uncertainty ahead of the Brexit referendum, activity levels have picked up, an improvement that has been sustained into the current year. This year should also benefit from full inclusion of accounts acquired during 2016 and the initiation of services for Computershare, together with the services to be provided to an as yet unnamed wealth manager. IT investment should also see more tangible benefits with the launch of a new version of the Share app, which will include dealing and other functionality, as well as improvements to the website to ease customer use. We now forecast an underlying profit rather than loss for 2017, while tempering our expectation for 2018 to allow more fully for the costs of investments.
Valuation: Unchanged
Our DCF assumptions take into account near-term depressed profits and a return to significant profitability over the medium term as operational gearing comes into play. Our central valuation of 29p is unchanged (see page 7).
Customer-focused retail stockbroker
The Share Centre, Share’s main business, was launched in 1991 to provide execution-only stockbroking services to individual investors. In addition to share dealing accounts, The Share Centre also offers accounts for ISAs, SIPPs and investment clubs. It has c 250,000 customer accounts and £3.7bn of AUA. Customers are signed up individually and through corporate partnerships such as those with Henderson for investment trust ISA accounts, Barclays (certificated and investment club dealing services), Computershare (certificated and corporate sponsored nominee dealing) and Invesco Perpetual (ISA accounts). Revenue is generated from three sources: account fees, trading commissions and interest income, split 46.4%, 48.2% and 5.4% respectively for 2016. Share’s account fee structure is differentiated from many peers by being fixed per account rather than based on the value of AUA. Transaction commissions are either charged at 1% with a minimum of £7.50 or, for those who deal frequently or in large sizes, on a flat £7.50 per bargain basis with a £20 quarterly fee (a 30% discount is offered to holders of 500 or more shares in Share plc). This means that the accounts frequently rank favourably in comparisons of providers (depending on portfolio size and frequency of trading).
FY16 results
Share’s FY16 results were ahead of our estimates with revenues 2% above our forecast, while a small underlying net profit rather than a loss was recorded. Progress is being made in the programme of IT investment aimed at improving the customer proposition and servicing, enabling Share to scale the business and respond to market changes in a timely manner. See Exhibit 1 for details of the profit and loss for the full-year and half-year periods. The main points are highlighted below:
■
AUA increased by 32% to £3.7bn, reflecting market strength (FTSE All Share +12%) and net flows. Segregated customer deposits stood at £296m compared with £176m at end 2015.
■
The three in-house fund of funds, while still small, now manage £70m compared with £50m and are seen as providing an easy entry point for investors into the world of equity investing.
■
The level of dealing activity spiked after the Brexit vote and remained at a higher level, allowing full-year total revenues to increase by 4% after a reduction in the first half. Interest income was pressured further by lower rates, and fee and commission revenue alone increased by 8%.
■
Overall costs (nearly £16m) were up 6.8%, including an increase in staff costs of 8% partly reflecting an increase in staff numbers from 169 to 185 as IT capabilities and in-house marketing have been strengthened. Amortisation cost increased sharply (still only £0.1m), reflecting capitalised investment in systems development.
■
Reported pre-tax profit was £1.0m versus £0.9m, including a one-off gain of £2.1m on the partial sale of shares in the London Stock Exchange. There was a small underlying profit in 2016 compared with a profit of £0.58m (excludes one-off items, among which is the FSCS levy of £0.272m versus £0.478m).
■
Underlying, basic, diluted EPS was 0.0p compared with 0.4p for 2015. Reported earnings per share were 0.5p (unchanged).
■
A dividend per share of 0.25p was announced compared with 0.74p reflecting the new policy adopted during the year under which payments will be based on earnings and cash generated.
■
The balance sheet remains strong with year-end net cash of £11.4m (£11.7m FY15).
Exhibit 1: Results summary: H216 and FY16
Year-end 31 December |
H115 |
H215 |
H116 |
H216 |
H216 vs H215 % |
2015 |
2016 |
2016 vs 2105 % |
£000 except where stated |
||||||||
Account fees |
3,199 |
3,201 |
3,271 |
3,513 |
9.7 |
6,400 |
6,784 |
6.0 |
Dealing Commissions |
3,426 |
2,974 |
3,443 |
3,597 |
20.9 |
6,400 |
7,040 |
10.0 |
Interest and other income |
743 |
507 |
510 |
276 |
(45.6) |
1,250 |
786 |
(37.1) |
Revenue |
7,368 |
6,682 |
7,224 |
7,386 |
10.5 |
14,050 |
14,610 |
4.0 |
Total costs |
(7,451) |
(7,493) |
(7,892) |
(8,064) |
7.6 |
(14,944) |
(15,956) |
6.8 |
Operating profit |
(83) |
(811) |
(668) |
(678) |
(16.4) |
(894) |
(1,346) |
50.6 |
Investment revenues |
223 |
53 |
230 |
18 |
(66.0) |
276 |
248 |
(10.1) |
Other losses and gains |
2 |
1,477 |
628 |
1,491 |
0.9 |
1,479 |
2,119 |
43.3 |
Pre-tax profit |
142 |
719 |
190 |
831 |
15.6 |
861 |
1,021 |
18.6 |
Normalised pre tax |
608 |
(24) |
110 |
(156) |
584 |
(46) |
||
Tax |
(33) |
(163) |
(56) |
(228) |
(196) |
(284) |
||
Post-tax profit |
109 |
556 |
134 |
603 |
8.5 |
665 |
737 |
10.8 |
Normalised EPS (p) |
0.40 |
0.00 |
||||||
Dividend (p) |
0.74 |
0.25 |
(73.0) |
Source: Share plc, Edison Investment Research
As noted above, AUA rose strongly, accelerating the longer-term trend illustrated in Exhibit 2, helped by market strength, transfers-in from other providers and the benefit of additions through partnership or acquisition such as those agreed with Barclays and Hendersons.
|
Exhibit 2: Share plc AUA |
Exhibit 3: Share plc revenue analysis over time |
|
|
|
Source: Share plc |
Source: Share plc |
|
Exhibit 2: Share plc AUA |
|
|
Source: Share plc |
|
Exhibit 3: Share plc revenue analysis over time |
|
|
Source: Share plc |
Exhibit 3 shows an analysis of Share’s revenue over a similar timescale with a key feature being the way in which overall revenue has been broadly maintained in the face of two changes: the first being the adoption in 2013 of a flat fee structure that did not attempt to replace trail commission or to continue a model based on a percentage of assets; and the second, the dramatic contraction in interest income on customer cash balances reflecting central bank measures to guard against deflation. Interest income in 2016 accounted for 5.4% of revenue compared with 14.0% in 2013.
Share notes that last year its level of interest fell sharply while that of its peers increased (Exhibit 4). The company believes that some of its peers may use relatively higher risk counterparties to earn higher returns while those that are part of a bank may benefit from better rates. Share’s dealing and fee revenue growth outperformed a ComPeer-collected peer group over the period. (The peer group excludes Hargreaves Lansdown, which does not submit monthly information to ComPeer.) The relative performance of commission income benefited from a new partnership and acquisitions (see below), while fee income was bolstered by strong new account acquisition and a good year for the administration of EIS and Business Property Relief schemes (180 funds, 24 investment managers).
Reflecting these trends there has been a disparity between Share’s market share progression with and without interest income (Exhibit 5). For 2016, excluding interest income, Share’s revenue market share excluding interest reached a record level of 9.85% compared with 9.39% for 2015. Including interest income, the market share was lower at 7.64% versus 7.79%.
|
Exhibit 4: Share plc revenue analysis over time |
Exhibit 5: Share plc market share progress |
|
|
|
Source: Share plc, ComPeer |
|
Exhibit 4: Share plc revenue analysis over time |
|
|
Source: Share plc, ComPeer |
|
Exhibit 5: Share plc market share progress |
|
|
Source: Share plc, ComPeer |
Work on Share’s digital transformation was a feature of 2016 and remains in progress during the current year with more visible delivery set to become evident. Last year, the company launched its first mobile and tablet app for Apple and Android devices and, critically, is due to add dealing and other functionality later this year. The website is to be enhanced to improve customer usability while work on a new back-office system will be helped by the project that has already been completed to move the database on to new technology.
The central place of IT for Share reflects its concentration on its core retail broking business and strategy of putting customers first. Chairman Gavin Oldham comments that from inception the concentration in the business has been on servicing the customer accounts, not on securing transaction volumes alone. This was in order to establish long-term customer relationships and hence a sustainable business. This is also evident in the flat fee structure, which is in line with the nature of the costs in the business. Prospectively, this could mean that Share is well positioned from a competitive position as year-end statements highlight more clearly the level of fees investors are paying at other providers.
In 2015, Share signed a partnership agreement with Barclays Stockbrokers for certificated dealings and an acquisition of investment trust ISA accounts from Henderson. In 2016, in a further transaction with Barclays it acquired accounts for investment clubs, corporates and charities. Heads of terms were agreed with Computershare for the provision on a white label basis of certificated dealing and corporate nominee dealing services. Computershare provides registry services to more than 900 corporates in the UK, Ireland and Channel Islands and has 22 corporate nominee clients including Aviva, E.on, Rio Tinto, Standard Chartered and Vodafone. This service is due to be launched shortly and, ahead of this, a deceased estate service was launched in the second half of 2016. Share also announced the acquisition of a book of up to 8,700 (over £200m) ISA accounts from Invesco Perpetual (due to complete in April 2017) and that it is in advanced discussions with a leading wealth manager with development work to provide a streamlined administration service for part of the business already underway.
As part of its focus on the core retail broking business, Share decided to transfer the Authorised Corporate Director activity to another party (Treasury Capital Ltd). This is due to complete on 24 March. The business had cash of £0.774m at the year end and we assume that this will effectively stay with Share, although no terms have been disclosed.
Background and outlook
Exhibits 6 and 7 provide a reminder of the UK equity market background in recent years highlighting fluctuations in the FTSE All-Share Index but strong overall progress despite an uncertain economic and political background. The Volatility Index (sometimes termed a ‘fear gauge’) has shown a decline since the Brexit vote, creating a calmer background that has encouraged a higher level of retail transactions.
|
Exhibit 6: FTSE All-Share Index (total return) |
Exhibit 7: FTSE100 Implied Volatility Index |
|
|
|
Source: Thomson Datastream |
|
Exhibit 6: FTSE All-Share Index (total return) |
|
|
Source: Thomson Datastream |
|
Exhibit 7: FTSE100 Implied Volatility Index |
|
|
Source: Thomson Datastream |
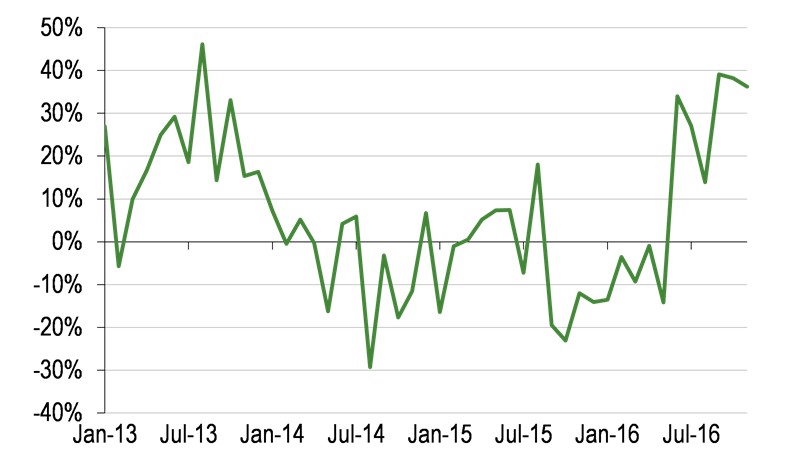
This is shown in Exhibits 8 and 9 with a noticeable pick-up in the level of transactions, even discounting the spike at the time of the Brexit referendum.
|
Exhibit 8: Retail trading volume (bargains) |
Exhibit 9: Retail trading volume (change vs prior year) |
|
|
|
Source: ComPeer, London Stock Exchange |
|
Exhibit 8: Retail trading volume (bargains) |
|
|
Source: ComPeer, London Stock Exchange |
|
Exhibit 9: Retail trading volume (change vs prior year) |
|
|
Source: ComPeer, London Stock Exchange |
Prospectively, global geopolitical uncertainty remains in place and in the UK and Europe there could be fluctuating sentiment towards news from Brexit negotiations. Having said this the UK economy has remained resilient compared with many expectations during 2015 and forecasts have generally been revised upwards. European growth expectations have also strengthened, albeit concerns remain over aspects of the eurozone.
For Share, a key determinant of future performance will be delivery of its digital transformation as this should provide an improved customer experience (Share continues to score well on Trustpilot ratings) and facilitate a scaling of the business through customer transfers in, further partnerships and acquisition of books of accounts. Eventually a move towards the normalisation of interest rates could also be beneficial for revenue. Assuming the current level of customer cash at c £300m, a 25bp improvement in rates received could add £0.75m to revenues that would drop straight through to pre-tax profit.
Financials
We have increased our revenue estimate for the current year (see Exhibit 10) to reflect the strong second half of 2016 and start to the current year, while cautiously leaving our 2018 estimate unchanged. As a result, our underlying profit forecast for 2017 has moved from loss to profit, although in revising our 2018 estimate we have allowed for higher costs resulting from continuation of investment through the current year tempering our profit estimate. Looking further ahead we would expect success in attracting new customers and further acquisitions of books of accounts or partnerships to generate operational leverage given the investment now being undertaken to refresh the technology base.
While the dividend payout was reduced from 0.74p to 0.25p for 2016, we expect the move back into greater profitability to be accompanied by a more rapid increase in dividend than previously expected.
Exhibit 10: Estimate revisions
Revenue (£m) |
PBT (£m) |
EPS (p) |
Dividend (p) |
|||||||||||||||||
Old |
New |
% chg |
Old |
New |
% chg |
Old |
New |
% chg |
Old |
New |
% chg |
|||||||||
2016 |
14.4 |
14.6 |
2% |
-0.9 |
0.0 |
N/A |
-0.49 |
0.00 |
N/A |
0.20 |
0.25 |
25% |
||||||||
2017e |
15.7 |
16.5 |
5% |
-0.2 |
0.3 |
N/A |
-0.06 |
0.12 |
N/A |
0.20 |
0.30 |
50% |
||||||||
2018e |
17.4 |
17.5 |
0% |
1.1 |
0.7 |
-42% |
0.68 |
0.36 |
-47% |
0.30 |
0.50 |
67% |
||||||||
Source: Edison Investment Research. Note: For 2016 new column = actual
Looking at Share’s cash flow for 2016, the main features were investment in intangibles of nearly £1.2m, reflecting work capitalised on system development. This was more than offset by the sale of shares in the London Stock Exchange, which meant that sales of available for sale investments totalled nearly £2.4m. Combined with a small operating cash inflow resulting from a working capital inflow and the dividend outflow of c £1m, the level of cash was only down modestly from £11.7m in FY15 to £11.4m.
From a regulatory perspective, Share still has a healthy margin above its target level of regulatory capital. Its resources stood at 2.6x the regulatory requirement; this compares with 3.6x for the prior year, partly reflecting a rise in the capital requirement from £5.1m in 2016 to £5.6m, but more importantly the deduction of the increased level of intangibles noted above together with the non-inclusion of the profit on the London Stock Exchange share sale in regulatory capital prior to audit. Prospectively, inclusion of this profit should act to offset the net increase of c £1m we expect in intangibles on the balance sheet in 2017.
Valuation
We have updated our comparative table, which includes selected measures for Share, Alliance Trust Savings (unquoted subsidiary of Alliance Trust) and Hargreaves Lansdown. As before, this underlines the scale of Hargreaves Lansdown with AUA of £70bn in total compared with Alliance Trust Savings at £13bn and Share on £3.7bn. The agreed purchase of TD Direct Investing by Interactive Investor will give that combination AUA of c £18bn. Given the potential benefits of scale, we would expect further consolidation on a medium- to longer-term view crystallising value for seller and buyer depending on the terms and how the industry pricing model evolves.
There is a wide variation in valuation multiples. Perhaps unsurprisingly, Hargreaves Lansdown, as market leader by a large margin with an established record of strong growth and profitability, is the most highly valued across each of the measures. Share is more expensive than Alliance Trust Savings in terms of adjusted value to AUA, but this can be explained by the higher revenue yield earned by Share, while in terms of adjusted value to revenue Share is valued below the other two companies. Increased scale through acquisition or organic growth would be likely to benefit profitability and hence valuation on these metrics.
Exhibit 11: Peer comparison
£m unless stated |
Share |
Alliance Trust Savings |
Hargreaves Lansdown |
Market capital |
38.9 |
6,215.6 |
|
Surplus capital (assumes cover of twice the regulatory requirement) |
5.4 |
55.2 |
|
Adjusted value |
33.6 |
54.0 |
6,160.4 |
Revenue |
14.6 |
13.7 |
369.8 |
AUA |
3,700 |
13,000 |
70,000 |
Market capital/revenue (x) |
2.7 |
N/A |
16.8 |
Market capital/AUA (%) |
1.1 |
N/A |
8.9 |
Adjusted value/revenue (x) |
2.3 |
3.9 |
16.7 |
Adjusted value/AUA (%) |
0.9 |
0.4 |
8.8 |
Source: Edison, companies’ disclosure. Note: valuation of Alliance Trust Savings from H116 results, revenue 2015 and AUA at end September 2016. Hargreaves Lansdown AUA and revenue (annualised) from H117.
To give an absolute indication of value we have also updated our DCF model using the same central assumptions but rolling our forecasts forward a year. Among the assumptions are two years of strong cash flow growth of 60% in 2020 and 2021 (following a return to reported profits of c £0.5m in 2019) and seven years of growth at 5%. We also assume a terminal multiple of 10x and a discount rate of 10%. Exhibit 12 sets out the sensitivity of the value output to changes in the discount rate and 2020-21 growth assumption. Our central valuation of 29p is unchanged.
Exhibit 12: Discounted cash flow valuation sensitivity (pence per share)
Discount rate |
|||||
2020 and 2021 growth |
8% |
9% |
10% |
11% |
12% |
0% |
20 |
20 |
19 |
18 |
18 |
30% |
26 |
25 |
23 |
23 |
22 |
60% |
32 |
31 |
29 |
28 |
26 |
80% |
38 |
36 |
34 |
32 |
30 |
Source: Edison Investment Research
Exhibit 13: Financial summary
£000 except where stated |
2014 |
2015 |
2016 |
2017e |
2018e |
|
Year end 31 December |
||||||
PROFIT & LOSS |
||||||
Account fees |
6,610 |
6,400 |
6,784 |
8,480 |
9,074 |
|
Dealing Commissions |
6,610 |
6,400 |
7,040 |
7,533 |
7,909 |
|
Interest and other income |
1,800 |
1,250 |
786 |
474 |
510 |
|
Revenue |
|
15,042 |
14,050 |
14,610 |
16,486 |
17,493 |
Cost of Sales (excl amortisation and depreciation) |
(14,579) |
(14,812) |
(15,727) |
(16,622) |
(17,284) |
|
EBITDA |
|
463 |
(762) |
(1,117) |
(135) |
209 |
Depreciation |
|
(104) |
(111) |
(121) |
(131) |
(150) |
Amortisation |
(11) |
(21) |
(108) |
(390) |
(400) |
|
Operating profit (pre-exceptional) |
|
348 |
(894) |
(1,346) |
(656) |
(341) |
Other |
60 |
1,479 |
2,119 |
0 |
0 |
|
Investment revenues |
308 |
276 |
248 |
201 |
198 |
|
Profit Before Tax (FRS 3) |
|
716 |
861 |
1,021 |
(455) |
(142) |
Profit Before Tax (norm) |
|
1,615 |
584 |
(46) |
329 |
658 |
Tax |
(109) |
(196) |
(284) |
0 |
0 |
|
Profit After Tax (FRS 3) |
|
607 |
665 |
737 |
(455) |
(142) |
Profit After Tax (norm) |
|
1,416 |
555 |
4 |
172 |
506 |
Average Number of Shares Outstanding (m) - excl treasury |
143.5 |
139.2 |
139.3 |
140.0 |
140.0 |
|
EPS - normalised (p) |
|
0.99 |
0.40 |
0.00 |
0.12 |
0.36 |
EPS - FRS3 (p) |
|
0.42 |
0.48 |
0.53 |
(0.33) |
(0.10) |
Dividend per share (p) |
0.62 |
0.74 |
0.25 |
0.30 |
0.50 |
|
EBITDA Margin (%) |
3.1% |
(5.4%) |
(7.6%) |
(0.8%) |
1.2% |
|
Normalised operating margin (%) |
8.3% |
2.2% |
(2.0%) |
0.8% |
2.6% |
|
BALANCE SHEET |
||||||
Fixed Assets (mainly Investments) |
|
9,405 |
8,083 |
8,341 |
9,420 |
9,485 |
Current Assets |
|
21,316 |
19,716 |
23,883 |
23,376 |
23,850 |
Total Assets |
|
30,721 |
27,799 |
32,224 |
32,796 |
33,335 |
Current Liabilities |
|
(8,450) |
(7,681) |
(13,384) |
(14,159) |
(14,659) |
Long term Liabilities |
(1,594) |
(1,418) |
(1,096) |
(1,096) |
(1,096) |
|
Net Assets |
|
20,677 |
18,700 |
17,744 |
17,541 |
17,580 |
CASH FLOW |
||||||
Operating Cash Flow |
|
348 |
(894) |
(1,346) |
(656) |
(341) |
Net cash from investing activities |
(434) |
1,990 |
483 |
(1,399) |
(417) |
|
Net cash from (used in) financing |
(736) |
(878) |
(1,019) |
(350) |
(420) |
|
Net Cash Flow |
|
(971) |
(992) |
(242) |
(2,108) |
(384) |
Opening net (debt)/cash |
|
13,626 |
12,655 |
11,663 |
11,421 |
9,313 |
Closing net (debt)/cash |
|
12,655 |
11,663 |
11,421 |
9,313 |
8,929 |
Source: Company accounts, Edison Investment Research
|
|
The company’s application for EU approval for vosaroxin approval in AML continues to progress. The company will go before the Oncology Division of the Scientific Advisory Group (SAG-O) in April with a Committee for Medicinal Products for Human Use (CHMP) decision likely by mid-year. We continue to expect a launch in H217. Also, the company plans to initiate a Phase Ib/II study of SNS-062, their BTK inhibitor, in patients with various advanced B-cell malignancies in H117.