BCA Marketplace (BCA) offers unique access to each stage of the vehicle lifecycle. Dominant in used car vehicle exchange, the company has built up its presence in vehicle buying through We Buy Any Car (WBAC) and is developing its Automotive Services division. Going forward, the company aims to develop its market-leading positions through its range of physical and digital (‘phygital’) offerings and services in the UK and Europe.
Written by
BCA Marketplace |
‘Phygital’ vehicle remarketing and services |
Initiation of coverage |
Automobiles & parts |
1 August 2018 |
Share price performance
Business description
Next events
Analysts
BCA Marketplace is a research client of Edison Investment Research Limited |
|||||||||||||||||||||||||||||||||||||||||||||||
BCA Marketplace (BCA) offers unique access to each stage of the vehicle lifecycle. Dominant in used car vehicle exchange, the company has built up its presence in vehicle buying through We Buy Any Car (WBAC) and is developing its Automotive Services division. Going forward, the company aims to develop its market-leading positions through its range of physical and digital (‘phygital’) offerings and services in the UK and Europe.
Year end |
Revenue (£m) |
PBT* |
EPS* |
DPS |
P/E |
Yield |
03/17 |
2,030 |
97.4 |
9.1 |
6.75 |
25.8 |
2.9 |
03/18 |
2,432 |
120.9 |
11.4 |
8.55 |
20.6 |
3.6 |
03/19e |
2,663 |
127.2 |
12.3 |
9.35 |
19.1 |
4.0 |
03/20e |
2,903 |
137.1 |
13.2 |
10.15 |
17.8 |
4.3 |
Note: *PBT and EPS are normalised, excluding amortisation of acquired intangibles, exceptional items and share-based payments.
Lubricating European vehicle remarketing
With over 70 years of operating vehicle auctions, BCA is by far the largest vehicle exchange in the UK. It sold 1.0m used cars in FY18, with a c 60% share of auction volumes, which account for around 20% of annual used car market transactions. It has been developing online and digital services since the 1990s, and provides additional services such as grading, vehicle checks and buyer finance to increase value per vehicle. In 2013, it acquired We Buy Any Car (WBAC), which is the UK’s leading online vehicle buying company. Since 2015 it has also built up through-lifecycle physical services by a series of acquisitions, creating the UK’s largest car transporter fleet and offering vehicle preparation, storage, inspection, refurbishment and logistics. It is also operating online and in physical auctions across nine countries in Europe, selling 0.4m cars last year, increasing dealer awareness of auctions and injecting digital tools from the UK as volumes rise. It is creating a standard buyer offering through its One Europe programme as an increasing number of cars are sold across borders.
Executing the growth strategy
FY18 saw strong progress with good growth in volumes across remarketing exchanges as well as WBAC, and improved value add from incremental services. Further synergies should accrue from combining the digital and physical services to provide an integrated offering in the UK, and rolling these out across Europe. The recently announced five-year Auto Services Solution flagship contract with BMW UK is the largest deal ever won by BCA. We feel it verifies that the strategy to provide a full range of solutions across the automotive supply chain is gaining traction with customers, and BCA appears best positioned to win more of these agreements.
Valuation: Apax approach highlighted value
Our fair value, which we calculate as a simple average of a capped DCF and a peer group comparison, currently stands at 252p. The recent approach by Apax Partners at 200p was rebuffed and clearly management feels that the growth strategy can add significant value as the fully integrated service model is matured.
Investment summary
Company description: Europe’s largest vehicle marketplace
BCA Marketplace can trace its roots back over 70 years. However, current ownership and management has been in place since April 2015 when the group was bought for a £1.2bn enterprise value from private equity and listed on the LSE. It is Europe’s largest vehicle remarketing business, operating both physical and online auctions developed since the early 1990s. In FY18 it remarketed over 1.0m used vehicles in the UK and 362k in nine countries in Europe. A series of acquisitions since its listing has built a range of services such as vehicle storage, preparation, inspection and logistical services supporting vehicles through their lifecycles. BCA now operates the UK’s largest vehicle transporter fleet with more than 800 vehicles. We Buy Any Car (WBAC), the UK’s leading, online-based, used vehicle purchasing operation, was acquired in 2013.
Strategy: Let’s get ‘phygital’
BCA aims to develop its market-leading positions through its range of physical and digital (phygital) offerings and services that provide a unique integrated proposition in the automotive supply value chain. Gaining BMW UK as a flagship customer for the proposition appears to verify the strategy. BCA’s long history of innovative investment that has allowed it to develop market-leading platforms and an excellent reputation that supports over 1,000 vendor relationships and 14,000 active buyers in the UK alone, creating a significant barrier to entry. The integration of services offered in vehicle markets creates synergistic opportunities that can be exploited to further enhance shareholder value. In addition, digitally connected electronic and physical customer interfaces provide an agile platform to respond to changing vehicle markets. Exclusive access to proprietary historical and real-time used vehicle transaction data provides a significant competitive advantage, as well as a tool for customer application development through sizeable, dedicated software engineering resources.
Financials: Organic and M&A opportunities
Growth in vehicle parcs and supply of used vehicles support organic transaction growth, which is generally less volatile than new vehicle markets, both in terms of volume and margin. The agency fee nature of the core remarketing activities also serves to de-risk vehicle margin as exposure to residual value risk is low. Focus is on EBITDA per transaction in the remarketing operations as accounting for outsourced remarketing contracts has inflated sales and depressed margins in the UK. Adding digital, financial and physical services to vendors to provide greater transparency and experience drive the added value for each vehicle transaction. Strong organic potential is provided by WBAC as the third channel for vehicle disposal in the UK, increasingly taking share from trade-in/part-exchange and C2C platforms. WBAC also sells its purchased vehicles using BCA auctions. The potential to expand across Europe provides a further route to growth. The investment strategy is supported by the highly cash-generative nature of the model. With net organic investment set to normalise to around £35m, capital allocation is likely to focus on M&A and shareholder returns. The dividend payout ratio of 75% in FY18 provides a supportive yield. In FY18, BCA grew sales by 20% to £2.43bn and EBITDA by 18% to £159.5m, a margin of 6.6% (FY17 6.7%). We forecast FY19 revenue growth of 10% with maintained EBITDA margins, generating EPS growth in excess of 8%.
Valuation: Apax approach has focused the market
We have used the straight average of our capped DCF methodology and peer group comparison to derive our fair value estimate of 252p. BCA represents a unique proposition in vehicle markets, distinct from automotive retailers. For the peer group we have used international auction companies, online auction companies, online auto retailers and UK business services providers.
Company description: Driving growth
BCA Marketplace is the owner and operator of Europe’s largest used vehicle exchange through both physical and online auctions. The company has expanded its exchange services across 10 countries in Europe (including the UK), operates from 51 sites and sold 1.38m vehicles in FY18. In addition, since the acquisition of We Buy Any Car (WBAC) on 16 August 2013, it is also the UK’s market-leading, online-based provider of used vehicle buying services. It has added services across the vehicle supply chain and today encompasses a through-cycle vehicle support offering, from new and used vehicle preparation, logistics, used vehicle buying, to refurbishment and remarketing. As part of this strategic development, it has built the UK’s largest car transporter fleet.
Company history
BCA can trace its history back to 1946, with the first auction under the Southern Counties Car Auctions brand, which was subsequently developed into British Car Auctions. The original BCA was listed on the LSE until its takeover in 1987 by ADT, a UK-based security group. It subsequently passed through the ownership of several private equity groups.
It was the Haversham Holdings listing on AIM in 2014 and subsequent takeover of BCA Group from private equity house Clayton Dubilier & Rice in April 2015 that created the BCA Marketplace that is recognisable today. A placing of 685m Haversham Holdings shares at 150p, raising £1.0bn of net proceeds, the issue of consideration shares, admission to the standard listing of the London Stock Exchange and renaming the company BCA Marketplace were all completed successfully in April 2015. It has continued to develop from a traditional, physical auction house into the multi-channel, technology-rich, used vehicle marketplace with integrated support services that exists today.
The proceeds of the float allowed management to refinance the company and to pursue the growth strategy through increased investment in facilities, existing platforms and new IT initiatives. It also facilitates focused acquisitions to develop the range of activities available to customers. The group facilitated the remarketing of over 1.38 million vehicles last year, including 231k used cars purchased through the vehicle buying operations.
Company structure
BCA Marketplace is the holding company for the groups’ activities, which are organised into four operating divisions: UK Vehicle Remarketing, International Vehicle Remarketing, Vehicle Buying and Automotive Services. Each division has its own operational board. The current structure of the group is shown in Exhibit 1 below.
|
Exhibit 1: FY18 group EBITDA by segment |
|
|
Source: Company reports |
Exhibit 2 demonstrates clearly how the group has evolved.
|
Exhibit 2: Continuing trading volume and profit* growth (FY05-18) |
|
|
Source: Company reports. Note: *Divisional EBITDA before central costs. |
Strategy
BCA’s long-term strategic aim is to create an integrated service offering across the lifecycle of vehicles through the addition of services and the application of technology-based tools leveraging significant proprietary intelligence and data capture. These are applied to help its customer base, primarily made up of new and used car retailers; dealers, leasing companies, OEMS and their captive finance arms optimise profit and cash generation from their inventory flows. BCA will continue to invest both organically and in tactical acquisitions around the core exchange activity to deliver this ambition, while driving efficiencies and synergies.
|
Exhibit 3: BCA Marketplace presence in the vehicle life cycle |
|
|
Source: Company reports |
Since being acquired, BCA has actively pursued the M&A element of its strategy and has made five acquisitions, four of which have helped to form the Automotive Services division of the group.
Exhibit 4: BCA Marketplace acquisitions since April 2015
Date |
Company |
Price |
Division |
Comment |
1 June 2015 |
SMA |
£43m |
UK Vehicle Remarketing |
Auction services in Edinburgh, Kinross, Leeds and Birmingham |
25 Aug 2015 |
Stobart Automotive |
£16m |
Automotive Services |
Vehicle transport fleet of 450 transporters across network of sites |
04 Feb 2016 |
Ambrosetti |
£13m |
Automotive Services |
Vehicle defleet, refurb, logistics & storage in Chipping Warden, Rochester & Sandwich |
18 Jul 2016 |
Paragon |
£135m |
Automotive Services |
Vehicle services, processing, refurbishment and storage |
31 Mar 2017 |
Supreme Wheels |
£1.6m |
Automotive Services |
75% stake in alloy wheel servicing business, HQ in Milton Keynes |
Source: Company reports
In the near term the group will continue to enhance its operation and provide integrated solutions in the UK and Europe by leveraging its operational capabilities, physical and intellectual property, knowledge and automotive industry relationships. It will also seek to expand its geographic presence in Europe and to respond to the changing requirements of the automotive market by adapting services and solutions to meet customers’ large-scale requirements across the supply chain. BCA has short-term strategic objectives for its four divisions that are designed to deliver the long-term ambition of creating value for shareholders.
Exhibit 5: Short-term divisional strategic objectives
UK Vehicle Remarketing |
International Vehicle Remarketing |
Vehicle Buying |
Automotive Services |
Continue to win volume through strong customer relationships |
Grow volume through increasing market awareness |
Grow volume by promoting the third disposal channel |
Integrate further to achieve a single more efficient operating model |
Secure volume for the long term and grow to full scale |
Standardise processes and tools and employ best practice |
Continue to broaden the appeal of the WBAC brand |
Expand suite of value-added services |
Grow BCA Partner Finance |
Build one market across Europe |
Provide vehicle mix and volume to the Exchange |
Co-ordinate movements efficiently between divisions |
Enhance BCA product suite |
Deliver a consistent buyer experience |
Seed new sites and sale days in Europe |
Package solutions for customers across all group divisions |
Expand digital information flow |
Expand service offering |
Continue to improve customer service |
Refurbish and upgrade owned vehicles for onward sale |
Increase efficiency through use of technology at auction branches |
Broaden customer base of BCA Market Price |
||
Expand outsource solutions |
Source: Company reports
In the medium term, the group is looking to build on the strengths of its national reach, the rapidly growing vehicle buying activity, and strong industry relationships with dealers and manufacturers to develop its integrated service offering in both the UK and continental Europe.
In the long term BCA will continue to seek large-scale opportunities in activities that are, or become non-core for car makers, vehicle sellers and owners as the industry evolves. The group’s ability to formulate integrated solutions is unique given the infrastructure, footprint, capabilities and offering.
|
Exhibit 6: Overview of BCA’s unique integrated services offering for the UK |
|
|
Source: Company reports |
Flagship BMW UK contract verifies strategy and scale
On 27 June 2018 it was announced that BMW (UK) and BCA Marketplace had agreed a five-year Auto Services Solutions contract, to provide solutions “from dock to defleet and beyond”. The deal encompasses all of BMW (UK)’s requirements, including 90% of the volume of its specialist leasing business, Alphabet. The exclusive agreement has a minimum five year term and will see BCA provide solutions across its entire range of supply chain activities incorporating defleet, refurbishment, inspection and collection, inventory management and both physical and digital remarketing for the car manufacturers UK activities. As a result BCA will gain market share, supporting revenue growth across its UK activities.
The deal is the largest ever announced by BCA Marketplace and the single biggest remarketing contract BCA has signed in its history. It serves to verify the group strategy of providing an integrated offering to its major automotive industry customers, with BCA uniquely positioned to provide the geographic reach and range of services to execute such a contract. It significantly extends the existing relationship between the companies as BCA already performs the bulk vehicle transportation contract for BMW UK, as well as partial involvement in other activities such as remarketing.
It provides a reference for BCA as it seeks to offer similar innovative, cost efficient solution to service the used car needs of other car producers in the UK.
Key components of the agreements are
■
A five year exclusive agreement to defleet, refurbish, inventory manage and remarket both physically and digitally vehicles on behalf of BMW UK including 90% volume for Alphabet.
■
An exclusive five-year deal for BCA Fleet Solutions to act as the de-fleet and refurbishment partner. BCA will build a new dedicated BMW defleet centre that will handle all its storage and refurbishment needs.
■
A seven-year deal for BCA Logistics to serve as Inspect & Collect provider to BMW and Alphabet.
Market structure
BCA’s core exchange platform and associated activities are based in the used car markets in the UK and Europe. The UK activities are based around physical auction sites, with a substantial digital infrastructure investment facilitating and augmenting them. The European auction activity is more electronically based, with two-thirds of international sales being made online, almost twice the penetration of online auction activity in the UK.
BCA is not involved in the sale of new cars and light commercial vehicles (LCVs), although it does supply services such as transportation and inspection to the segment. However, there are clearly some trends that flow from new car markets to used vehicle supply such as part-exchange, lease contract expirations and personal contract plans (PCPs). In fact, BCA provides a unique “dock to de-fleet” through-cycle support proposition in the UK vehicle market.
UK light vehicle markets remain close to record levels
The UK used car and LCV markets reflect trading in the UK vehicle car parc, which has seen renewed growth in recent years following the strength of new market sales. There have been record or historically high levels of new car market registrations for each of the last seven years. Despite a 5.7% decline to 2.54m registrations in 2017 from a record level of 2.69m registrations in 2016, this was still an historically high level of sales. While a further modest decline to around 2.46m sales is expected in 2018, this again represents a healthy demand.
As many of these purchases have been made using PCP finance, which has been steadily increasing its penetration of the new car market, it means that there are a growing number of two-to three-year-old vehicles becoming available for resale. In turn, these create a second market as replaced older vehicles are sold or traded in as part-exchange vehicles by the second buyers of the newer vehicles involved.
|
Exhibit 7: UK used car transactions since 2001 |
Exhibit 8: UK car parc development since 2001 (units) and vehicle turn (RHS %) |
|
|
|
Source: SMMT |
Source: SMMT |
|
Exhibit 7: UK used car transactions since 2001 |
|
|
Source: SMMT |
|
Exhibit 8: UK car parc development since 2001 (units) and vehicle turn (RHS %) |
|
|
Source: SMMT |
According to Society of Motor Manufacturers and Traders (SMMT) data, used car transactions totalled 8.1m in 2017, the second highest on record after the record of 8.2m in 2016, and have fallen by around 5% in both Q417 and Q118, whereas BCA grew volumes by 6% in the equivalent period. Q118 still remained above 2m transactions and represented the third highest first quarter level ever. These compared to a decline in new car registrations in 2017 of 6.6% and 12.4% for Q118 compared to record registrations in Q117. Despite some market distortion last year, especially new higher Vehicle Excise Duty (VED) rates introduced from 1 April 2017, we believe these figures demonstrate that used car sales are influenced by, but are less volatile than, new car sales. Van markets have been following similar trends. FY17 new registrations were down modestly following record new sales in FY15 and FY16 and latest data show a rolling 12-month run rate of 367,000 van sales.
Overall vehicle parc (vehicles in use) growth also provides an increasing base for used vehicle transactions. The rate of new vehicle transactions as a proportion of the vehicle parc is known as the vehicle turn and this varies from market to market, with the UK being a relatively high-turn market and Europe generally being lower. The higher turn in the UK is attributable to a number of factors including the increasing use of two- to three-year long PCPs that have progressively penetrated the financing of new and used car transactions over the last decade, which has led to shorter average initial and secondary ownership periods. In addition, there tend to be fewer used car dealers with a higher proportion of consumer-to-consumer (C2C) transactions. We estimate used car turn in the UK to be around 23% currently compared to a relatively stable 14% in Europe.
UK vehicle parc & transactions expected to increase modestly
The UK vehicle parc currently stands at around 40m vehicles including heavy trucks and buses. The car parc is 34.7m units and the total for vans and other LCVs is around 4.3m units. Both have been growing at low single-digit rates of 1–2% pa in recent years, reflecting high levels of new vehicle sales and increased affordability due to economic growth, and low cost finance options.
The influence of increasing PCP penetration in both the used and new car markets has also served to increase the velocity of the used car market. In 2017, 88% of new private car purchases were made using finance, up from 59% in 2008, and PCP plans now account for 66% of the value of all new and used vehicle financing compared to 34% in 2008. In terms of volumes, for vehicles bought using finance, PCP penetration is close to 90% for new car transactions and 50% for used vehicles. The average PCP duration is around 2.5 years compared to a direct ownership normal period of around 4.5 years. As the number of vehicles in the parc with PCP plans attached rises, it increases the volume of cars available for remarketing even in relatively flat overall markets.
|
Exhibit 9: Number of vehicles per 1,000 inhabitants for European markets where BCA operates today |
|
|
Source: Eurostat |
European markets growing more strongly
In contrast to the UK, where Brexit uncertainty and other factors continue to undermine consumer and business confidence, and thus new car sales, European new car sales are currently growing strongly in 2018. According to the European Automobile Manufacturers Association (ACEA), year to date registrations for the EU member states excluding the UK are up 4.3% through May, due to improved economic performance. In Europe, the overall vehicle turn is generally lower than in the UK, with lower penetration of PCPs and longer vehicle ownership. For example, in Germany, BCA’s largest international market, used car sales fell by c 1.4% in 2017 to 7.3m (2016: 7.4m) and, with a German car parc of 46.5m vehicles, this implies a vehicle turn of just 15%.
|
Exhibit 10: Vehicle parc development for European markets in which BCA operates |
|
|
Source: OICA |
The car parc for the 28 members of the EU is around 265m vehicles, with a penetration rate of 505 cars per 1,000 inhabitants as shown in Exhibit 9, and an average age of c 11 years. In the nine European markets in which BCA operates, which represent of around 70% of all vehicles in use in the EU, car parc growth averaged 0.7% compound over the 10 years from 2005 to 2015 (176m cars). Excluding the UK and Germany, this rises to 0.9%, given the effective stagnation of the German car parc over the 10-year period. Encouragingly, more recent German data from the DKF (Deutsches Kraftfahrzeuggewerbe, the trade association of the German motor industry) indicate that car ownership has returned to close to peak levels. The German car parc has grown by around 1.5% per annum in each of the last two years to 46.5m, reflecting improved economic conditions.
The positioning of exchanges in used vehicle market flows
|
Exhibit 11: Positioning of exchanges in used vehicle market flow |
|
|
Source: Company reports |
Used cars move from sellers, both private and corporate, to new ownership, either directly to new owners, through dealers (including direct, dealer to dealer) or through vehicle buying operations such as BCA’s WBAC. As dealerships tend to cherry-pick used stock for their own used car portfolios, a large number of incoming vehicles require a platform to be transferred through to new ownership, primarily used car dealers including car supermarkets. In addition, vehicle buying operations require a disposal channel for increasing volumes of vehicles that the easy-to-access and consumer-based online business model is generating.
BCA is the clear leader in its markets in the UK and Europe
BCA is by far the largest vehicle exchange in the UK with a c 60% market share, selling more than 1m vehicles in FY18, equivalent to around 12.5% of annual used vehicles transactions. It is approximately 2.5x the size of its nearest competitor, the UK subsidiary of Manheim, which has a share of around 25%. In addition, BCA has national coverage in the UK, whereas many competitors are more regionally based. The National Association of Motor Auctions (NAMA) has c 25 other members, which share the remainder of the market.
However, from its US base, Manheim operates auctions around the world, including across Europe. It is a subsidiary of Cox Automotive, which is a division of Cox Enterprises, a private corporation based in Atlanta in the US. BCA operates in more countries in Europe, has more locations and greater exchange volumes than Mannheim.
Divisional overview
BCA operates through four divisions, with global vehicle remarketing activities accounting for 44% of group sales in FY18, each of which we consider below.
UK Vehicle Remarketing (57% of group EBITDA)
Operating across 23 auction centres at 21 sites across the UK, BCA’s Exchange is active in selling vehicles for a broad range of vendors. The exchanges provide transparency, certainty of transaction, speed and liquidity to its customers, both buyers and vendors.
|
Exhibit 12: UK Vehicle Remarketing sites |
|
|
Source: Company reports |
Essentially, the auction process involves:
■
Vendors: auto manufacturers (OEMs); leasing companies; auto dealers; fleet managers; vehicle buying companies
■
Buyers: car supermarkets; franchise dealers; independent dealers; traders; public.
The company has added to the sale process by adding services, including valeting and assurance testing.
This division illustrates BCA’s concept of ‘phygital’ as physical and digital combine to make an efficient system. The company needs the physical supply of cars, and later on we will detail how the company achieves this. However, the company has been active in developing digital tools to facilitate information flow and increase efficiency. In the UK, c 30% vehicle sales are online, and there is clear upside from increased penetration. However, BCA is also well-positioned to leverage the data to which it has access with regard to the significant volume of vehicles it trades. There are currently three key digital applications:
■
BCA Dealer Pro: This is an appraisal application that aims to add intelligence to the part-exchange process for dealers. By its very nature, the application is structured and brings consistency across a salesforce. However, the key benefit is allowing a dealership to manage a profitable vehicle disposal programme.
■
BCA Imagery: This application is focused on video capturing the vehicle in walkaround mode, demonstrating the vehicle condition, plus discrete images.
■
Auction View / Live online: applications for remote, online, real-time participation in auctions.
The vehicle remarketing model is based on agency fees and service charges being applied to both buyers and sellers on car transactions. Generally, it does not take title to the vehicles. While the fees relate to the value of the transaction, the nature of fee per vehicle is relatively fixed given that the average value of vehicles sold is not volatile in normal macroeconomic conditions. A suite of digital and physical added-value services generate additional revenues per vehicle, both pre- and post-auction. These include inspection, logistics, appraisal, repair, valeting, and finance services.
From a vendor perspective, the relationship is strengthened by the rate of first-time conversion of disposals, where BCA can benefit from its prodigious database of vehicle pricing. While dealers tend to operate books on disposal portfolios to achieve desired profitability and negotiate disposal of cars that do not meet reserve prices, it is preferable for the vehicles to pass seamlessly through the auction process, which involves a combination of online bidders in addition to buyers in the auction hall. Vendor satisfaction stimulates exchange use for their large inventories of used vehicles, as opposed to other disposal routes. In turn, this results in buyers enjoying a broader choice and range of vehicles from which to purchase in the knowledge that market forces are being applied.
Exhibit 13: UK Vehicle remarketing key data
2016 |
2017 |
2018 |
|
Vehicles sold |
888,000 |
956,000 |
1,018,000 |
Revenue per vehicle (£) |
273 |
788 |
925 |
Revenue (£m) |
242.3 |
753.8 |
941.4 |
Adjusted EBITDA (£m) |
69.1 |
84.0 |
96.8 |
Adjusted EBITDA margin |
28.5% |
11.1% |
10.5% |
Adjusted EBITDA per vehicle (£) |
78 |
88 |
97.0 |
Source: Company reports
While in recent periods accounting for outsourced, third-party vehicle remarketing contracts has inflated revenue per vehicle figures in the UK as BCA can take temporary title to the vehicles, from a profit per vehicle (EBITDA) standpoint development has been a more relevant operational KPI. The growth of the outsourcing of vehicle remarketing operations from third parties thus tends to result in significant, one-time step-ups in revenues.
Exhibit 14: BCA Partner Finance development
FY16 |
H117 |
FY17 |
H118 |
FY18 |
FY17 vs |
FY18 vs |
|
Number of live dealers |
1,002 |
1,192 |
1,351 |
1,172 |
1,149 |
34.8% |
-15% |
Live credit lines (£m) |
103 |
121 |
160 |
182 |
215 |
55.3% |
34.4% |
Utilisation |
62% |
66% |
71% |
68% |
71% |
||
Actual loan book (£m) |
64.7 |
79.4 |
113.4 |
123.7 |
148.4 |
75.3% |
30.9% |
Facility drawdown (£m) |
40.2 |
61.7 |
69.0 |
74.4 |
105.5 |
71.6% |
52.9% |
BCA penetration |
7.0% |
7.9% |
11.3% |
11.3% |
12.6% |
61.4% |
11.5% |
Source: Company reports
In addition, BCA Partner Finance, a short-term buyer financing facility, is offered to selected dealers to stimulate increased demand from independent selected buyers by increasing liquidity. The loan book and penetration rates of Partner Finance have been growing, but it should be noted that the 15% decline in live dealers in FY18 reflects closure of inactive accounts. The growth has led BCA to increase the size of its banking facility for the product with penetration increasing to 12.6% in FY18 (H118: 11.3%, FY17: 11.3%) of vehicles purchased through BCA auctions in the UK. As the loan book is asset backed by the vehicles purchased and default rates are low, and dealers need to maintain reputational standing, the risk is relatively limited. It should be noted that BCA can choose to deploy its own cash to provide financing as well as drawing down on the facility, which results in a differential between the loan book and the drawdown. At the end of FY18 £105.5m was drawn down of the £200m asset-backed facilities, and the loan book stood at £148.4m suggesting to us that some £40m of cash would be available to BCA if the book were liquidated.
International Vehicle Remarketing (17% of group EBITDA)
|
Exhibit 15: UK and International vehicle remarketing volumes |
|
|
Source: Company reports |
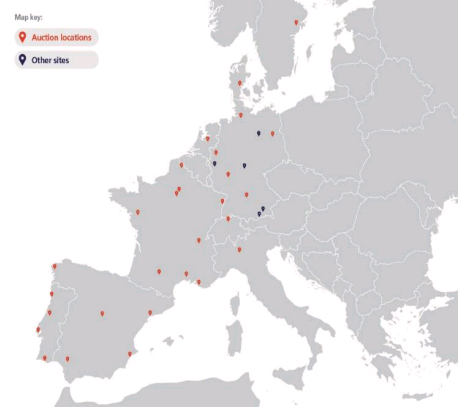
While a much smaller contributor to the overall group, this division emulates some of the success seen in the UK operation with over 28 centres in 9 countries in Europe. In contrast to the UK, c 70% of international sales are online.
Exhibit 16: International Vehicle Remarketing key data
2016 |
2017 |
2018 |
|
Vehicles sold |
333,000 |
347,000 |
362,000 |
Revenue per vehicle (£) |
329 |
390 |
426 |
Revenue (£m) |
109.5 |
135.4 |
154.3 |
Adjusted EBITDA (£m) |
18.9 |
26.2 |
30.1 |
Adjusted EBITDA margin |
17.3% |
19.4% |
19.5% |
Adjusted EBITDA per vehicle (£) |
57 |
76 |
83.0 |
Source: Company reports
The division is operating in markets where the penetration of exchange platforms is much less well developed, with penetration rates of auctions of used car transactions running at only around 5% compared to near 20% in the UK. The division continues to raise awareness among dealers of auctions as both a source of vehicles and a route for selling surplus inventory. The success of introducing software solutions such as BCA Dealer Pro and BCA Market Price on a market-by-market basis is also helping to strengthen customer relationships, with the number of dealers using Market Price rising from 1,800 in FY17 to 2,200 in FY18, performing 1.2m valuations (FY17: 1.1m).
BCA is working hard to standardise the buyer experience and processes across its European network as the number of cross border exports increases. The programme known as One Europe has also seen a strengthening of the management team. A new European transport brokerage to source and manage the efficient movement of vehicles has also been established in FY18. A new IT system is operating in Denmark and Sweden, and is currently being rolled out in Spain.
All of the initiatives are at a relatively early stage of adoption, with further technology solutions yet to be transferred into all markets as volumes grow. The results of the division are susceptible to the impact of FX fluctuations on translation of its results from euros into sterling. In terms of FX sensitivity, a 1% change in €/£ moves EBITDA by c £0.3m.
|
Exhibit 17: International Vehicle Remarketing sites |
|
|
Source: Company reports |
Vehicle Buying (13% of group EBITDA)
WBAC started trading in 2006 and purchased its one millionth car in FY17. Today WBAC is the UK’s leading vehicle buying service, with a c 80% market share, and is one of the UK’s most recognisable brands.
All of vehicles bought are remarketed exclusively through BCA Exchange. WBAC operates from over 200 locations in the UK. As we mentioned earlier, BCA is able to leverage the vehicle pricing information from WBAC and its auction activity to provide intelligent pricing. For the vendor, any valuation is valid for seven days and, with a widespread branch network, the deal can be completed rapidly.
|
Exhibit 18: We Buy Any Car vehicle volumes (2011-18) |
|
|
Source: Company reports |
Overall, the UK Vehicle Buying operation complements the supply chain for the auction operations, providing the physical element in a phygital strategy. With 100% of its purchased vehicles sold through the remarketing operation, WBAC currently accounts for just over 20% of BCA’s total UK auction volume per annum.
The UK Vehicle Buying model is designed to achieve a targeted but relatively low level of margin, currently at the top end of the target range of 2.0% to 2.5% at the EBITDA level, providing a competitive stimulus to add to the simplicity of sale for private car sellers.
Exhibit 19: UK Vehicle Buying key data
UK |
2016 |
2017 |
2018 |
Vehicles sold |
172,000 |
194,000 |
219,000 |
Revenue per vehicle |
4,003 |
4,114 |
4,202 |
Revenue (£m) |
688.6 |
798.1 |
920.3 |
Adjusted EBITDA (£m) |
16.9 |
19.5 |
23.0 |
Adjusted EBITDA margin |
2.5% |
2.4% |
2.5% |
Adjusted EBITDA per vehicle (£) |
98 |
101 |
105 |
D&A (£m) |
-7.0 |
-7.3 |
-7.2 |
Operating profit (£m) |
9.9 |
12.2 |
15.9 |
Source: Company reports
In Europe, the group trades under the CarTrade2B brand. The trial started in Germany and similar trials have been initiated in Spain, Sweden and the Netherlands. Whereas in the UK WBAC has become an established third path for selling vehicles, in Europe the model focuses more on corporate entities disposing of batches of vehicles. These in turn are remarketed through the International Vehicle Remarketing division detailed above and the vehicle is run to break-even. Revenues in FY18 were £45m, having risen from £10m in FY16, which has clearly provided beneficial volume for the international remarketing operation.
Automotive Services (13% of group EBITDA)
This division operates in four key areas:
■
New vehicle services – reception and handling of vehicles at port of entry; inspection and vehicle preparation; storage where required, warranty and servicing; and customisation where required.
■
BCA Fleet Solutions – vehicle fleet management; fleet reporting; refurbishment; and de-fleeting.
■
BCA Automotive – varied transport requirements including transport to and from auction sites.
■
BCA Logistics – allows for single vehicle movements in support of exchange transactions.
BCA operates the UK’s largest transporter fleet with over 800 trucks, and is bigger than the next three largest competitors combined. The fleet provides services at all stages of the vehicle lifecycle. Upfront, the business has relationships with 15 out of the top 18 OEMs operating in the UK by volume. The scale of the business keeps the operation cost effective and is backed up by digital platforms to manage and track a vehicle’s location and status.
BCA management recognised the value in addressing all stages of the vehicle lifecycle, and hence this division has been bolstered and developed through acquisition.
■
Stobart Automotive: acquired in August 2015 and renamed BCA Automotive, this business is a leading provider of transport services. At the time of acquisition, this business operated c 450 vehicle transporters.
■
Ambrosetti: acquired in February 2016, this business focuses on vehicle de-fleet, refurbishment, logistics and storage. At the time of acquisition, this business covered a 100 acre footprint with capacity to handle c 100,000 vehicles per year.
■
Paragon Automotive: acquired in July 2016 for £135m, this business focuses on storage, processing and refurbishment. At the time of acquisition, this business employed 1,250 staff and had capacity to process c 600,000 vehicles per year.
■
BCA Logistics: previously in UK Vehicle Remarketing.
■
Supreme Wheels Direct: acquired in March 2017, this business is a specialist in alloy wheel refurbishment, bringing back used wheels to an “as new” standard. The company dates back to 2010 and since that date has invested heavily in R&D and facilities to provide a best-in-class service, handling around 200 wheels per day. This includes collection, process and returned wheels in a rapid turnaround time.
Exhibit 20: Automotive Services division key data
UK |
2016 |
2017 |
2018 |
Revenue (£m) |
102.9 |
303.5 |
355.3 |
Adjusted EBITDA |
4.2 |
17.2 |
21.5 |
Adjusted EBITDA margin |
4.1% |
5.7% |
6.1% |
D&A |
(2.9) |
(9.8) |
(13.5) |
Operating profit |
1.3 |
7.4 |
8.0 |
Source: Company reports
Management
BCA’s management team is driving change and integrating acquisitions in pursuit of its growth strategy. Executive chairman Avril Palmer-Baunack formed Haversham Holdings with Marwyn Asset Management in 2014 as a vehicle to create value for its investors through a strategy of acquisition and development of target companies. Following its listing and the acquisition of BCA Group in 2015, Haversham was renamed BCA Marketplace. Avril had previously been a board member at Stobart Group, where she held the role of executive chairman and deputy CEO. Before this, she was CEO of Autologic Holdings. In essence, with over two decades of executive experience, Avril is exceedingly well placed to understand the dynamics and opportunities in the industry. She is currently also non-executive chairman of both Redde and Safe Harbour Holdings. Chief financial officer Tim Lampert joined the board in 2015 from Autologic Holdings, has a strong background in the industry and was instrumental in the acquisition of the BCA Group. The board is strengthened by the wide-reaching skills base of the non-executive directors.
The company is cognisant of its variation from best-practice corporate governance, but appears to be addressing requirements progressively. In addition to the two executives and following the resignation of the two non-independent, non-executive directors in December 2017, balance and oversight is provided by the four independent non-executive directors.
Sensitivities
■
Brexit: while negotiations remain ongoing, the impact on the business remains uncertain. There is limited cross-border risk between the UK and International markets. However, a change in border controls may impact on the complexity or volume logistics services that BCA provides, which could be positive or negative depending on the deal.
■
M&A: acquisitions are core to BCA’s strategy and the ability of management to identify and integrate acquisitions is important.
■
Macroeconomic: the automotive industry is typically affected by employment and consumer confidence trends, with credit availability a key influence on vehicle purchasing. While closely monitoring vehicle registration data, BCA's direct exposure to the retail consumer is limited in its remarketing operation. In addition, we believe that BCA's widespread exposure across the vehicle lifecycle provides multiple levers with which to manage pricing and volume trends, as evidenced by performance during the 2009/2010 financial crisis (see Exhibit 2).
■
Competition for WBAC: the barriers to entry may appear to be low, as auto dealers increasingly indicate that they will match WBAC offers in their part-exchange transactions. However, this action in itself advertises WBAC. The growth of the platform has been considerable since its foundation in 2006 and purchasing its one millionth car in 2016. Bringing scale and a significant amount of trade data, in addition to the exchange data, WBAC is able to make more informed transactions.
■
UK dominance in remarketing: with 85% market share split between BCA and Manheim, it appears that the UK auction market is saturated, with limited upside from further acquisition. While BCA is the only operator in the UK to offer national coverage, it is also expanding its reach across Europe. Hence future M&A is likely to be focused on International Remarketing and Automotive Services.
■
Corporate governance: the UK Corporate Governance Code recommends that the roles of chairman and chief executive should not be exercised by the same individual. However, the board considers that the proven expertise of Avril Palmer-Baunack permits the combined roles of chairman and chief executive as the right approach at this stage of the group’s development.
Valuation
Although BCA has a limited track record in its current guise, it has a long history of financial performance and has reportedly changed hands under private equity ownership at increasing values since its acquisition by ADT in 1987. The development of BCA has accelerated following the acquisition in 2015, addressing multiple points along the vehicle lifecycle. A key example here is the formation of the Automotive Services operation, largely through acquisition, adding a new value-creating stream to add to the core exchange platform, alongside the impressive market position and growth of the WBAC online purchasing platform.
We use an average of a capped DCF (237p) and our remarketing peer group comparison (266p) to derive our fair value, which currently stands at 252p.
Capped DCF valuation
We have calculated a capped DCF valuation for BCA Marketplace using modelled assumptions for six years and adding a terminal value that assumes zero growth. We thus normalise capex to depreciation and set working capital to zero in the terminal value to reflect that. We use a calculated WACC of 7.2%. We believe this is inherently conservative for growth stocks as the terminal value is constrained. We regard BCA as a growth stock, as used car transactions increase with the car parc and added value from incremental services compounds the revenue growth, providing leverage over a largely fixed cost base. The capped DCF currently returns a value of 237p per share
Exhibit 21 shows a sensitivity analysis for changes in the WACC and terminal growth rates assumed. The value of 246p is highlighted as it closest to our calculated WACC of 7.2%.
Exhibit 21: BCA Marketplace DCF sensitive analysis
WACC |
6.0% |
6.5% |
7.0% |
7.5% |
8.0% |
8.5% |
9.0% |
9.5% |
10.0% |
|
Terminal value |
0% |
294 |
268 |
246 |
227 |
210 |
196 |
183 |
171 |
160 |
1% |
346 |
311 |
282 |
257 |
236 |
218 |
202 |
187 |
175 |
|
2% |
424 |
372 |
331 |
298 |
270 |
246 |
226 |
208 |
193 |
|
3% |
553 |
469 |
405 |
356 |
317 |
285 |
258 |
236 |
216 |
|
Source: Edison Investment Research estimates
Peer group comparison
We use a peer group of online technology platforms, car auction companies in the US and Japan, online vehicle retailers and some other trading platform activities.
Exhibit 22: BCA Marketplace peer group comparison
Year end |
Market cap (local ccy) |
Share price (local ccy) |
FX |
P/E |
EV/EBITDA |
Dividend yield |
EV/Sales |
|||||
(bn) |
FY1 |
FY2 |
FY1 |
FY2 |
FY1 |
FY2 |
FY1 |
FY2 |
||||
UK auto retailers |
||||||||||||
Inchcape |
12/17 |
3.27 |
789 |
GBP |
12.1x |
11.7x |
7.6x |
7.3x |
3.4% |
3.5% |
0.4x |
0.4x |
Lookers |
12/17 |
0.41 |
105 |
GBP |
7.8x |
7.3x |
5.1x |
4.7x |
3.8% |
4.0% |
0.1x |
0.1x |
Marshall Motor Holdings |
12/17 |
0.12 |
160 |
GBP |
6.7x |
6.5x |
3.2x |
3.1x |
4.3% |
4.3% |
0.1x |
0.1x |
UK auto retailers average |
|
|
|
|
8.9x |
8.5x |
5.3x |
5.0x |
3.8% |
3.9% |
0.2x |
0.2x |
Remarketing peers |
|
|
|
|
|
|
|
|
|
|
|
|
Aucnet Inc |
12/17 |
46.88 |
1,704 |
JPY |
19.8x |
17.9x |
0.0x |
0.0x |
1.5% |
1.8% |
1.4x |
1.3x |
Auto Trader Group |
03/18 |
4.06 |
428 |
GBP |
21.9x |
19.6x |
18.0x |
16.7x |
1.5% |
1.7% |
12.6x |
11.9x |
Copart Inc |
07/17 |
13.61 |
59 |
USD |
32.7x |
27.1x |
20.3x |
18.1x |
0.0% |
0.0% |
7.7x |
7.1x |
Dena Co |
03/18 |
321.08 |
2,129 |
JPY |
20.3x |
18.3x |
6.9x |
5.9x |
1.2% |
1.2% |
1.6x |
1.5x |
KAR Auction Services Inc |
12/17 |
7.93 |
59 |
USD |
19.6x |
17.9x |
11.3x |
10.5x |
2.4% |
2.4% |
2.8x |
2.6x |
USS Co |
03/18 |
655.32 |
2,092 |
JPY |
21.0x |
20.3x |
14.6x |
14.2x |
2.4% |
2.4% |
7.7x |
7.6x |
Remarketing peers average |
|
|
|
|
22.6x |
20.2x |
14.2x |
13.1x |
1.6% |
1.6% |
5.6x |
5.3x |
Other peers |
|
|
|
|
|
|
|
|
|
|
|
|
AutoNation Inc |
12/17 |
4.21 |
46 |
USD |
9.7x |
9.3x |
10.7x |
10.8x |
0.0% |
0.0% |
0.5x |
0.5x |
CarMax Inc |
02/18 |
13.39 |
76 |
USD |
16.4x |
15.1x |
19.5x |
18.5x |
0.0% |
0.0% |
1.4x |
1.3x |
EBAY Inc |
12/17 |
34.11 |
34 |
USD |
15.0x |
13.4x |
9.6x |
9.1x |
0.0% |
0.0% |
3.2x |
3.0x |
Nextage Co |
11/17 |
61.46 |
887 |
JPY |
21.0x |
14.1x |
12.7x |
9.7x |
0.3% |
0.4% |
0.5x |
0.4x |
Penske Automotive Group Inc |
12/17 |
4,348 |
51 |
USD |
9.9x |
9.5x |
13.6x |
13.3x |
2.7% |
2.9% |
0.5x |
0.4x |
Schibsted ASA-Class A |
12/17 |
65.53 |
286 |
NOK |
47.4x |
32.2x |
21.2x |
17.2x |
0.6% |
0.8% |
3.8x |
3.5x |
Other peers average |
|
|
|
|
19.9x |
15.6x |
14.6x |
13.1x |
0.7% |
0.7% |
1.6x |
1.5x |
BCA Marketplace |
03/18 |
1.87 |
235 |
GBP |
19.7x |
17.5x |
12.8x |
11.8x |
4.3% |
4.3% |
0.8x |
0.8x |
Source: Bloomberg, data as at close 25 July 2018
The temptation is to include traditional automotive retailers in the peer group, but these are treated as highly cyclical retail stocks by the market, which we feel is inappropriate for BCA. As BCA is effectively a wholesale operation, it has greater self-determination than OEM-dependent retailers, given the latter are subject to OEM-specified new car sales targets. BCA operates with lower revenue volatility, higher margins and stronger, more stable cash generation characteristics than the retailers. We have included these for transparency.
We believe the remarketing peer group is most relevant and, as Exhibit 22 shows, BCA trades at a modest discount to these. If we put our BCA FY20 estimates on the remarketing peer group average P/E for FY2, the stock would be trading at 266p. Comparison using the other peers that are slightly less focused would suggest a low-end value of 206p.
Financials
Revenues have grown rapidly since 2016, which was a 15-month financial period, although trading numbers were for 12 months due to the timing of the acquisition. The growth was largely driven by two factors. One was the dynamic growth of WBAC as the success of its business model continued to attract customers, offering a simple, convenient and transparent route to disposing of vehicles. The other was an accounting quirk as a result of attracting third-party outsourcing contracts for vehicle remarketing. Essentially, this involves assuming the management of fleets coming off lease. As BCA has to take temporary title of the vehicles involved until their disposal, it has to book the full value of the unit as revenue rather than just the agency and service provision fees until they are sold through the auction or other channels. As the average vehicle costs reflect the residual value of the car at the end of the lease period, these values run to 40% or so of the original vehicle values when new which, according to March 2018 data from BCA, currently average £11,122 per vehicle at auction. Thus, adding disposals from large fleets adds substantial revenues, but with little additional profitability contingent on the margin made on selling on the vehicles. This was the major reason behind the sharp jump in UK Remarketing revenues from £242m in FY16 to £941m in FY18, with a consequential major dilution of EBITDA margins. The outsourcing contracts by nature last for periods of five years or more, so as the volumes start to flow there is a one-time increment to revenues, which is then sustained as volumes rise to reflect normal annual fleet disposals.
This means that EBITDA per vehicle is a more critical measure for tracking development between periods, as it predominantly reflects the charges attached through the auction process on disposal. We expect this to increase by 4% in FY19 and 3% in FY20, with the volumes of vehicles sold rising by 5% and 4% for the respective years.
Exhibit 23: BCA Marketplace divisional analysis and estimates
£m |
2016 |
2017 |
2018 |
2019e |
2020e |
UK Vehicle Remarketing |
242 |
754 |
941 |
1,009 |
1,070 |
International Vehicle Remarketing |
110 |
135 |
154 |
166 |
178 |
Vehicle Buying |
698 |
837 |
981 |
1,108 |
1,252 |
Automotive Services |
103 |
304 |
355 |
380 |
403 |
Group revenues |
1,153 |
2,030 |
2,432 |
2,663 |
2,903 |
UK Vehicle Remarketing |
69 |
84 |
99 |
106 |
112 |
International Vehicle Remarketing |
19 |
26 |
30 |
31 |
34 |
Vehicle Buying |
16 |
20 |
23 |
26 |
29 |
Automotive Services |
4 |
17 |
22 |
24 |
25 |
HQ Other and intersegment |
(10) |
(11) |
(14) |
-16 |
-17 |
Adjusted EBITDA |
99 |
136 |
160 |
171 |
184 |
Non-cash charges |
(34) |
(33) |
(39) |
-40 |
-40 |
Reported EBITDA |
64 |
102 |
121 |
131 |
144 |
UK Vehicle Remarketing |
28.5% |
11.1% |
10.5% |
10.5% |
10.5% |
International Vehicle Remarketing |
17.3% |
19.4% |
19.5% |
19.0% |
19.0% |
Vehicle Buying |
2.3% |
2.3% |
2.5% |
2.4% |
2.4% |
Automotive Services |
4.1% |
5.7% |
6.1% |
6.2% |
6.2% |
Core business adjusted EBITDA margin |
8.5% |
6.7% |
6.6% |
6.4% |
6.3% |
Source: Company reports, Edison Investment Research estimates
For International Vehicle Remarketing, which does not suffer from the outsourcing contract effects, we are estimating 4% volume growth in each of the next two years and 3% revenue per vehicle growth. The increased leverage over the cost base is likely to be offset by additional costs relating to the innovation investments being made.
We expect WBAC to continue to grow dynamically, growing its share of consumer disposals and increasing revenues by around 8% per annum. The margin is likely to continue to be managed to around the current 2.0%-2.5% target range, facilitating competitive pricing offerings to sellers and representing significant inventory flow for the remarketing activity in the UK.
We expect the Automotive Services business is to grow at a healthy rate as transporter fleet expansion combines with increases in its utilisation rate. With new car markets appearing to have stabilised in the last couple of months, we expect service elements across the value chain to see modest growth. Margins are expected to remain relatively stable.
Organic investment levels expected to normalise
On the cash flow front, recent periods have seen significant gross investment to support the growth strategy, although the sale and leaseback of invested properties and the transporter fleet has led to net investment levels trending below underlying capex levels of around £30m–35m.
BCA has been investing organically in the period since listing and gross capex has been running at high levels. In part this has been caused by the transporter fleet renewal and expansion programme, which is normally followed by a sale and leaseback of the vehicles. Activity here is expected to decline in FY19. In addition, several major auction site upgrades and investment programmes have been undertaken since listing at Bedford, Blackbushe in Surrey, Belle Vue in Manchester and Perry Barr in Birmingham. The last two came on line in FY18 and were subject to sale and leaseback transactions as is BCA’s normal practice. Again, with a lower requirement for auction site investment, the property element of gross capex will also decline, although the recently announced BMW contract clearly has some investment requirements. Underlying capex of around £31m in FY18 includes software development cost capitalisation, which is expected to be maintained at around the current level of £11m per annum as both WBAC and BCA software engineering teams continue to develop and upgrade new apps for the online and interface products for the group operations. Guidance for overall underlying capex in FY19 is £32–36m.
Net debt, excluding Partner Finance asset-backed loans, stood at £192m and is expected to drop as free cash flow improves. Partner Finance penetration and absolute levels of asset-backed debt are expected to continue to increase, with BCA investing its own excess cash as well drawing down the available facilities to improve returns. Effectively, we estimate that BCA has around £40m of gross cash invested at the end of FY18, but the facility allows for coverage of 90% of the loan book, and some could be returned to Treasury.
FY18 results
UK Vehicle Remarketing sold 1,018,000 vehicles in FY18 (FY17 956,000), with driving revenue per vehicle up by 17.4% and adjusted EBITDA per vehicle up 10.2%. The company has acquired land for further development, with an ongoing focus on efficiency at existing sites. Meanwhile, the company has introduced branded auctions and part-exchange finance products, which have contributed to an increase in the number of vehicles funded through BCA Partner Finance. BCA penetration has increased to 12.6% (FY17 11.3%) at the year-end with BCA Partner Finance funding £841m (FY17 £577m) of vehicles in the year.
International Vehicle Remarketing sold 362,000 vehicles in FY18 (FY17 347,000), driving revenue per vehicle up by 9.2% and Adjusted EBITDA per vehicle up 14.9%. Vehicles sold for export grew by 23% and now represents 56,000 units, and the company has buyers in 55 countries today. BCA MarketPrice provided 1.2 million valuations in the year, supporting the 2,200 dealer base (FY17 1,800). Regionally, the picture was more mixed, with export strength in Denmark and Sweden and more challenging conditions in Germany and Italy.
Vehicle Buying is going from strength to strength in the UK, with WBAC delivering 12.9% vehicle volume growth and 17.9% adjusted EBITDA growth. This is the sixth consecutive year of double-digit volume growth and reinforces the company’s market leader position in the UK. Internationally, the business remains focused on purchasing vehicles from the OEMs and other corporate entities directly, growing vehicles sold in the year by 71.4%.
Exhibit 24: BCA Marketplace half yearly analysis
March Year End (£m) |
2017 |
2018 |
|||||
H117 |
H217 |
FY17 |
H118 |
H218 |
FY18 |
FY % change |
|
Revenue |
|||||||
UK Vehicle Remarketing |
331.1 |
422.7 |
753.8 |
456.7 |
484.7 |
941.4 |
24.9% |
International Vehicle Remarketing |
62.6 |
72.8 |
135.4 |
72.1 |
82.2 |
154.3 |
14.0% |
UK Vehicle Buying |
387.2 |
410.9 |
798.1 |
444.9 |
475.4 |
920.3 |
15.3% |
International Vehicle Buying |
7.5 |
31.4 |
38.9 |
22.9 |
37.3 |
60.2 |
54.8% |
Automotive Services |
119.4 |
184.1 |
303.5 |
175 |
180.3 |
355.3 |
17.1% |
Total Revenue |
907.8 |
1121.9 |
2029.7 |
1171.6 |
1259.9 |
2431.5 |
19.8% |
Adjusted EBITDA |
|||||||
UK Vehicle Remarketing |
42.7 |
41.3 |
84 |
47.3 |
51.5 |
98.8 |
17.6% |
International Vehicle Remarketing |
11.6 |
14.6 |
26.2 |
12.8 |
17.3 |
30.1 |
14.9% |
UK Vehicle Buying |
8.8 |
10.7 |
19.5 |
11.7 |
11.3 |
23.0 |
17.9% |
International Vehicle Buying |
- |
- |
- |
- |
- |
- |
|
Automotive Services |
6.4 |
10.8 |
17.2 |
10.9 |
10.6 |
21.5 |
25.0% |
Group Costs |
-5.0 |
-6.3 |
-11.3 |
-6.9 |
-7.0 |
-13.9 |
23.0% |
Total Adjusted EBITDA |
64.5 |
71.1 |
135.6 |
75.8 |
83.7 |
159.5 |
17.6% |
Depreciation & amortisation |
-11.1 |
-14.1 |
-25.2 |
-12.8 |
-14.1 |
-26.9 |
|
Amortisation of acquired intangibles |
-18.7 |
-19.8 |
-38.5 |
-20.0 |
-20.2 |
-40.2 |
|
Restructuring costs |
- |
- |
- |
- |
-5.5 |
-5.5 |
|
Profit on sale and leaseback |
1.1 |
4.2 |
5.3 |
-2.1 |
3.8 |
1.7 |
|
Premium listing costs |
- |
- |
- |
- |
-1.0 |
-1.0 |
|
Acquisition related items |
-2.2 |
-0.7 |
-2.9 |
- |
- |
- |
|
Total Operating Profit |
33.6 |
40.7 |
74.3 |
40.9 |
46.7 |
87.6 |
17.9% |
Finance costs |
-6.9 |
-11.0 |
-17.9 |
-6.0 |
-11.7 |
-11.7 |
|
Profit before tax (reported) |
26.7 |
29.7 |
56.4 |
34.9 |
35 |
75.9 |
34.6% |
Tax |
-2.4 |
-12.9 |
-15.3 |
-8.7 |
-18.9 |
-18.9 |
|
Net income |
24.3 |
16.8 |
41.1 |
26.2 |
16.1 |
57.0 |
38.7% |
EPS (p) reported |
4.6 |
0.6 |
5.2 |
5.4 |
1.8 |
7.2 |
38.5% |
DPS (p) |
2.20 |
4.55 |
6.75 |
2.60 |
5.95 |
8.55 |
26.7% |
Net debt |
255.9 |
260.5 |
287.4 |
191.6 |
-26.4% |
Source: Company reports. Note: 2017 finance costs include £4.9m fee write-off.
Automotive Services top-line growth of 17.1% was supported by the FY inclusion of Paragon and Supreme Wheels. Although new car volumes have had an impact on the division, the Logistics business has performed well, boosted by the new Inspect Pro product.
The company has indicated that FY19 has started well and it continues to drive efficiency across the business in UK and Europe. BCA has announced a five-year Auto Services Solutions contract with BMW (UK), including the specialist leasing business Alphabet. This contract ensures BCA is involved in providing a complete solution from defleet to inspection to remarketing. This agreement is the largest motor industry service deal signed by BCA and demonstrates the strength and depth of the business portfolio today.
The company has indicated its expectation of delivering a progressive dividend policy, with the 75% payout ratio target reached in FY18, following a 27% increase in the FY18 payment. This provides an attractive historical yield of 3.6% for investors.
Exhibit 25: Financial summary
£m |
2016 |
2017 |
2018 |
2019e |
2020e |
||
Year end 31 March |
IFRS |
IFRS |
IFRS |
IFRS |
IFRS |
||
PROFIT & LOSS |
|||||||
Revenue |
|
|
1,153.1 |
2,029.7 |
2,431.5 |
2,662.5 |
2,902.8 |
Cost of Sales |
(844.5) |
(1,624.5) |
(1,983.4) |
(2,171.9) |
(2,367.9) |
||
Gross Profit |
308.6 |
405.2 |
448.1 |
490.7 |
535.0 |
||
EBITDA |
|
|
98.5 |
135.6 |
159.5 |
170.8 |
183.9 |
Operating Profit (before amort. and except). |
90.7 |
121.3 |
143.5 |
149.5 |
159.2 |
||
Intangible Amortisation |
(9.2) |
(10.9) |
(10.9) |
(10.9) |
(10.9) |
||
Exceptionals |
(65.2) |
(36.1) |
(45.0) |
(40.2) |
(40.2) |
||
Other |
0.0 |
4.9 |
0.0 |
0.0 |
0.0 |
||
Operating Profit |
16.3 |
79.2 |
87.6 |
98.4 |
108.1 |
||
Net Interest |
(12.4) |
(17.9) |
(11.7) |
(11.5) |
(11.2) |
||
Other financial costs |
0.0 |
4.9 |
0.0 |
0.0 |
0.0 |
||
Profit Before Tax (norm) |
|
|
69.1 |
97.4 |
120.9 |
127.2 |
137.1 |
Profit Before Tax (FRS 3) |
|
|
3.9 |
56.4 |
75.9 |
87.0 |
96.9 |
Tax |
3.8 |
(15.3) |
(18.9) |
(20.0) |
(22.3) |
||
Profit After Tax (norm)* |
55.2 |
72.4 |
97.4 |
97.9 |
105.6 |
||
Profit After Tax (FRS 3) |
7.7 |
41.1 |
57.0 |
67.0 |
74.6 |
||
Average Number of Shares Outstanding (m) |
630.2 |
780.2 |
786.2 |
797.5 |
797.5 |
||
EPS - fully diluted (p) |
|
|
8.6 |
9.1 |
11.4 |
12.3 |
13.2 |
EPS - normalised (p) |
|
|
8.8 |
9.3 |
11.8 |
12.3 |
13.2 |
EPS - (IFRS) (p) |
|
|
1.2 |
5.2 |
7.2 |
8.4 |
9.3 |
Dividend per share (p) |
6.0 |
6.8 |
8.6 |
9.4 |
10.2 |
||
Gross Margin (%) |
26.8 |
20.0 |
18.4 |
18.4 |
18.4 |
||
EBITDA Margin (%) |
8.5 |
6.7 |
6.6 |
6.4 |
6.3 |
||
Operating Margin (before GW and except.) (%) |
7.9 |
6.0 |
5.9 |
5.6 |
5.5 |
||
BALANCE SHEET |
|||||||
Fixed Assets |
|
|
1,565.0 |
1,692.8 |
1,660.0 |
1,625.2 |
1,586.6 |
Intangible Assets |
1,449.5 |
1,559.5 |
1,528.6 |
1,488.5 |
1,448.4 |
||
Tangible Assets |
115.5 |
133.3 |
131.4 |
136.7 |
138.2 |
||
Investments |
0.0 |
0.0 |
0.0 |
0.0 |
0.0 |
||
Current Assets |
|
|
347.9 |
491.6 |
596.1 |
640.7 |
687.4 |
Stocks |
19.3 |
58.3 |
59.1 |
66.7 |
74.9 |
||
Debtors |
210.0 |
337.1 |
389.7 |
426.7 |
465.2 |
||
Cash |
102.4 |
84.4 |
135.3 |
135.3 |
135.3 |
||
Other |
16.2 |
11.8 |
12.0 |
12.0 |
12.0 |
||
Current Liabilities |
|
|
(266.4) |
(523.2) |
(620.4) |
(462.1) |
(497.8) |
Creditors |
(226.2) |
(364.2) |
(444.9) |
(462.1) |
(497.8) |
||
Short term borrowings |
(40.2) |
(159.0) |
(175.5) |
0.0 |
0.0 |
||
Long Term Liabilities |
|
|
(525.0) |
(299.8) |
(276.1) |
(452.0) |
(430.9) |
Long term borrowings |
(273.1) |
(254.9) |
(256.9) |
(432.7) |
(411.6) |
||
Other long term liabilities |
(251.9) |
(44.9) |
(19.2) |
(19.2) |
(19.3) |
||
Net Assets |
|
|
1,121.5 |
1,361.4 |
1,359.6 |
1,351.8 |
1,345.3 |
CASH FLOW |
|||||||
Operating Cash Flow |
|
|
6.9 |
86.6 |
171.2 |
144.7 |
166.0 |
Net Interest |
(5.8) |
(8.8) |
(8.3) |
(8.3) |
(7.9) |
||
Tax |
(3.7) |
(13.3) |
(21.4) |
(20.0) |
(22.3) |
||
Capex |
(37.9) |
(64.7) |
(62.8) |
(37.6) |
(37.1) |
||
Acquisitions/disposals |
(1,184.7) |
(109.5) |
(15.8) |
0.0 |
0.0 |
||
Financing |
1,001.1 |
39.5 |
25.3 |
(10.0) |
0.0 |
||
Dividends |
(15.6) |
(48.4) |
(55.8) |
(69.1) |
(77.6) |
||
Net Cash Flow |
(239.7) |
(118.6) |
32.4 |
(0.3) |
21.1 |
||
Opening net debt/(cash) |
|
|
(28.8) |
170.7 |
260.5 |
191.6 |
186.6 |
HP finance leases initiated |
0.0 |
0.0 |
0.0 |
0.0 |
0.0 |
||
Other |
40.2 |
28.8 |
36.5 |
5.3 |
5.5 |
||
Closing net debt/(cash) |
|
|
170.7 |
260.5 |
191.6 |
186.6 |
160.0 |
Source: Company reports, Edison Investment Research estimates. Note: *FY18 PBT includes add back of £4.9m exceptional interest charge.
|
|||||||||||||||||||||||||||||||||||
|
|
Research: Consumer
Britvic (BVIC) has successfully managed two potential threats – the Soft Drinks Levy (SDIL) and the industry CO2 shortage – to confirm modest earnings growth prospects for FY18. The recent heatwave might otherwise have driven outperformance. But with redirected marketing driving double-digit stills growth, the position was held. Looking forward, as BVIC’s business capability program completes and benefits start to flow, more meaningful earnings growth may narrow the discount to peers.