Orexo
Written by
Orexo |
Zubsolv gains; US moves to increase treatment |
Q315 financial results |
Pharma & biotech |
9 November 2015 |
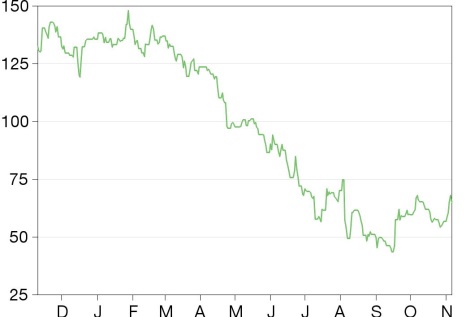
Share price performance
Business description
Next events
Analysts
Orexo is a research client of Edison Investment Research Limited |
|||||||||||||||||||||||||||||||||||||||||||||||||||||
A positive Q315 with Zubsolv sales broadly in line with expectations, coupled with a number of positive and potentially significant developments, continues to support our thesis that Orexo’s share price is overly discounting Zubsolv’s potential. The US government has announced plans to expand access to opioid dependence treatment, which could substantially increase the US market opportunity, reinforcing our current peak sales forecasts. This is in addition to key market share gains, induction label approval and two new PBM agreements. Our valuation is updated to SEK5.8bn, with the decrease owing to Abstral generics and the impact of the CVS loss to 2016 Zubsolv sales.
Year end |
Revenue (SEKm) |
PBT* |
EPS* |
DPS |
P/E |
Yield |
12/13 |
429 |
(110) |
(3.6) |
0.0 |
N/A |
N/A |
12/14 |
570 |
(53) |
(1.6) |
0.0 |
N/A |
N/A |
12/15e |
600 |
(191) |
(5.7) |
0.0 |
N/A |
N/A |
12/16e |
973 |
(180) |
(4.9) |
0.0 |
N/A |
N/A |
Note: *PBT and EPS are normalised, excluding intangible amortisation, exceptional items.
Zubsolv: Market share gains all round
Zubsolv made market share gains in Q315, growing in the main commercial market and regaining share in the highly profitable cash segment. This helped to boost the gross:net sales ratio, also aided by a one-off revision related to assumed rebate levels. The commercial segment remains the main focus for Orexo and Zubsolv continues to increase its share, which will be key for driving future growth.
First US government moves to increase access
In what could potentially be significant changes to the US opioid dependence market, the US government has announced plans to increase access to medication-assisted treatment (MAT), such as with Zubsolv, with goals to double the number of physicians authorised to prescribe buprenorphine. This is currently limited to 30,000 physicians, with around 6,000 active in treating; all have a 100-patient cap. If realised, these goals could substantially expand the current market.
Intensive discussions for Zubsolv ex-US and OX51
Orexo remains in active discussions for both Zubsolv outside of the US and for pain product OX51. Orexo reiterated its focus to find the right partner committed to maximising each opportunity.
Valuation: SEK5.8bn or SEK169/share on a DCF basis
Our Orexo valuation is largely unchanged at SEK5.8bn (from SEK6.0bn) or SEK169/share. 2016 Zubsolv sales are lowered to reflect the CVS loss, with no changes to our longer-term underlying Zubsolv forecasts, with FX providing a small boost. We have also slowed Abstral sales from mid-2018 following settlement with Actavis allowing for generic US entry from June 2018, earlier than we anticipated. Neither the ex-US Zubsolv opportunity, nor OX51, are included in our valuation.
Zubsolv: Key developments and gains during Q315
There have been a number of key positive developments during Q315, which could all be important for Zubsolv’s future. These include:
■
induction label approval;
■
two new pharmacy benefit manager (PBM) agreements in Medicaid (public healthcare); and
■
initial steps by the US government to increase access to opioid dependence treatment.
During Q315, Orexo also announced unexpected changes to Zubsolv’s formulary position at CVS Caremark. These changes, which are based purely on a financial decision with competitors offering more aggressive rebating, will come into effect from January 2016. Zubsolv will be excluded from restricted plans (a plan that is more highly controlled with less product choice for patients; typically this would be a cheaper insurance programme) and will lose preferred status in other plans. This compares to the current status, where since January 2014 Zubsolv is the only branded product covered by CVS restricted plans and has preferred branded status in other CVS plans. Under these changes Zubsolv will remain available to many, but not all CVS members. Orexo estimates that these changes could affect 10-15% of Zubsolv gross sales.
While disappointing, we believe that in the mid to longer term, any losses resulting from the CVS change should be more than offset by the new PBM agreements (both with undisclosed partners). These will offer Orexo access to a number of insurance plans, including with large insurance companies. Negotiation with these companies will take time and so these agreements will not result in an immediate Zubsolv uptick, but more likely a gradual increase in share.
The induction label should help to facilitate dialogue with physicians, providing a much simpler message; that Zubsolv can be used to initiate and maintain treatment. This is important as rather than trying to switch patients to Zubsolv after induction, de novo patients can now be initiated immediately on Zubsolv; we believe that in the longer term this should have a positive impact on Zubsolv’s positioning and uptake in the market.
US government seeks to increase access to treatment
The most significant update, not just for Zubsolv, but for the whole US opioid dependence market are plans announced by the US Department of Health and Human Services (HHS) to increase access to treatment for opioid dependence. This was then followed by comments from President Obama, where he outlined goals to double the number of physicians from 30,000 to 60,000 who are authorised to prescribe buprenorphine (currently around 6,000 physicians are active in treating opioid dependence, each with a 100-patient cap, severely limiting access to treatment). The first step is for the submission of action plans within 90 days from each of healthcare related agencies to identify current barriers to medical treatment.
If these goals are realised, this could significantly expand the current >$2bn US opioid dependence market. Although this will take time, these White House initiatives serve to reinforce our long-term Zubsolv sales forecasts.
Zubsolv makes key gains in Q315
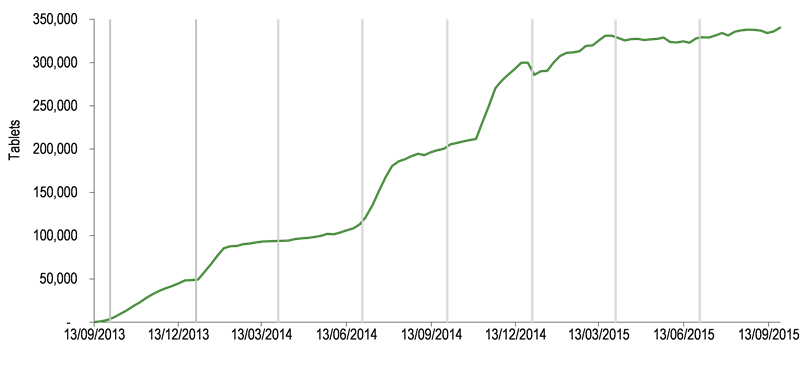
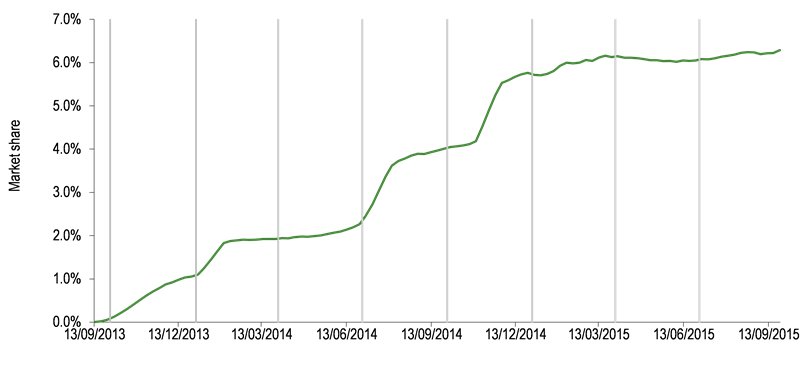
Zubsolv’s market share has steadily increased, ending Q315 at 6.4% (from 6% at the start) shown in Exhibit 2. Patient demand grew 6.2% compared to Q215, with sales also aided by stocking, currency and an improved gross:net sales ratio. Although the gross:net sales ratio is not explicitly disclosed, Orexo indicated that the improvement contributed around 40% of the 21.6% quarterly revenue growth. A large part of this was owing to a positive one-off adjustment related to assumed rebate provisions (where Orexo makes assumptions regarding the rebate level, which is then adjusted at a later stage to reflect the actual rebate). As this is likely a one-off effect, we expect a return to higher rebating in the near-term.
|
Exhibit 1: Zubsolv tablet volumes (four-week average) |
Exhibit 2: Zubsolv market share (four-week average) |
|
|
|
Source: Wolters Kluwer, Bloomberg. Gridlines separate quarters |
|
Exhibit 1: Zubsolv tablet volumes (four-week average) |
|
|
Source: Wolters Kluwer, Bloomberg. Gridlines separate quarters |
|
Exhibit 2: Zubsolv market share (four-week average) |
|
|
Source: Wolters Kluwer, Bloomberg. Gridlines separate quarters |
Zubsolv continues to make gains in the commercial segment (market share now 9.3%); this is the largest and one of the more profitable segments, hence traction here is key. A summary of the dynamics in each of the three market sectors are shown in Exhibit 3. Share has remained stable in the public segment (with the highest rebates). Share has been regained in the highly profitable cash segment, with this helping to improve the gross:net sale ratio. Orexo remains most focused on the commercial segment, the largest of the market. Gains continue to be made in the absence of any new agreements, suggesting physician and patient acceptance in this key segment.
Exhibit 3: Overview of the main market segments
Commercial |
Public |
Cash & Vouchers |
|
Four-week average market share |
|||
At end December 2014 |
7.3% |
4.3% |
5.3% |
At end June 2015 |
8.6% |
3.4% |
4.9% |
At end September 2015 |
9.3% |
3.5% |
5.3% |
% of total market volume |
42% |
39% |
18% |
% of Zubsolv sales |
62% |
22% |
15% |
Rebating |
Low-medium |
High |
Low |
Source: Orexo estimates
Valuation
Our Orexo valuation has been updated to SEK5.8bn or SEK169/share (from SEK6.0bn and SEK173/share). We have reduced Zubsolv sales in 2016 owing to the CVS loss reducing gross sales to $190m (from $211m), a 10% decline. We have made no changes to our underlying Zubsolv assumptions beyond 2016, which have been updated for FX (our long-term FX forecasts use the current rate). Our forecasts are now based on the current rate of SEK8.55/US$ (from 8.45 when we last published our forecasts), which results in some very minor c 1% upgrades to our Zubsolv SEK-based forecasts. We have also made some downgrades to our Abstral forecasts from mid-2018, when generics will become available under the terms of the agreement with Actavis. Our valuation has also been rolled forward in time and updated to reflect most recent net debt (which has increased).
Our underlying long-term Zubsolv assumptions are unchanged, maintaining our peak market share of 25% (equivalent to peak Zubsolv gross sales of around $700-750m). We continue to expect rebating will improve over time from current levels (not disclosed), as growth accelerates in the non-exclusive segments to a long-term average of around 35% (implying peak net sales of c $480m). Our Zubsolv forecasts are shown in Exhibit 4. Evidence of a growth step-up, or implementation of government plans to increase access to treatment could lead us to positively revise these forecasts.
Exhibit 4: Zubsolv revenue assumptions to 2021
Assumption |
2014 |
2015e |
2016e |
2017e |
2018e |
2019e |
2020e |
2021e |
Zubsolv sales – pre-rebates ($m) |
57.3 |
107 |
190 |
352 |
470 |
559 |
648 |
738 |
Zubsolv sales – post-rebates ($m) |
32.8 |
52 |
99 |
211 |
306 |
363 |
421 |
480 |
Total Zubsolv sales – post-rebates (SEKm) |
228 |
439 |
849 |
1,808 |
2,617 |
3,110 |
3,604 |
4,105 |
Total product sales (SEKm) |
569 |
600 |
973 |
1,975 |
2,691 |
3,158 |
3,628 |
4,105 |
Source: Edison Investment Research, Orexo. Note: Assumes SEK8.55/$ FX rate, peak market share of 25% and average 35% rebate.
Our explicit DCF-based valuation out to 2030 assumes a WACC of 10%, a long-term tax rate of 30% after 2016 and no terminal value. We estimate a long-term gross margin of 85% on Zubsolv by 2025, with the operating margin gradually trending to 50% in the long term. We include a modest revenue contribution from global Abstral and Edluar royalties until 2020, at which point we assume for simplicity that all revenues relate to Zubsolv. We do not explicitly value the ex-US Zubsolv opportunity, nor OX51, which could both provide upside to our forecasts.
Financials
Zubsolv Q315 net revenues were SEK110.8m, +21.6% compared to Q215 and +62% y-o-y. This is encouraging, particularly given the quarterly decline observed in Q215. Based on the average FX rate during the quarter, we estimate this implies net sales of $13.1m. With Q315 Zubsolv sales broadly in line with our expectations, we have made no changes to our 2015 Zubsolv forecasts. We have reduced 2016 sales, decreasing gross US$ sales by 10% to reflect the impact of the CVS loss. However, in the mid- to longer term, we believe this will be more than offset by the new agreements and the growing underlying share, hence we have made no changes to our underlying Zubsolv forecasts beyond 2016, adjusting only for currency (with FX now SEK8.55/US$ from 8.45).
Total product revenues in Q315 were SEK139.5m, with Abstral and Edluar broadly in line with our FY15 expectations. Orexo recently settled a patent dispute with Actavis regarding Abstral, which will allow Actavis to enter the US market from June 2018 (or earlier under certain undisclosed conditions); this is ahead of the September 2019 patent expiry. As a result of this settlement, we now decline Abstral sales from mid-2018, rather than from 2020.
Q315 R&D expenses were SEK43.3m and 9M15 were SEK116.5m. Although there was a +13.7% q-o-q increase in Q315, we had expected a more marked acceleration. Management continues to expect an uptick in Q415, but now expects R&D expenses of around SEK185m for 2015 (compared to the previous expectation of SEK200m), with which we are in-line.
S&M spend was SEK70.8m, which is 13.3% below Q215. We continue to expect Q4 spend to be similar to Q215 (SEK81.7m) and for FY15 S&M spend of SEK309.8m.
Our financial forecasts are summarised in Exhibit 6 and the main changes to our estimates post Q315 are shown in Exhibit 5.
Exhibit 5: Changes to estimates
Revenue (SEKm) |
PBT (SEKm) |
EPS (SEK) |
|||||||
Old |
New |
Change |
Old |
New |
Change |
Old |
New |
Change |
|
2015e |
600 |
600 |
0.0% |
(215) |
(191) |
11.1% |
(6.5) |
(5.7) |
11.7% |
2016e |
1,056 |
973 |
-7.8% |
(104) |
(180) |
-72.8% |
(2.9) |
(4.9) |
-72.1% |
2017e |
1,953 |
1,975 |
1.2% |
409 |
401 |
2.0% |
8.3 |
8.1 |
2.4% |
Source: Edison Investment Research. Note: SEK/US$ FX rate updated to 8.55 from 8.45.
Exhibit 6: Financial summary
SEKm |
2012 |
2013 |
2014 |
2015e |
2016e |
2017e |
||
Year end 31 December |
IFRS |
IFRS |
IFRS |
IFRS |
IFRS |
IFRS |
||
PROFIT & LOSS |
||||||||
Revenue |
|
|
326 |
429 |
570 |
600 |
973 |
1,975 |
Cost of Sales |
(28) |
(29) |
(107) |
(145) |
(223) |
(406) |
||
Gross Profit |
298 |
400 |
463 |
455 |
751 |
1,570 |
||
EBITDA |
|
|
(62) |
(45) |
(13) |
(156) |
(153) |
429 |
Operating Profit (before GW and except.) |
|
(68) |
(96) |
(25) |
(170) |
(160) |
423 |
|
Intangible Amortisation |
(1) |
0 |
0 |
0 |
0 |
0 |
||
Other |
(7) |
(6) |
17 |
6 |
0 |
0 |
||
Exceptionals |
(10) |
(44) |
0 |
0 |
0 |
0 |
||
Operating Profit |
(79) |
(140) |
(25) |
(170) |
(160) |
423 |
||
Net Interest |
(8) |
(14) |
(28) |
(21) |
(20) |
(22) |
||
Other |
0 |
0 |
0 |
0 |
0 |
0 |
||
Profit Before Tax (norm) |
|
|
(77) |
(110) |
(53) |
(191) |
(180) |
401 |
Profit Before Tax (IFRS) |
|
|
(88) |
(153) |
(53) |
(191) |
(180) |
401 |
Tax |
2 |
(2) |
(4) |
(8) |
9 |
(120) |
||
Deferred tax |
0 |
0 |
0 |
0 |
0 |
0 |
||
Profit After Tax (norm) |
(75) |
(111) |
(57) |
(199) |
(171) |
281 |
||
Profit After Tax (IFRS) |
(86) |
(155) |
(57) |
(199) |
(171) |
281 |
||
Average Number of Shares Outstanding (m) |
29.4 |
30.8 |
34.3 |
34.6 |
34.6 |
34.6 |
||
EPS - normalised (SEK) |
|
|
(2.5) |
(3.6) |
(1.6) |
(5.7) |
(4.9) |
8.1 |
EPS - IFRS (SEK) |
|
|
(2.9) |
(5.0) |
(1.6) |
(5.7) |
(4.9) |
8.1 |
Dividend per share (SEK) |
0.0 |
0.0 |
0.0 |
0.0 |
0.0 |
0.0 |
||
Gross Margin (%) |
91.5 |
93.2 |
81.2 |
75.8 |
77.1 |
79.5 |
||
EBITDA Margin (%) |
(19.0) |
(10.5) |
(2.2) |
(26.0) |
(15.7) |
21.7 |
||
Operating Margin (before GW and except.) (%) |
(21.0) |
(22.3) |
(4.4) |
(28.3) |
(16.4) |
21.4 |
||
BALANCE SHEET |
||||||||
Fixed Assets |
|
|
189 |
228 |
290 |
252 |
246 |
241 |
Intangible Assets |
135 |
195 |
259 |
226 |
226 |
226 |
||
Tangible Assets |
35 |
33 |
29 |
24 |
17 |
12 |
||
Other |
19 |
0 |
1 |
2 |
2 |
2 |
||
Current Assets |
|
|
293 |
544 |
936 |
808 |
636 |
1,030 |
Stocks |
28 |
383 |
478 |
400 |
366 |
445 |
||
Debtors |
18 |
55 |
174 |
225 |
240 |
487 |
||
Cash |
228 |
106 |
285 |
183 |
26 |
94 |
||
Other |
19 |
0 |
0 |
0 |
5 |
5 |
||
Current Liabilities |
|
|
(169) |
(497) |
(268) |
(290) |
(300) |
(407) |
Creditors |
(169) |
(360) |
(266) |
(290) |
(300) |
(407) |
||
Short term borrowings |
0 |
(137) |
(3) |
0 |
0 |
0 |
||
Long Term Liabilities |
|
|
(122) |
(114) |
(503) |
(498) |
(498) |
(498) |
Long term borrowings |
(114) |
(104) |
(494) |
(494) |
(494) |
(494) |
||
Other long term liabilities |
(8) |
(10) |
(9) |
(4) |
(4) |
(4) |
||
Net Assets |
|
|
191 |
161 |
455 |
273 |
85 |
366 |
CASH FLOW |
||||||||
Operating Cash Flow |
|
|
34 |
(256) |
(456) |
(100) |
(133) |
103 |
Net Interest |
(5) |
(6) |
(32) |
(26) |
(20) |
(22) |
||
Tax |
0 |
(2) |
0 |
0 |
(3) |
(13) |
||
Capex |
(5) |
(108) |
(72) |
(3) |
(1) |
(1) |
||
Acquisitions/disposals |
12 |
0 |
0 |
22 |
0 |
0 |
||
Financing |
(52) |
19 |
342 |
4 |
0 |
0 |
||
Dividends |
0 |
0 |
0 |
0 |
0 |
0 |
||
Other |
0 |
(3) |
0 |
0 |
0 |
0 |
||
Net Cash Flow |
(17) |
(354) |
(217) |
(104) |
(157) |
68 |
||
Opening net debt/(cash) |
|
|
(132) |
(115) |
135 |
212 |
310 |
468 |
HP finance leases initiated |
0 |
0 |
0 |
0 |
0 |
0 |
||
Exchange rate movements |
(0) |
3 |
2 |
(4) |
0 |
0 |
||
Other |
(1) |
102 |
139 |
9 |
0 |
0 |
||
Closing net debt/(cash) |
|
|
(115) |
135 |
212 |
310 |
468 |
400 |
Source: Edison Investment Research, Orexo accounts
|
SNP Schneider-Neureither & Partner