Premier Oil’s (PMO’s) FY17 results highlighted progress made by the Sea Lion project operator in securing vendor/debt financing, a key hurdle ahead of the final investment decision (FID). Premier’s proposed financing structure proposes a combination of vendor finance ($375m), senior debt ($750m) and equity ($375m) to fund the $1.5bn gross capex bill ahead of first oil. We had previously heavily risked Sea Lion Phase 1, given perceived uncertainty over Premier’s commitment to the project. We believe deleveraging of Premier’s balance sheet, the materiality of Sea Lion in the context of Premier’s development portfolio and progress made with regard to project finance significantly increase our confidence in the project reaching FID. We risk Sea Lion Phase 1 at a 40% chance of success (up from 20%), increasing our valuation of Rockhopper (RKH) from 44.2p/share to 62.9p/share (+42%).
Written by
Rockhopper Exploration |
Operator confident in 2018 Sea Lion Phase 1 FID |
Company update |
Oil & gas |
19 March 2018 |
Share price performance
Business description
Next events
Analysts
Rockhopper Exploration is a research client of Edison Investment Research Limited |
|||||||||||||||||||||||||||||||||||||||||||||||||||
Premier Oil’s (PMO’s) FY17 results highlighted progress made by the Sea Lion project operator in securing vendor/debt financing, a key hurdle ahead of the final investment decision (FID). Premier’s proposed financing structure proposes a combination of vendor finance ($375m), senior debt ($750m) and equity ($375m) to fund the $1.5bn gross capex bill ahead of first oil. We had previously heavily risked Sea Lion Phase 1, given perceived uncertainty over Premier’s commitment to the project. We believe deleveraging of Premier’s balance sheet, the materiality of Sea Lion in the context of Premier’s development portfolio and progress made with regard to project finance significantly increase our confidence in the project reaching FID. We risk Sea Lion Phase 1 at a 40% chance of success (up from 20%), increasing our valuation of Rockhopper (RKH) from 44.2p/share to 62.9p/share (+42%).
Year end |
Revenue |
PBT* |
Cash from |
Net (debt)/ |
Capex |
12/15 |
4.0 |
(44.7) |
(6.9) |
110.4 |
(80.9) |
12/16 |
7.4 |
98.0 |
(21.2) |
81.0 |
(40.2) |
12/17e |
9.8 |
(8.3) |
(0.7) |
51.1 |
(27.6) |
12/18e |
8.1 |
(13.9) |
3.0 |
35.7 |
(18.5) |
Note: *PBT and EPS are normalised, excluding amortisation of acquired intangibles, exceptional items and share-based payments.
De-risking Sea Lion Phase 1 (Rockhopper 40%)
In this note, we describe the events that lead us to believe that Sea Lion Phase 1 is more likely to be developed than we had previously assumed. Higher prevailing oil prices and lower capital costs are key elements behind the operator’s renewed confidence in progressing the project through to FID in 2018. Premier estimates net economics, on a leveraged basis, and assumes a 10% cost of equity at $1bn ($65/bbl oil). We use more conservative assumptions, with RKH’s weighted average cost of capital at 12.5% and first oil deferred to 2023 (operator 2022). Based on a $70/bbl long term oil price, our risked valuation of RKH stands at 62.9p/share.
Oil price sensitivity remains high
The economics of Sea Lion remain sensitive to our underlying oil price assumption and cost of capital. For example, a $5/bbl increase/decrease in our long-term oil price assumption (from $70/bbl Brent) has a c 19% positive/negative impact on our RKH risked valuation. Premier Oil estimates that its net economics are break-even at c $45/bbl.
Valuation: Sea Lion funding and FID key catalysts
Key catalysts in 2018 include finalised funding terms with providers of vendor and debt finance. This will be followed by project FID towards the end of the year. We expect both of these to further de-risk Sea Lion Phase 1 from our current 40% chance of commercial success.
Premier Oil confident in de-risked Sea Lion Phase 1
Premier Oil reported FY17 results on 8 March 2018, highlighting the progress the company has made in restoring balance sheet strength. This included a combination of refinancing existing facilities, successful execution of the Catcher development and consequent enhanced organic cash generation and non-core asset disposals. Looking ahead, Premier Oil expects leverage to fall to c 2.5x net debt/EBITDAX by end Q119, enabling management to direct cash flow towards high-return growth projects in addition to debt reduction.
The largest project in Premier Oil’s current development portfolio is Sea Lion, with potential Phase 1 net production of 50kboed, and a Premier estimated post-tax net leveraged NPV10 of c $1bn at a $65/bbl oil price. Funding for the project is expected to be split into three component parts: vendor financing (c $375m), export credit/bank finance (c $750m) and upstream partner equity (c $375m).
|
Exhibit 1: Premier Oil major projects delivering future production |
Exhibit 2: Sea Lion Phase 1 pre-first oil capex split and sources of capital |
|
|
|
Source: Premier Oil |
|
Exhibit 1: Premier Oil major projects delivering future production |
|
|
Source: Premier Oil |
|
Exhibit 2: Sea Lion Phase 1 pre-first oil capex split and sources of capital |
|
|
Source: Premier Oil |
Below we highlight key elements of Premier Oil’s FY17 annual results presentation/conference call, which give us increased confidence in the potential development of Sea Lion Phase 1:
■
Premier Oil expects material deleveraging in 2018 with a management forecast reduction in net debt/EBITDAX to 2.5x by end Q119 at a $65/bbl Brent crude price.
■
Cash receipts from non-core asset sales (eg Babbage) are expected to further reduce leverage.
■
Premier’s committed development capex in 2018/19 remains relatively low, with the Tolmount development expected to be delivered at a net capex cost of c $100m.
■
Premier estimates a Sea Lion Phase 1 project break-even (net to Premier) of $45/bbl.
■
Increasing interest from senior debt providers and service contractors to part-finance Sea Lion Phase 1 development, reducing Premier’s net equity capital requirements to $375m pre-first oil. Premier Oil’s CEO, Tony Durrant, said: “We’re encouraged by the return of interest from some banks into the project finance market. I think that’s a conversation that would have been very difficult 12-24 months ago. But we’ve had recent discussions which are encouraging.”
■
EIA statement: public consultation nearing completion.
■
Alignment with Falkland Islands Government (FIG) on commercial and regulatory terms.
■
Premier’s Catcher development experience gives the Sea Lion operator greater confidence in the execution of FPSO projects. Premier sees overlap in the chosen contractors for Sea Lion and Catcher, based on Catcher’s track record of delivery.
■
The Falklands accounts for c 44% of Premier Oil’s December 2017 net 2P reserves.
■
Further due diligence on the Sea Lion project by contractors providing vendor finance gives confidence in the technical case. This is supported by the 17 wells drilled to date and technical assessment of issues associated with Metocean conditions, waxy crude and logistical constraints.
■
The Sea Lion project has a substantially agreed field development plan (FDP), which will be updated for the final time ahead of sanction.
■
Letters of intent (LoIs) signed with contractors for provision of rig, well services, and logistical services and vendor financing.
■
Formal sanction of Sea Lion is expected by FIG in 2019.
Premier expects to finalise project funding during 2018 ahead of FID towards the end of 2018 and with first oil in 2022. We continue to assume a 2023 first oil for Phase 1 of the development, just over four years after project sanction. This is a slightly longer development timeline than Catcher, which was sanctioned by Premier Oil in June 2014 and delivered first oil in December 2017.
|
Exhibit 3: Premier Oil comparison of Sea Lion Phase 1 and Catcher |
|
|
Source: Premier Oil |
|
Exhibit 4: Edison Gross production profile for Sea Lion Phases 1 to 3 |
|
|
Source: Edison Investment Research |
Valuation: Phase 1 development becoming a reality
We see confirmation of vendor financing and senior debt as important enablers of the project that we feel will further de-risk Sea Lion Phase 1 from a market perspective. In this note, we have increased our commercial chance of success for Sea Lion Phase 1 from a modest 20% to 40%, although we see potential for further de-risking in the coming months as financing is secured. This upgrade also includes the impact of rolling forward the date at which we discount cash flows to start 2018, modified capex phasing and is partly offset by a currency mark-to-market with our £/US$ rate changing from 1.3 to 1.4.
Our total Rockhopper RENAV rises from 44.2p/share to 62.9p/share (+42%) as a result and we provide a valuation sensitivity analysis to Sea Lion’s chance of success in Exhibit 5 below.
|
Exhibit 5: Sea Lion Phase 1 de-risking |
|
|
Source: Edison Investment Research |
We note that Premier Oil’s net Sea Lion Phase 1 valuation, which Premier management estimates at $1bn using a $65/bbl oil price assumption, includes the cost carry of RKH’s share of capex to first oil and is calculated on a leveraged basis with a 10% cost of equity. Key differences between our valuation of Sea Lion and Premier Oil’s are highlighted below:
Exhibit 6: Differences between Edison and Premier Oil (WI 60%) valuation of Sea Lion Phase 1
Edison |
Premier Oil |
Phase 1 unrisked NPV net to Premier Oil $474m |
Phase 1 unrisked NPV net Premier Oil c $1,000m |
First oil 2023 |
First oil 2022 |
Unleveraged |
Leveraged (finance costs undisclosed) |
12.5% cost of capital |
10% cost of equity |
$70/bbl Brent LT oil price |
$65/bbl oil price assumption |
RKH cost carried |
RKH cost carried |
Edison |
Phase 1 unrisked NPV net to Premier Oil $474m |
First oil 2023 |
Unleveraged |
12.5% cost of capital |
$70/bbl Brent LT oil price |
RKH cost carried |
Premier Oil |
Phase 1 unrisked NPV net Premier Oil c $1,000m |
First oil 2022 |
Leveraged (finance costs undisclosed) |
10% cost of equity |
$65/bbl oil price assumption |
RKH cost carried |
Source: Edison Investment Research
Exhibit 7: Rockhopper risked valuation
Asset |
Recoverable reserves |
|
Net risked value |
|||||||||
Shares: 457m |
First |
WI |
CoS |
Gross |
Net |
NPV |
at WACC of 12.5% |
Sensitivity of WACCs at |
||||
Country |
production |
(%) |
|
mmboe |
$/boe |
$m |
/share |
10% |
15% |
20% |
||
Net (debt)/cash - December 2017e |
51 |
8.0 |
8.0 |
8.0 |
8.0 |
|||||||
G&A (NPV12.5 of five years) |
(20) |
(3.2) |
(3.2) |
(3.2) |
(3.2) |
|||||||
Cash to buyer of Civita assets |
(2) |
(0.3) |
(0.3) |
(0.3) |
(0.3) |
|||||||
Production |
||||||||||||
Guendalina |
Italy |
20% |
100% |
1.2 |
0.2 |
13.8 |
3 |
0.5 |
0.5 |
0.5 |
0.5 |
|
Abu Sennan |
Egypt |
22% |
100% |
10 |
2.2 |
5.3 |
12 |
1.8 |
2.1 |
1.6 |
1.3 |
|
Development |
||||||||||||
Sea Lion Phase 1 |
Falkland Islands |
2023 |
40% |
40% |
221 |
88 |
5.7 |
251 |
39.3 |
51.8 |
29.8 |
16.9 |
Sea Lion Phase 2 in PL32 |
Falkland Islands |
2028 |
40% |
20% |
87 |
35 |
4.0 |
21 |
3.2 |
5.0 |
2.1 |
0.9 |
Sea Lion Phase 2 in PL04 |
Falkland Islands |
2028 |
64% |
20% |
214 |
137 |
3.4 |
70 |
11.0 |
17.5 |
6.7 |
2.2 |
Ombrina Mare - under arbitration |
Italy |
16 |
2.5 |
2.5 |
2.5 |
2.5 |
||||||
Core NAV |
|
|
|
|
533 |
262 |
|
402 |
62.9 |
83.9 |
47.8 |
28.9 |
Source: Edison Investment Research
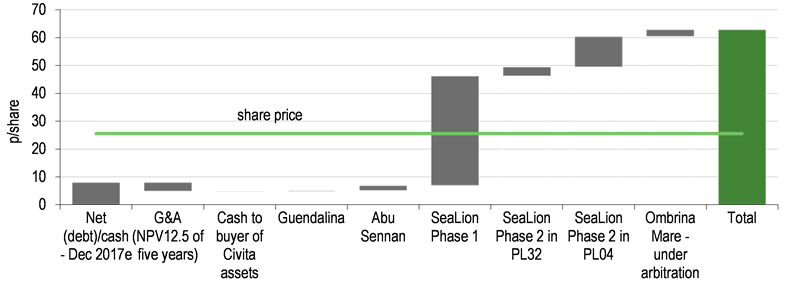
Our updated valuation assumes a 40% commercial chance of success for Sea Lion Phase 1. We expect further de-risking as Premier secures debt funding and reaches project FID. As it stands, we estimate that the market is assuming a c 20% chance of success for Sea Lion Phase 1 and minimal value for future phases of development.
|
Exhibit 8: Rockhopper base case valuation waterfall |
|
|
Source: Edison Investment Research |
Risks and sensitivities
The economics of Sea Lion remain sensitive to our underlying oil price assumption and cost of capital, as shown in Exhibit 9. A $5/bbl reduction in our long-term oil price assumption (from $70/bbl Brent to $65/bbl) has a 19% negative impact on our RKH RENAV. Premier Oil estimates that the company’s net economics are break-even at c $45/bbl.
Exhibit 9: Rockhopper valuation sensitivity to long-term oil price and WACC*
WACC |
7.5% |
10.0% |
12.5% |
15.0% |
17.5% |
Oil price $/bbl |
|||||
50 |
42 |
29 |
21 |
14 |
11 |
60 |
78 |
57 |
42 |
32 |
24 |
70 |
113 |
84 |
63 |
48 |
37 |
80 |
149 |
111 |
84 |
65 |
50 |
90 |
184 |
138 |
105 |
81 |
63 |
Source: Edison Investment Research. Note: *Base case long-term $70/bbl Brent in 2022, and 12.5% WACC.
Funding risk: key risks are around the Sea Lion partner group’s ability to secure vendor, senior debt and equity financing for the Phase 1 development, as discussed earlier in this note.
Oil price risk: the bulk of RKH’s value is dependent on long-term prices, although near-term cash flows are reliant on near-term realisations in Italy and Egypt.
Fiscal regime change: the FIG is unlikely to increase the fiscal take in the foreseeable future, especially given the current outlook for oil prices. Indeed, given the delays in getting project sanction, it is in everyone’s interest to incentivise first oil as soon as possible. A renegotiation of terms is therefore possible, but we are not assuming it.
Reservoir risk: Sea Lion has been extensively appraised, so reservoir distribution here is understood and the waxy nature of the Sea Lion crude known. Similar appraisal and analysis will be required at the Isobel-Elaine complex.
Argentina: relations between Argentina and the UK have thawed in recent years. In September 2016, the UK and Argentinean governments agreed to work together to remove “restrictive measures around the oil and gas industry, shipping and fishing affecting the Falkland Islands”. A second commercial flight to the Falklands is expected later this year, which requires UK and Argentinean support. We hope that a path to normalisation of diplomatic relations continues.
Payment and repatriation risk from Egypt: Egyptian production can be paid in a combination of Egyptian pounds and US dollars, and we believe that it is materially easier to be paid in Egyptian pounds (although to date RKH has only accepted US dollars, paid directly into its UK bank accounts).
Financials
Rockhopper presents an end-December 2017 unaudited $51m in cash and no debt. We expect this to fall to just over $35.7m by year end FY18 (assuming a c $3m receivable unwind) as the company funds pre-sanction activity for Sea Lion, including corporate G&A as well as $3m for Abu Sennan and the Raya-1X well in Egypt.
Current cash is clearly not enough to fund development of Sea Lion, but existing farm-out agreements with PMO will enable RKH to progress to Sea Lion first oil, based on the partner group’s estimated $1.5bn gross capex bill. Existing agreements call for a $337m development carry on Phase 1, with a similar-sized carry on further phases. Given the debt-biased financing structure outlined by PMO, the carry net to RKH of the $375m equity finance for Phase 1 pre-first oil would only be $150m. We would not be surprised to see an evolution of the existing farm-out agreement.
Greater Mediterranean assets and 2018 outlook
RKH recently provided an update on the company’s Greater Mediterranean assets, reporting improved production from Abu Sennan, strong realisations and confirmation of a four-well drilling programme in 2018. The company’s Egyptian receivables position is significantly reduced ($4.5m outstanding) and historical liabilities to Beach Energy have been satisfied, meaning RKH will now benefit from 100% of payments from the Egyptian General Petroleum Corporation (EGPC) relating to its net interest. Cash flows from the company’s Egyptian asset base are expected to cover operational costs, G&A and contribute to maintenance capex going forward. Company financials are largely driven by the company’s producing Greater Mediterranean assets and the continued investment in Sea Lion.
Abu Sennan: producing slightly ahead of management expectations following workovers in H217 at 880kboed net. Following JV approval, the company is to drill one exploration well (Prospect S), two development wells and a water injection programme at Al Jahraa in 2018. The focus remains on replacing reserves and maintaining production, with the potential to materially increase recovery factor over time. (Abu Sennan accounts for 2p/share of our NAV.) Net capex for the assets is estimated at $3m in 2018.
El Qa’a Plain: the Raya-1X commitment well is to be drilled in 2018, targeting a relatively high COS, but small (1-2mmbo) prospect close to existing discoveries. Net capex is estimated at less than $1m.
Italy: Guendalina continues to perform to forecasts (290kboed in 2017). However, the Civita gas field incurred downtime in February 2018 due to a pipeline depressurisation event, which is to be remedied. RKH continues to look at divesting its non-core Italian assets, including Civita (currently just 0.3p/share of our NAV), to Cabot Energy.
Exhibit 10: Financial summary
Accounts: IFRS, Year-end: December, US$000s |
2014 |
2015 |
2016 |
2017e |
2018e |
2019e |
2020e |
|
PROFIT & LOSS |
||||||||
Total revenues |
|
1,910 |
3,966 |
7,417 |
9,837 |
8,078 |
7,884 |
7,229 |
Cost of sales |
|
(3,970) |
(11,049) |
(7,667) |
(8,317) |
(9,404) |
(10,784) |
(12,266) |
Gross profit |
|
(2,060) |
(7,083) |
(250) |
1,520 |
(1,326) |
(2,900) |
(5,037) |
SG&A (expenses) |
|
(10,033) |
(10,895) |
(9,970) |
(5,729) |
(5,600) |
(5,740) |
(5,884) |
Other income/(expense) |
|
(1,782) |
(22,934) |
(8,237) |
(2,188) |
0 |
0 |
0 |
Exceptionals and adjustments |
5,844 |
(10) |
116,527 |
4,565 |
(100) |
(2,000) |
(2,050) |
|
Depreciation and amortisation |
|
0 |
0 |
0 |
0 |
0 |
0 |
0 |
Reported EBIT |
|
(8,031) |
(40,922) |
98,070 |
(1,832) |
(7,026) |
(10,640) |
(12,971) |
Finance income/(expense) |
|
657 |
975 |
307 |
533 |
181 |
52 |
29 |
Other income/(expense) |
|
(209) |
(4,750) |
(333) |
(6,991) |
(7,094) |
(8,158) |
(9,382) |
Exceptionals and adjustments |
0 |
0 |
0 |
0 |
0 |
0 |
0 |
|
Reported PBT |
|
(7,583) |
(44,697) |
98,044 |
(8,290) |
(13,940) |
(18,747) |
(22,323) |
Income tax expense (includes exceptionals) |
|
(5) |
55,395 |
0 |
2,813 |
0 |
0 |
0 |
Reported net income |
|
(7,588) |
10,698 |
98,044 |
(5,477) |
(13,940) |
(18,747) |
(22,323) |
Basic average number of shares, m |
|
289 |
293 |
446 |
457 |
457 |
457 |
457 |
Basic EPS |
|
(2.6) |
3.7 |
22.0 |
(12.0) |
(30.5) |
(41.0) |
(48.9) |
Adjusted EBITDA |
|
(13,875) |
(32,814) |
(15,163) |
(1,456) |
(420) |
(411) |
(899) |
Adjusted EBIT |
|
(13,875) |
(40,912) |
(18,457) |
(6,397) |
(6,926) |
(8,640) |
(10,921) |
Adjusted PBT |
|
(13,427) |
(44,687) |
(18,483) |
(12,855) |
(13,840) |
(16,747) |
(20,273) |
Adjusted EPS (p/share) |
|
0 |
0 |
0 |
0 |
0 |
0 |
0 |
Adjusted diluted EPS (p/share) |
|
(2) |
12 |
(1) |
(2) |
(3) |
(4) |
(5) |
BALANCE SHEET |
|
|||||||
Property, plant and equipment |
|
12,146 |
12,637 |
18,025 |
13,579 |
18,204 |
19,854 |
16,847 |
Goodwill |
|
0 |
0 |
0 |
0 |
0 |
0 |
0 |
Intangible assets |
|
204,164 |
256,658 |
426,419 |
442,960 |
449,937 |
441,866 |
436,659 |
Other non-current assets |
|
11,506 |
9,803 |
9,439 |
10,283 |
10,283 |
10,283 |
10,283 |
Total non-current assets |
|
227,816 |
279,098 |
453,883 |
466,822 |
478,425 |
472,003 |
463,790 |
Cash and equivalents |
|
199,726 |
110,434 |
81,019 |
51,098 |
35,735 |
33,568 |
30,890 |
Inventories |
|
2,188 |
1,670 |
1,608 |
1,545 |
1,545 |
1,545 |
1,545 |
Trade and other receivables |
|
4,681 |
6,199 |
17,184 |
13,985 |
11,000 |
11,000 |
11,000 |
Other current assets |
|
1,384 |
2,192 |
495 |
3,638 |
3,638 |
3,638 |
3,638 |
Total current assets |
|
207,979 |
120,495 |
100,306 |
70,266 |
51,918 |
49,751 |
47,073 |
Non-current loans and borrowings |
|
0 |
0 |
0 |
0 |
0 |
0 |
0 |
Other non-current liabilities |
|
60,960 |
106,893 |
93,174 |
92,029 |
99,123 |
107,282 |
116,664 |
Total non-current liabilities |
|
60,960 |
106,893 |
93,174 |
92,029 |
99,123 |
107,282 |
116,664 |
Trade and other payables |
|
19,358 |
30,457 |
34,012 |
15,272 |
15,272 |
15,272 |
15,272 |
Current loans and borrowings |
|
0 |
0 |
0 |
0 |
0 |
0 |
0 |
Other current liabilities |
|
100,439 |
9 |
9 |
9,016 |
9,016 |
9,016 |
9,016 |
Total current liabilities |
|
119,797 |
30,466 |
34,021 |
24,288 |
24,288 |
24,288 |
24,288 |
Equity attributable to company |
|
255,038 |
262,234 |
426,994 |
420,771 |
406,931 |
390,185 |
369,911 |
Non-controlling interest |
|
0 |
0 |
0 |
0 |
0 |
0 |
0 |
CASH FLOW STATEMENT |
|
|||||||
Profit for the year |
|
(7,583) |
(44,697) |
98,044 |
(8,290) |
(13,940) |
(18,747) |
(22,323) |
Taxation expenses |
|
0 |
0 |
0 |
0 |
0 |
0 |
0 |
Net finance expenses |
|
(470) |
3,942 |
16 |
6,448 |
6,914 |
8,106 |
9,353 |
Depreciation and amortisation |
|
2,186 |
2,744 |
4,725 |
5,333 |
6,897 |
8,621 |
10,414 |
Share based payments |
|
672 |
1,937 |
994 |
(48) |
100 |
2,000 |
2,050 |
Other adjustments (impairments) |
|
(4,415) |
26,075 |
(115,546) |
(3,003) |
0 |
0 |
0 |
Movements in working capital |
|
(1,627) |
3,143 |
(9,433) |
(1,118) |
2,985 |
0 |
0 |
Interest paid/received |
|
0 |
0 |
0 |
0 |
0 |
0 |
0 |
Income taxes paid |
|
0 |
0 |
0 |
0 |
0 |
0 |
0 |
Cash from operations (CFO) |
|
(11,237) |
(6,856) |
(21,200) |
(678) |
2,957 |
(19) |
(507) |
Capex |
|
(11,261) |
(80,919) |
(40,203) |
(27,587) |
(18,500) |
(2,200) |
(2,200) |
Acquisitions & disposals net |
|
(24,037) |
0 |
(13,527) |
(2,605) |
0 |
0 |
0 |
Other investing activities |
|
84,720 |
39,791 |
77,755 |
398 |
181 |
52 |
29 |
Cash used in investing activities (CFIA) |
|
49,422 |
(41,128) |
24,025 |
(29,794) |
(18,319) |
(2,148) |
(2,171) |
Net proceeds from issue of shares |
|
(225) |
(2,733) |
0 |
0 |
0 |
0 |
0 |
Movements in debt |
|
0 |
0 |
0 |
0 |
0 |
0 |
0 |
Other financing activities (includes rig settlement) |
|
439 |
2,219 |
(2) |
12 |
0 |
0 |
0 |
Cash from financing activities (CFF) |
|
214 |
(514) |
(2) |
12 |
0 |
0 |
0 |
Increase/(decrease) in cash |
|
38,399 |
(48,498) |
2,823 |
(30,460) |
(15,363) |
(2,167) |
(2,678) |
Currency translation differences and other |
|
(1,155) |
(794) |
(2,238) |
539 |
0 |
0 |
0 |
Cash at end of period |
|
99,726 |
50,434 |
51,019 |
21,098 |
5,735 |
3,568 |
890 |
Net (debt)/cash |
|
199,726 |
110,434 |
81,019 |
51,098 |
35,735 |
33,568 |
30,890 |
Movement in net (debt)/cash over period |
|
(47,756) |
(89,292) |
(29,415) |
(29,921) |
(15,363) |
(2,167) |
(2,678) |
Source: Company accounts, Edison Investment Research
|
|
Research: TMT
At the recent Capital Markets Day, discoverIE management confirmed the company’s strategy to grow the business through a combination of organic growth, and acquisition of design and manufacturing businesses. The integration process is designed to retain the entrepreneurial spirit of acquired businesses while taking advantage of the group balance sheet and central functions, to drive good organic growth post acquisition. Management aims to provide investors with a progressive dividend and a return of 15-20% pa.