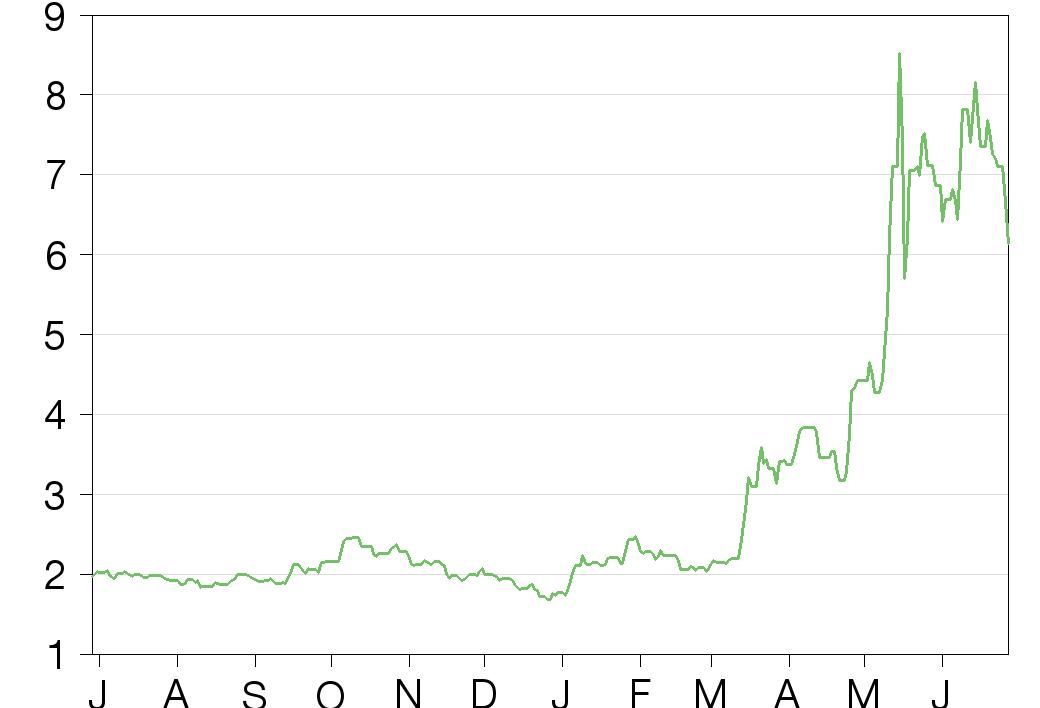
Foresight (FRSX) shares have become significantly more investible in recent months with the company listing on Nasdaq on 15 June, publication of accounts in English and the company becoming self-financing with completion of a NIS43m ($11.7m) funding round. Indeed, with $17m in cash and an estimated c NIS158m ($45m) of its warrants deep in the money, we see the potential for FRSX to exercise its $11.3m options to increase its stake in RV to 45% and build a substantial cash cushion in the coming years if these are converted. In this note we launch our dollar-based US GAAP forecasts and review recent developments.
Written by
Foresight Autonomous Holdings |
Nasdaq listing ushers in new era |
Nasdaq listing update |
Software & comp services |
29 June 2017 |
Share price performance
Business description
Next events
Analysts
|
||||||||||||||||||||||||||||||||||||||||||||||||||
Foresight (FRSX) shares have become significantly more investible in recent months with the company listing on Nasdaq on 15 June, publication of accounts in English and the company becoming self-financing with completion of a NIS43m ($11.7m) funding round. Indeed, with $17m in cash and an estimated c NIS158m ($45m) of its warrants deep in the money, we see the potential for FRSX to exercise its $11.3m options to increase its stake in RV to 45% and build a substantial cash cushion in the coming years if these are converted. In this note we launch our dollar-based US GAAP forecasts and review recent developments.
Year end |
Revenue ($m) |
EBITDA* |
PBT* |
EPS* |
DPS |
EV/revenue |
P/E |
12/16 |
0.0 |
(3.3) |
(1.5) |
(0.05) |
0.00 |
N/A |
N/A |
12/17e |
0.0 |
(3.5) |
(4.2) |
(0.04) |
0.00 |
N/A |
N/A |
12/18e |
0.2 |
(4.2) |
(4.2) |
(0.04) |
0.00 |
1,027.9 |
N/A |
12/19e |
1.6 |
(3.8) |
(2.5) |
(0.03) |
0.00 |
105.3 |
N/A |
12/20e |
11.8 |
3.4 |
8.6 |
0.06 |
0.00 |
14.2 |
29.6 |
Note: *EBITDA, PBT and EPS (diluted) are normalised, excluding amortisation of acquired intangibles, exceptional items and share-based payments.
Good progress towards milestones
Foresight continues to make strong progress in working towards its key targets. Having been invited to compete against ADAS leaders Mobileye and Bosch, in its first ADAS pilot with top-10 Chinese auto maker, JAC, FRSX appears to have produced a strong set of results leading to considerable optimism about its sales prospects. In recent months FRSX has also secured two more pilots from top-10 Chinese auto-makers and is optimistic of engaging in more trials in coming months. Associate Rail Vision’s rail ADAS product is also attracting strong interest from European rail companies, putting both companies on track for 2018 order inflows.
Rail Vision forecasts increased on price discovery
We have increased our expectations of the starting sales price for RV’s ADAS rail units, from $50k to $70k, and increased the expected data sales by 60% to $800 per annum per train. This reflects price discovery discussions by Rail Vision with potential customers that appear to support its original pricing targets.
Valuation: Market optimistic but not unrealistic
The net impact of the above-mentioned price revisions is a 4% increase in our group DCF value to NIS3.45 per share ($4.90 per ADR). We note that this is below current trading levels, but it should be noted that this valuation is on an ongoing basis, incorporating conservative growth and WACC assumptions and drawing no reference from sector M&A values. Compared with our 3% terminal growth (from 2025) and 15% WACC assumptions, the market appears to be pricing in post-2025 terminal growth and WACC of c 5% and 11%, respectively, or to put it in terms of market share targets, double-digit global ADAS market share in 2025. Taking into account the high recent M&A valuation of Mobileye and the growth potential of FRSX and Rail Vision’s technology, we see the market price as within the bounds of realistic expectation.
Excellent progress on milestones
Foresight Auto building engagement in both China and India
Foresight launched the Alpha version of its daylight ADAS software solution “Eyes-On” in January 2017 (for further details of the technology see our initiation note, Driving the autonomous revolution, 27 September 2016). Even though the company is still working towards its goal of publishing its proof of concept in Q317 (a proof of concept is a body of evidence concerning the product’s performance in a range of conditions), Foresight is already attracting pilot trials from major auto makers in its target markets.
Already being short-listed to compete against big-name players
Foresight’s first trial of its “Eyes-On” system, is with top-10 Chinese auto maker Anhui Jianghuai Auto Company Ltd (JAC). After having selected China as its first international target market and having commenced marketing efforts in Q316, Foresight was invited to take part in a pilot against well-established ADAS players Mobileye and Bosch. We understand that the trial was very successful in terms of the system accurately and quickly identifying potential dangers. If successful, the next step is likely to be JAC bringing FRSX together with its tier one suppliers with a view to integrating FRSX’s software into their ADAS products, with a view to supplying them to JAC.
|
Exhibit 1: Foresight and Rail Vision milestones |
|
|
Source: Foresight Autonomous Holdings |
FRSX believes that if all goes smoothly this could lead to its first order as soon as early 2018. JAC has annual auto production at over 1m units (1.2m capacity), engine production of over 0.5m units (0.8m capacity) and also produces vehicles for European and South Korean manufacturers for the Chinese market. JAC has a leading position in China in the export of commercial vehicles. It exported a total 59,000 vehicles of different types in 2015, principally to Latin American, Middle Eastern and Asian markets. With a leading position in Chinese exports of commercial vehicles we would expect JAC to have an interest in bringing a number of its export vehicles up to Western standards in terms of ADAS related safety features such accident and emergency braking (AEB) and lane departure warnings (LDW). Nevertheless, we believe that a major focus will be on ensuring that its top range products in both China and export markets is equipped with good quality ADAS services, as we believe that better-off Chinese consumers will increasingly expect domestic auto makers to provide similar ADAS features to those already incorporated in mid-range and more expensive vehicles in the US and Europe.
Based on our estimate of 5.5% forward camera penetration for the Chinese auto market in 2018 – still well below our forecast of 18-19% forward camera penetration of US and EU vehicle markets in 2016 – and JAC’s export orientation we see the potential for 2018 orders from JAC to exceed 55,000 units. (See our note Driving the autonomous revolution, 27 September 2016, for more details on our assumptions concerning the adoption of ADAS in China.)
Foresight has also signed similar pilot projects with a second top 10 Chinese vehicle manufacturer, with a similar timeline to the JAC contract, and believes it is close to securing a third, which should further increase the potential order inflow in 2018.
We can see considerable potential for this rapid pace of pilot agreements to lead to an increase in our unit forecasts, based on the assumption of similar order sizes for all three companies. We currently forecast unit sales in China of 9k in 2018 rising to 45k and 162k over the following two years. Nevertheless, at this stage we see it as premature to assume that the company will win the majority of the pilots given the well-established competition from companies such as Mobileye. At the same time it is possible that coordination with tier one suppliers, and delays caused by the need to introduce the ADAS features into new models, etc, may add 12-18 months to the timeline. On this basis, ahead of further concrete indications, we are keeping our existing forecasts unchanged.
Now engaging in the Indian market
With pilot programmes underway in China, FRSX has turned to marketing in the Indian sub-continent. We understand that it is undertaking increasing engagement with auto manufacturers and hopes to gain pilot agreements similar to those in the Chinese market.
FRSX’s strategy: Protection from possible slowdown in the FAV revolution
The growth of ransomware attacks and high profile infiltration of supposedly secure systems by hackers appear to have reduced public confidence in the concept of fully autonomous vehicles (FAV). A recent survey by the MIT AgeLab and New England Motor Press Association found that the younger demographic, which was more open than older people to fully autonomous vehicles a year ago, is now less trusting of the concept. We see this as important as the technology is still largely optional in vehicles, requiring auto makers to sell the product to a willing public.
At the same time the US Transportation Secretary Elaine Chao has indicated that the US government intends to revise voluntary guidelines set by the Obama administration covering self-driving cars. “Ideas that deliver safer vehicles” have been revealed to be one of the focus points of the changes.
|
Exhibit 2: Automatic emergency braking (AEB) penetration of new vehicle production (2016e) |
Exhibit 3: Global vehicle production breakdown 2015 |
|
|
|
Source: Edison Investment Research |
Source: OICA |
|
Exhibit 2: Automatic emergency braking (AEB) penetration of new vehicle production (2016e) |
|
|
Source: Edison Investment Research |
|
Exhibit 3: Global vehicle production breakdown 2015 |
|
|
Source: OICA |
While it is too early to determine how far, if at all, the public mood and government caution may affect the onset of FAVs, we believe that Foresight’s focus on developing markets such as India and China should serve as a significant shield for Foresight over the next two to three years, while the industry hopefully achieves the know-how to secure ADAS networks from attack.
This reflects our view that regardless of the security threat to FAV deployment, auto manufacturers in developing markets are likely to continue to sharply increase “catch-up” spending on features such as automatic emergency braking (AEB), forward collision warning (FCW) and lane departure warnings (LDW) in coming years. Already fitted as standard in most mid- and upper-range vehicles in the US and Europe (see Exhibit 2) and required by EU and US safety authorities in order to score top rankings for vehicles, these features have already established strong track records in preventing accidents and saving lives. Moreover the fact that the driver does not relinquish control of the vehicle with the use of these features makes them less exposed to the concerns surrounding cyber-crime. For these reasons, we expect regulators as well as consumers in emerging markets to continue to put increasing pressure on auto makers to introduce these features, giving a strong incentive to local auto makers to continue with their catch-up investments.
Exhibit 4: Foresight – key data and financial outlook
($m) |
2017e |
2018e |
2019e |
2020e |
2021e |
2022e |
2023e |
2024e |
2025e |
Chinese forward camera market (m) |
0.8 |
1.5 |
3.0 |
6.0 |
7.6 |
9.6 |
12.2 |
15.4 |
19.5 |
Foresight Chinese market share (%) |
0.0 |
0.6 |
1.5 |
2.7 |
3.4 |
4.0 |
4.7 |
5.3 |
6.0 |
Foresight Chinese stereo software, unit sales ('000) |
0 |
9 |
45 |
162 |
255 |
387 |
570 |
824 |
1,173 |
ROW forward camera market (m) |
11.7 |
16.3 |
22.3 |
30.1 |
34.4 |
39.4 |
44.9 |
51.2 |
58.1 |
Foresight ROW market share (%) |
0.0 |
0.0 |
0.3 |
0.6 |
0.9 |
1.2 |
1.4 |
1.7 |
2.0 |
Foresight ROW stereo software, unit sales ('000) |
- |
5 |
67 |
175 |
299 |
453 |
644 |
878 |
1,162 |
Foresight basic stereo software package, unit CSAs ('000) |
- |
4 |
67 |
202 |
332 |
504 |
729 |
1,021 |
1,400 |
Foresight premium stereo software package, unit CSAs ('000) |
- |
10 |
45 |
135 |
222 |
336 |
486 |
681 |
934 |
Foresight Sensor fusion unit CSAs ('000) |
- |
4 |
67 |
202 |
332 |
504 |
729 |
1,021 |
1,400 |
Foresight total unit CSAs* ('000) |
- |
18 |
179 |
540 |
886 |
1,344 |
1,943 |
2,724 |
3,735 |
Basic stereo price ($/unit) |
45.0 |
45.0 |
40.5 |
34.4 |
29.3 |
24.9 |
21.1 |
18.0 |
15.3 |
Premium stereo price ($/unit) |
90.0 |
90.0 |
81.0 |
68.9 |
68.9 |
58.5 |
49.7 |
42.3 |
35.9 |
Sensor fusion price ($/unit) |
|
|
|
150.0 |
127.5 |
108.4 |
92.1 |
78.3 |
66.6 |
Revenue |
0.0 |
0.2 |
1.6 |
11.8 |
34.9 |
34.0 |
49.3 |
64.7 |
84.9 |
Employee numbers |
29.0 |
34.8 |
45.2 |
58.8 |
66.9 |
75.3 |
84.1 |
93.2 |
96.8 |
EBITDA** |
(3.5) |
(4.2) |
(3.8) |
3.4 |
9.9 |
9.7 |
13.9 |
18.2 |
23.9 |
EBITDA margin (%) |
N/A |
N/A |
N/A |
29.1 |
28.2 |
28.4 |
28.2 |
28.2 |
28.1 |
Source: Foresight Autonomous Holdings, Edison Investment Research. Note: *CSA = commercial software agreements. **Normalised.
Rail Vision: European railways are coming to the table…
In our report of 24 April 2017, Out of the station and on the self-financing track, we discussed how Rail Vision’s technology has become an increasing driver of value for Foresight. Since then we have increased our revenue expectations for Rail Vision based on firmer pricing expectations for the ADAS units as well as the data that should be derived from the units in operation (rail infrastructure, mapping, weather, agricultural and other intelligence/monitoring). We have also increased our expectations of the company’s potential maintenance income as a percentage of initial sales cost.
Positive feedback on pricing targets
We understand that Rail Vision’s discussions with potential purchasers of its ADAS technology support a more confident view of RV’s pricing power than hitherto. In particular, a key potential customer of RV’s systems has indicated that the targeted $70-80k unit price for its ADAS system is in keeping with its pricing tolerances.
We have accordingly revised our forecasts of early unit sales prices from $50k to the lower end of RV’s target price range, at $70k. We continue to forecast a 15% pa decline in these prices between 2018 and 2020 as sales volumes increase to bring the unit price back to $51k in 2019 and $43k in 2020. Thereafter we assume a steady 5% per annum decline as the product matures and competition enters the market.
Exhibit 5: Rail Vision key assumptions and DCF valuation
$000 |
2017e |
2018e |
2019e |
2020e |
2021e |
2022e |
2023e |
2024e |
2025e |
Global powered rail unit fleet (units)* |
807,594 |
810,017 |
812,447 |
814,884 |
817,329 |
819,781 |
822,240 |
824,707 |
827,181 |
Change (%) |
0.0 |
0.3 |
0.3 |
0.3 |
0.3 |
0.3 |
0.3 |
0.3 |
0.3 |
Market for ADAS systems (% of fleet) |
0.0 |
0.0 |
0.2 |
1.1 |
1.5 |
2.0 |
2.8 |
3.7 |
5.0 |
Total ADAS market (units) |
5 |
286 |
1,523 |
9,340 |
12,444 |
16,740 |
22,686 |
30,474 |
41,046 |
Rail Vision market share (%) |
100 |
58 |
40 |
41 |
33 |
25 |
19 |
16 |
15 |
Rail Vision sales (units) |
5 |
167 |
611 |
3,861 |
4,108 |
4,143 |
4,209 |
5,018 |
6,317 |
Market for ADAS systems (% of fleet excl DB) |
0.0 |
0.0 |
0.2 |
1.0 |
1.4 |
1.9 |
2.6 |
3.6 |
5.0 |
Total ADAS market (units) |
5.0 |
286.1 |
1,522.8 |
9,340.1 |
12,444.4 |
16,740.4 |
22,685.7 |
30,474.4 |
41,045.5 |
Addressable market (%) |
N/A |
50.0 |
70.0 |
100.0 |
100.0 |
100.0 |
100.0 |
100.0 |
100.0 |
RV share of DB contracts (%) |
0.0 |
85.0 |
60.0 |
50.0 |
42.0 |
34.0 |
28.0 |
26.2 |
25.4 |
RV share of addressable market ex-DB (%) |
100.0 |
75.0 |
50.0 |
40.0 |
32.0 |
24.0 |
18.0 |
16.2 |
15.4 |
Deutsche Bahn sales (units) |
0 |
107 |
188 |
627 |
527 |
426 |
351 |
214 |
0 |
Other sales (units) |
5 |
60 |
423 |
3,234 |
3,581 |
3,717 |
3,858 |
4,805 |
6,317 |
Market share (%) |
100 |
58 |
40 |
41 |
33 |
25 |
19 |
16 |
15 |
Rail Vision sales (units) |
5 |
167 |
611 |
3,861 |
4,108 |
4,143 |
4,209 |
5,018 |
6,317 |
Sales price ($k) |
70 |
60 |
51 |
43 |
41 |
39 |
37 |
35 |
33 |
Maintenance charge ($pa/unit fitted) |
4,900 |
4,165 |
3,540 |
3,009 |
2,859 |
2,716 |
2,580 |
2,451 |
2,328 |
Big data ($pa/unit fitted) |
1,000 |
1,000 |
1,000 |
1,000 |
1,000 |
1,000 |
1,000 |
1,000 |
1,000 |
Revenues ($000) |
350 |
10,386 |
33,087 |
176,880 |
193,600 |
200,961 |
208,826 |
243,402 |
294,272 |
EBITDA |
(2,731) |
(184) |
4,963 |
26,532 |
29,040 |
30,144 |
31,324 |
36,510 |
44,141 |
EBITDA margin (%) |
(780) |
(2) |
15 |
15 |
15 |
15 |
15 |
15 |
15 |
Tax |
0 |
(1,229) |
(6,614) |
0 |
(7,473) |
(7,746) |
(9,021) |
(10,904) |
(14,150) |
Change in working capital |
(312) |
(993) |
(5,306) |
(5,808) |
(6,029) |
(6,265) |
(7,302) |
(8,828) |
(11,449) |
Total capex |
(218) |
(719) |
(662) |
(1,769) |
(1,936) |
(2,010) |
(2,088) |
(2,434) |
(2,943) |
Free cash flow |
(1,215) |
2,080 |
12,843 |
21,296 |
14,632 |
15,224 |
17,753 |
21,466 |
27,831 |
Sum of FCF ($m) |
105.5 |
FRSX stake (%) |
26.0 |
WACC |
15% |
||||
Net debt/(cash) pro forma 2016YE** ($m) |
(6.5) |
Value of FRSX stake ($m) |
29.1 |
Terminal growth rate |
3% |
||||
Rail Vision valuation ($m) |
112.0 |
Value of FRSX stake (NISm) |
106.6 |
TV/total EV |
56% |
||||
Source: Foresight Autonomous Holdings, International Union of Railways (UIC), Edison Investment Research. Note: *We believe that UIC data implying the number of PRUs in the EU, Europe and worldwide at 91k, 124k and 201k are significantly understated, reflecting large-scale privatisation in the industry and poor reporting standards. To overcome this we have applied German multiples of PRU per train km, rail passenger km and rail freight tonne km to the corresponding data for the regions less 30% and 50% discounts, respectively, to the European and worldwide figures to reflect longer trains and heavier cargos, resulting in revised PRU estimates of 121k, 340k and 808k in the EU, Europe and worldwide, respectively. **$1.1m net cash as at end-2016 plus $5.4m cash raised from equity issues in 2017.
We also understand that Rail Vision is more optimistic about the potential monetisation of data from telematics equipment once mounted on rolling stock. We set out our concerns in the our initiation note (Driving the autonomous revolution, 27 September 2016) that while there is likely to be significant demand for this data, it is not clear that owners of the rolling stock will not stake a claim for a share in such revenues, reducing the net payment to RV. We have nevertheless increased our forecast of data revenues by from $500 to $800 per train per annum, reflecting what appears to be the potential for higher data revenues than hitherto thought, but also maintaining our assumption of a potential splitting of these revenues with infrastructure owners.
Finally we have re-investigated the issue of maintenance charges, as it relates to our assumption that RV would be able to derive annual maintenance fees representing 2.5% of the cost of equipment sold. Looking into maintenance cost charges for railways on similar equipment and for safety equipment in other fields we now believe that this assumption looks overly conservative. A study by JP Baumgartner into European railway maintenance costs undertaken in 2001 estimated maintenance costs as a percentage of capital cost at 5% for signalling equipment, rising to 10% for telecoms and informatics equipment. Looking at the medical sector, the journal Radiology Business in 2012 observed that third-party maintenance costs for radiology equipment typically averaged 8.3%. Given the common ground in the need to ensure absolute best functioning of the equipment for safety reasons, we have assumed that the group is able to charge 7.0% of its unit sales price in ongoing maintenance charges, putting it at the lower end of the telecoms and informatics as well as radiology fields.
Likelihood growing of first rail orders in early 2018
Rail Vision’s marketing efforts have thrown up a wide variety of potential sales prospects in recent months. Deutsche Bahn (DB) remains the most prospective potential client by dint of the level of close work between DB and Rail Vision under the DB incubator programme, in which Rail Vision took part. Israel Railways also has a long cooperation with RV and are thought likely to be one of the earlier companies to place orders. Nevertheless, we understand from management that the company has also been demonstrating products with a major European manufacturer of rolling stock as well as a major European railway with considerable success. The latter already uses remote controls of its locomotives in its switchyards but is looking to RV’s technology to relay risk information to its central control areas to reduce accident levels.
Equity issue reduces FRSX’s stake in Rail Vision from 32% to 26%
In April 2017, Rail Vision entered into definitive agreements with several private investors pursuant to which these individuals will at some unspecified date purchase an aggregate of approximately $5m of Rail Vision’s ordinary shares at a pre-money company valuation of $20m. The investors will also receive 100% warrant coverage with an exercise price per ordinary share reflecting a pre money company valuation of $25m. The warrants are exercisable until the 18-month anniversary of the date of issuance. As a result, Foresight’s interest in Rail Vision will be approximately 26% and up to 45% on a fully diluted basis as compared with a current 32% and 48%, respectively.
The valuation of the issue at $20m shows the increase in expectations regarding Rail Vision since FRSX’s acquisition of its initial 32% stake in the company in 2016 based on a company valuation of $2.4m.
For the purposes of our DCF valuation, we treat the arrangement as if executed. On this basis we have increased the assumed cash holdings of Rail Vision by $5m to give rise to adjusted net cash pro forma 2016 of $4.2m.
This share issue is slightly dilutive for our valuation of Rail Vision as it was based on a company valuation of $20m as compared with our valuation for Rail Vision of $67.1m (NIS246m) in our last report of 24 April 2017, Out of the station and on the self-financing track. Nevertheless the increase in our underlying valuation since that date due to changes to our forecasts has led to an overall increase in our DCF valuation for FRSX’s stake in RV from $21.5m (NIS78.8m) to $29.1m (NIS106.6m).
Nasdaq listing: Broadening the investor base
Foresight shares commenced trading on Nasdaq on 15 June 2017, using the ticker FRSX. Each ADS represents five ordinary shares. As a consequence of the listing, for the first time investors will be able to read Foresight accounts in English under US GAAP accounting.
Apart from the increase in investor interest that these changes will bring, we believe it is a positive step for the company to commence reporting in dollars. This reflects our expectation that the bulk of product pricing in FRSX’s core business, at least in the next three to five years, will be largely in dollars. We also expect the group to increase its international staffing levels such that the dollar-denominated cost base will also grow.
Quarterly results
Foresight is exempt from the SEC requirement to report accounts on a quarterly basis. We understand that management is likely to use this exemption and will release results only on a half-yearly basis for the foreseeable future. The next results release is therefore expected to be its H117 accounts in August.
Financials and forecasts
US GAAP restatement: Key change treatment of listing cost
The restatement of 2016 earnings from IFRS to US GAAP resulted in a 72% and 86% reduction in reported operating losses and net losses, respectively.
■
Exclusion of listing expenses slashed reported operating losses: The US GAAP accounts excluded $9.4m in expenses relating to FRSX’s listing on the TASE from operating expenses. The largest single component of this was NIS32.7m ($8.4m) registration for trade and consultants fees.
■
Inclusion in US GAAP financial earnings of $1.8m increase in fair value of warrants: This had a further positive impact on the reported numbers, leading to an 86% reduction in reported losses to $1.9m. This resulted in a 72% reduction in reported operating losses from $13.2m to $3.8m.
After normalisation of the results losses were 41% higher at the operating and 31% higher at the net level. The most significant factors were:
■
Reduction in expenses classified as ESOP and share-based payments: This resulted in the treatment of a greater proportion of G&A costs as unexceptional. ESOP and share-based payment to consultants fell from $2.0m in the IFRS accounts to $0.4m under US GAAP. With $0.6m of these costs related to listing expenses (which we also treated as exceptional) this led to a $1.0m increase in normalised EBITDA losses to $3.3m.
■
Treatment of the $1.85m change in fair value of warrants in financial income as exceptional resulted in normalised net loss increasing $0.8m to $3.3m.
Exhibit 6: Foresight Autonomous Holdings – change in forecasts
$m |
2016 |
2016 |
Change |
2017e |
2017e |
Change |
2018e |
2018e |
Change |
2019e |
2019e |
Change |
IFRS* |
US GAAP |
% |
Old |
New |
% |
Old |
New |
% |
Old |
New |
% |
|
Revenues |
0.00 |
0.00 |
N/A |
0.00 |
0.00 |
N/A |
0.16 |
0.16 |
0.0 |
1.59 |
1.59 |
0.0 |
R&D costs |
(0.90) |
(0.90) |
(0.1) |
(1.70) |
(1.70) |
(0.0) |
(2.05) |
(2.06) |
0.0 |
(2.31) |
(2.31) |
0.0 |
Marketing and Sales |
(0.22) |
(0.22) |
(0.0) |
(0.45) |
(0.45) |
(0.3) |
(0.71) |
(0.71) |
0.0 |
(0.94) |
(0.94) |
(0.0) |
General and Admin/other |
(12.07) |
(2.63) |
(78.2) |
(1.63) |
(1.62) |
(0.5) |
(1.70) |
(1.70) |
0.0 |
(2.31) |
(2.31) |
(0.0) |
Total opex (incl. D&A) |
(13.19) |
(3.75) |
(71.5) |
(3.78) |
(3.78) |
(0.2) |
(4.47) |
(4.47) |
0.0 |
(5.56) |
(5.56) |
0.0 |
of which exceptionals (incl. share based payments) |
(10.83)** |
(0.41) |
(96.3) |
(0.25) |
(0.24) |
(0.7) |
(0.10) |
(0.10) |
0.0 |
(0.10) |
(0.10) |
(0.0) |
EBITDA normalised |
(2.37) |
(3.34) |
41.2 |
(3.52) |
(3.52) |
(0.1) |
(4.22) |
(4.20) |
(0.5) |
(3.87) |
(3.83) |
(1.0) |
EBITDA margin |
(0.22) |
N/A |
N/A |
N/A |
N/A |
N/A |
(26.59) |
(26.46) |
(0.5) |
(2.42) |
(2.40) |
(1.0) |
Operating profit normalised |
(2.38) |
(3.35) |
41.0 |
(3.54) |
(3.53) |
(0.1) |
(4.24) |
(4.22) |
(0.5) |
(3.91) |
(3.87) |
(1.0) |
Operating profit reported |
(13.20) |
(3.75) |
(71.6) |
(3.78) |
(3.78) |
(0.1) |
(4.34) |
(4.31) |
(0.5) |
(4.01) |
(3.97) |
(1.0) |
Equity accounted profit |
(0.10) |
(0.11) |
3.7 |
(0.89) |
(0.76) |
(14.0) |
(0.35) |
(0.04) |
(89.5) |
0.72 |
1.30 |
79.9 |
Financials |
(0.06) |
1.95 |
N/A |
0.06 |
0.06 |
N/A |
0.04 |
0.04 |
N/A |
0.05 |
0.05 |
N/A |
PBT normalised |
(2.54) |
(1.51) |
(40.7) |
(4.36) |
(4.23) |
(2.9) |
(4.55) |
(4.21) |
(7.4) |
(3.14) |
(2.52) |
(19.6) |
PBT reported |
(13.37) |
(1.91) |
(85.7) |
(4.60) |
(4.47) |
(2.8) |
(4.64) |
(4.31) |
(7.2) |
(3.24) |
(2.62) |
(19.1) |
Net income normalised |
(2.54) |
(3.35) |
32.0 |
(4.36) |
(4.23) |
(2.9) |
(4.55) |
(4.21) |
(7.4) |
(3.14) |
(2.52) |
(19.6) |
Net income reported |
(13.37) |
(1.91) |
(85.7) |
(4.60) |
(4.47) |
(2.8) |
(4.64) |
(4.31) |
(7.2) |
(3.24) |
(2.62) |
(19.1) |
EPS normalised basic |
(0.04) |
(0.05) |
21.6 |
(0.05) |
(0.04) |
(3.9) |
(0.05) |
(0.04) |
(12.8) |
(0.03) |
(0.03) |
(24.3) |
EPS normalised diluted |
(0.04) |
(0.05) |
21.6 |
(0.05) |
(0.04) |
(3.9) |
(0.05) |
(0.04) |
(12.8) |
(0.03) |
(0.03) |
(24.3) |
EPS reported basic |
(0.20) |
(0.03) |
(86.8) |
(0.05) |
(0.05) |
(3.8) |
(0.05) |
(0.04) |
(12.6) |
(0.03) |
(0.03) |
(23.8) |
Dividend per share |
0.00 |
0.00 |
N/A |
0.00 |
0.00 |
N/A |
0.00 |
0.00 |
N/A |
0.00 |
0.00 |
N/A |
Net debt/(cash) |
(3.75) |
(3.75) |
0.1 |
(11.15) |
(15.80) |
41.7 |
(6.57) |
(11.26) |
71.3 |
(2.23) |
(6.34) |
184.5 |
Source: Edison Investment Research. Note: *Applying average 2016 US$/NIS exchange rate of 3.8394 to reported IFRS earnings in NIS. Depreciation and amortisation included in IFRS total opex but excluded in US GAAP total opex. **Listing costs of $9.4m and ESOP and share based payments of $1.4m, being $2.0m in total net of $0.6m included in listing costs.
Forecast changes: Increased equity profits
We have not materially changed our earnings forecasts down to the operating level for the restatement to US GAAP accounts. The key area of change lies in:
■
Increased earnings expectations from Rail Vision, which is accounted for in equity profit contributions, as discussed above. This results in a reduction in equity accounted losses during 2017 and 2018 and a greater contribution to profits in 2019 (see Exhibit 6).
■
Increased estimates of cash inflows this year arising from recent increases in shares in issue, which we understand reflect recent warrant conversions that we estimate will have increased equity cash inflows by c $3.4m this year (see discussion in Balance sheet update below).
Balance sheet update
As mentioned in our update of 24 April 2017, Out of the station and on the self-financing track, FRSX raised $11.7m (NIS43m) in equity funds in Q117 from the issue of 21.0m shares, and the conversion of 0.1m warrants. Since this point, a further 5.4m warrants have been converted to shares based on the reported increase in capital on the TASE to 100.0m shares as of 27 June 2017. We calculate the funds inflow from the conversions at $5.0m (NIS17.5m), resulting in an estimated $16.5m (NIS60.6m) raised year to date, translating to an estimated $15.7m cash raise net of issue costs.
Management reported on 14 June 2017 that the group has c $17m in cash, which is consistent with our estimate of $14.5m equity raising ytd to that point and a $1.3m cash burn year to date, taking into account the $3.8m cash position at the start of the year.
We forecast FRSX to end the year with $15.8m net cash, based on the above-mentioned $15.7m year to date equity funding, $3.5m operating cash outflows during the year, $0.4m capex outlays and $0.2m inflows from interest income and forex (see Financial summary, Exhibit 11). We expect further warrant conversions to take place over the remainder of the year, if share prices remain above NIS4 per share ($5.68 per ADR), but have not incorporated this in our forecasts.
Warrants update: All FRSX’s warrants are now in the money…
In our note of 24 April we calculated that the conversion of all the in-the-money warrants would result in a NIS114m cash inflow. Since then the increase in the share price has resulted in all the company’s warrants becoming in the money, including 12.5m warrants with a NIS4 exercise price.
Since that date the conversion of 5.4m warrants has also raised NIS17.5m ($5.1m) for Foresight. We calculate that including a May issue of 4.8m more warrants, current of in-the-money warrants total 53.1m and have the potential to bring in NIS158.2m ($45.0m) on conversion.
…which supports its self-financing potential
Assuming that the share price remains above the NIS3-4 range of the bulk of the options, we believe that warrant conversions should continue to add to the group’s financial strength over the coming two to three years. With our model indicating that Foresight should be self-financing with its current resources, we see warrant conversions as potentially enabling it to exercise its options to increase its stake in RV to 45% (for an outlay of $11.3m) as well as to build a cash cushion for further expansion.
Exhibit 7: Warrants summary
Total issued |
Currently in the money* |
Exercise price (NIS)** |
Theoretical funds from conversion (NISm)*** |
|
Series A: issued 1 March 2016 exercisable for 18 months at NIS3 per warrant |
8,131,025 |
8,131,025 |
3.00 |
24.4 |
Series B: issued 1 March 2016 exercisable for 36 months at NIS4 per warrant |
12,470,837 |
12,470,837 |
4.00 |
49.9 |
Series C: Issued 1 March 2016 exercisable for 36 months at NIS3 per warrant |
1,000,000 |
1,000,000 |
3.00 |
3.0 |
Series D (NIS0.3 exercise): ESOP– vesting from 01/01/2016 in 10 equal portions quarterly over 36 months |
1,794,205 |
1,794,205 |
0.30 |
0.5 |
Series E (NIS3.0 exercise): Issued September 2016 exercisable for 36 months |
2,838,557 |
2,838,557 |
3.00 |
8.5 |
Issues since 1 January 2017 |
- |
|||
Series D (NIS1.95 exercise): ESOP: Issued 26/01/17, vesting in 12 months from 01/10/16 |
900,000 |
900,000 |
1.95 |
2.1 |
Series C (NIS1.95 exercise) Private placement to consultants: Issued 1/02/17, vesting in 12 months from 1/10/16. |
567,000 |
567,000 |
1.95 |
1.1 |
Series F ($0.8 exercise): issued March 2017 exercisable for 24 months |
19,520,514 |
19,520,514 |
2.94 |
54.9 |
Series G ($0.95 exercise): issued March 2017 exercisable for 18 months |
1,051,665 |
1,051,665 |
3.49 |
3.5 |
Series D: ESOP:Issued May 4 2017, vesting in 36 months from 01/1/17 at NIS 1.95 per share |
2,675,000 |
2,675,000 |
1.95 |
5.2 |
Series D: ESOP: to CEO and his daughter Issued May 4 2017, vesting in 36 months from 01/1/17 at NIS 2.31 per share |
2,150,000 |
2,150,000 |
2.31 |
5.0 |
Total/average (for exercise price)*** |
53,098,803 |
53,098,803 |
2.98 |
158.2 |
Source: Edison Investment Research, Foresight Autonomous Holdings. Note: *Based on share price of NIS6.17. **Applying exchange rate of NIS3.5181/US$ to dollar-based exercise prices. ***Assuming vesting and conversion of all warrants. Excludes out-of-the money warrants.
Valuation
Exhibit 8: Foresight Autonomous Holdings DCF valuation
$m |
2017e |
2018e |
2019e |
2020e |
2021e |
2022e |
2023e |
2024e |
2025e |
2026e |
2026e norm. |
|||||||||
EBITDA |
(3.8) |
(4.3) |
(3.9) |
3.3 |
9.8 |
9.6 |
13.8 |
18.1 |
23.8 |
30.0 |
30.0 |
|||||||||
EBITDA margin |
N/A |
N/A |
N/A |
N/A |
N/A |
N/A |
N/A |
N/A |
N/A |
28.0% |
28.0% |
|||||||||
Change in working capital |
0.0 |
0.0 |
(0.7) |
(1.7) |
(1.1) |
(0.4) |
(1.2) |
(1.3) |
(1.6) |
(1.8) |
(2.1) |
|||||||||
Capex |
(0.4) |
(0.4) |
(0.4) |
(0.5) |
(0.9) |
(0.7) |
(0.9) |
(1.0) |
(1.2) |
(1.5) |
(2.1) |
|||||||||
EBITDA – Capex |
(4.2) |
(4.7) |
(4.3) |
2.8 |
8.8 |
8.8 |
12.9 |
17.1 |
22.5 |
28.5 |
27.8 |
|||||||||
Tax |
0.0 |
0.0 |
0.0 |
0.0 |
0.0 |
0.0 |
(3.4) |
(4.5) |
(5.9) |
(7.7) |
(7.4) |
|||||||||
Change in working capital |
0.0 |
0.0 |
(0.7) |
(1.7) |
(1.1) |
(0.4) |
(1.2) |
(1.3) |
(1.6) |
(1.8) |
(2.1) |
|||||||||
Other non-cash items |
0.2 |
0.1 |
0.1 |
0.1 |
0.1 |
0.1 |
0.1 |
0.1 |
0.1 |
0.1 |
0.1 |
|||||||||
Free cash flow |
(3.9) |
(4.6) |
(5.0) |
1.3 |
7.9 |
8.5 |
8.5 |
11.4 |
15.1 |
19.1 |
18.4 |
|||||||||
Terminal value |
|
|
|
|
|
|
|
|
|
157.6 |
|
|||||||||
Total cash flow |
(3.9) |
(4.6) |
(5.0) |
1.3 |
7.9 |
8.5 |
8.5 |
11.4 |
15.1 |
176.7 |
|
|||||||||
Discounted cash flows |
(3.4) |
(3.5) |
(3.3) |
0.7 |
3.9 |
3.7 |
3.2 |
3.7 |
4.3 |
43.7 |
|
|||||||||
Enterprise value |
53.1 |
|
|
|
|
|
|
|
|
|
|
|||||||||
Equity valuation |
114.3 |
Net debt/(cash) end 2016 |
(3.8) |
NIS/US$ FX rate applied |
3.5181 |
|||||||||||||||
Value of Rail Vision Stake |
29.1 |
Adjustment for: |
|
|
|
WACC |
|
|
15.0% |
|||||||||||
Total group value |
143.4 |
Equity issues/merger funding 2017 YTD |
(15.7) |
Terminal growth rate |
3.0% |
|||||||||||||||
Number of shares, diluted |
146.2 |
Theoretical cash in-the-money ESOP/warrant exercise |
(41.8) |
Terminal value/EV |
73% |
|||||||||||||||
Value per ADR ($) |
4.90 |
Adjusted net debt/(cash) |
(61.2) |
|
|
|
|
|||||||||||||
Value per share (NIS) |
3.45 |
|
|
|
|
|
|
|
|
|
|
|||||||||
Source: Edison Investment Research
Increased valuation contribution from Rail Vision
We have increased our DCF valuation for FRSX (see Exhibit 8) from NIS3.30 to NIS3.45 per share ($4.90 per ADR), principally due to the increase in the DCF value of FRSX’s Rail Vision stake, as discussed above, and the inclusion in diluted capital of warrants with a high NIS exercise price (thereby boosting the nominal diluted cash balance). The key fundamental changes are:
■
Our DCF valuation for FRSX’s stake in Rail Vision has increased from $21.5m (NIS78.8m) to $29.1m (NIS102.5m) (see Exhibit 8), reflecting the increases in our valuation of RV’s business, partly offset by the expected reduction in FRSX’s stake from 32% to 26%.
■
Our enterprise valuation of FRSX’s own cash flows has increased only 1% from $52.5m (NIS192.6m) to $53.1m due to the minor changes to our forecasts arising from the switch to US GAAP numbers, as discussed above.
Sensitivity analysis
Our sensitivity analysis shows that FRSX’s current share price is supported with combinations of terminal growth of 2% and WACC of 9% or terminal growth of a higher 5% with an 11% WACC.
Exhibit 9: FRSX DCF valuation sensitivity – terminal growth value and WACC (NIS/share)
Terminal growth rate from 2025 |
||||||
2.00% |
3.00% |
4.00% |
5.00% |
6.00% |
||
WACC |
18.0% |
2.75 |
2.81 |
2.87 |
2.95 |
3.04 |
17.0% |
2.91 |
2.98 |
3.07 |
3.16 |
3.28 |
|
16.0% |
3.11 |
3.20 |
3.30 |
3.43 |
3.57 |
|
15.0% |
3.34 |
3.45 |
3.58 |
3.74 |
3.94 |
|
14.0% |
3.61 |
3.76 |
3.93 |
4.14 |
4.41 |
|
13.0% |
3.94 |
4.13 |
4.36 |
4.65 |
5.02 |
|
12.0% |
4.35 |
4.60 |
4.91 |
5.31 |
5.85 |
|
11.0% |
4.86 |
5.20 |
5.63 |
6.21 |
7.02 |
|
10.0% |
5.51 |
5.98 |
6.61 |
7.49 |
8.81 |
|
9.0% |
6.37 |
7.05 |
8.00 |
9.44 |
11.82 |
|
Source: Edison Investment Research
Addressing sensitivity to market shares, our analysis shows the market potentially factoring in scenarios of market shares equivalent to 4% in China and 10% in the rest of the world (ROW) or 25% in China and 5% in ROW. We see the latter scenario as within the bounds of reasonable expectation but it significantly exceeds our current assumptions of 6% in China and 2% ROW.
Exhibit 10: Sensitivity analysis – market share China and rest of world (RoW) (NIS/share)
2025 China market share (%) |
||||||||
2.0 |
4.0 |
6.0 |
8.0 |
10.0 |
15.0 |
25.0 |
||
2025 ROW market share (%) |
0.0 |
2.31 |
2.50 |
2.71 |
2.90 |
3.10 |
3.61 |
4.63 |
1.0 |
2.66 |
2.87 |
3.07 |
3.28 |
3.48 |
4.00 |
4.98 |
|
2.0 |
3.04 |
3.24 |
3.45 |
3.66 |
3.86 |
4.34 |
5.36 |
|
3.0 |
3.41 |
3.62 |
3.80 |
4.00 |
4.21 |
4.72 |
5.74 |
|
4.0 |
3.76 |
3.96 |
4.17 |
4.37 |
4.58 |
5.09 |
6.11 |
|
5.0 |
4.12 |
4.33 |
4.54 |
4.74 |
4.95 |
5.46 |
6.49 |
|
6.0 |
4.50 |
4.70 |
4.91 |
5.11 |
5.32 |
5.83 |
6.86 |
|
7.0 |
4.87 |
5.07 |
5.28 |
5.48 |
5.69 |
6.20 |
7.23 |
|
8.0 |
5.24 |
5.44 |
5.65 |
5.86 |
6.06 |
6.58 |
7.61 |
|
10.0 |
5.98 |
6.19 |
6.39 |
6.60 |
6.80 |
7.32 |
8.26 |
|
Source: Edison Investment Research
Exhibit 11: Financial summary
$m |
2016 |
2017e |
2018e |
2019e |
2020e |
||
Year end 31 December |
US GAAP |
US GAAP |
US GAAP |
US GAAP |
US GAAP |
||
INCOME STATEMENT |
|||||||
Revenue |
|
|
0.0 |
0.0 |
0.2 |
1.6 |
11.8 |
Cost of Sales |
N/A |
N/A |
N/A |
N/A |
N/A |
||
Gross Profit |
N/A |
N/A |
N/A |
N/A |
N/A |
||
EBITDA |
|
|
(3.3) |
(3.5) |
(4.2) |
(3.8) |
3.4 |
Normalised operating profit |
|
|
(3.3) |
(3.5) |
(4.2) |
(3.9) |
3.4 |
Amortisation of acquired intangibles |
0.0 |
0.0 |
0.0 |
0.0 |
0.0 |
||
Exceptionals |
0.0 |
0.0 |
0.0 |
0.0 |
0.0 |
||
Share-based payments |
(0.4) |
(0.2) |
(0.1) |
(0.1) |
(0.1) |
||
Reported operating profit |
(3.8) |
(3.8) |
(4.3) |
(4.0) |
3.3 |
||
Net Interest |
2.0 |
0.1 |
0.0 |
0.0 |
0.0 |
||
Joint ventures & associates (post tax) |
(0.1) |
(0.8) |
(0.0) |
1.3 |
5.2 |
||
Exceptionals |
0.0 |
0.0 |
0.0 |
0.0 |
0.0 |
||
Profit before tax (norm) |
|
|
(1.5) |
(4.2) |
(4.2) |
(2.5) |
8.6 |
Profit before tax (reported) |
|
|
(1.9) |
(4.5) |
(4.3) |
(2.6) |
8.5 |
Reported tax |
0.0 |
0.0 |
0.0 |
0.0 |
0.0 |
||
Profit after tax (norm) |
(1.5) |
(4.2) |
(4.2) |
(2.5) |
8.6 |
||
Profit after tax (reported) |
(1.9) |
(4.5) |
(4.3) |
(2.6) |
8.5 |
||
Minority interests |
0.0 |
0.0 |
0.0 |
0.0 |
0.0 |
||
Discontinued operations |
0.0 |
0.0 |
0.0 |
0.0 |
0.0 |
||
Net income (normalised) |
(3.4) |
(4.2) |
(4.2) |
(2.5) |
8.6 |
||
Net income (reported) |
(1.9) |
(4.5) |
(4.3) |
(2.6) |
8.5 |
||
Basic average number of shares outstanding (m) |
67.3 |
95.2 |
100.0 |
100.0 |
100.0 |
||
EPS – basic normalised ($) |
|
|
(0.050) |
(0.044) |
(0.042) |
(0.025) |
0.086 |
EPS – diluted normalised ($) |
|
|
(0.050) |
(0.044) |
(0.042) |
(0.025) |
0.059 |
EPS – basic reported ($) |
|
|
(0.028) |
(0.047) |
(0.043) |
(0.026) |
0.085 |
Dividend ($) |
0.00 |
0.00 |
0.00 |
0.00 |
0.00 |
||
Revenue growth (%) |
N/A |
N/A |
N/A |
905.6 |
637.6 |
||
Gross margin (%) |
N/A |
N/A |
N/A |
N/A |
N/A |
||
EBITDA margin (%) |
N/A |
N/A |
N/A |
N/A |
29.1 |
||
Normalised operating margin (%) |
N/A |
N/A |
N/A |
N/A |
28.6 |
||
BALANCE SHEET |
|||||||
Fixed assets |
|
|
1.4 |
1.0 |
1.4 |
3.0 |
8.7 |
Intangible assets |
0.0 |
0.0 |
0.0 |
0.0 |
0.0 |
||
Tangible assets |
0.1 |
0.5 |
0.9 |
1.3 |
1.7 |
||
Investments & other |
1.3 |
0.5 |
0.5 |
1.8 |
7.0 |
||
Current assets |
|
|
3.9 |
15.9 |
11.4 |
6.7 |
9.7 |
Stocks |
0.0 |
0.0 |
0.0 |
0.0 |
0.0 |
||
Debtors |
0.0 |
0.0 |
0.0 |
0.3 |
1.9 |
||
Cash & cash equivalents |
3.8 |
15.8 |
11.3 |
6.3 |
7.7 |
||
Other |
0.1 |
0.1 |
0.1 |
0.1 |
0.1 |
||
Current liabilities |
|
|
(0.5) |
(0.5) |
(0.5) |
(0.0) |
(0.0) |
Creditors |
(0.5) |
(0.5) |
(0.5) |
(0.0) |
(0.0) |
||
Tax and social security |
0.0 |
0.0 |
0.0 |
0.0 |
0.0 |
||
Short-term borrowings |
0.0 |
0.0 |
0.0 |
0.0 |
0.0 |
||
Other |
0.0 |
0.0 |
0.0 |
0.0 |
0.0 |
||
Long-term liabilities |
|
|
(0.1) |
0.0 |
0.0 |
0.0 |
0.0 |
Long-term borrowings |
0.0 |
0.0 |
0.0 |
0.0 |
0.0 |
||
Other long-term liabilities |
(0.1) |
0.0 |
0.0 |
0.0 |
0.0 |
||
Net assets |
|
|
4.7 |
16.5 |
12.2 |
9.7 |
18.4 |
Minority interests |
0.0 |
0.0 |
0.0 |
0.0 |
0.0 |
||
Shareholders' equity |
|
|
4.7 |
16.5 |
12.2 |
9.7 |
18.4 |
CASH FLOW |
|||||||
Operating cash flow before WC and tax |
(3.3) |
(3.5) |
(4.2) |
(3.8) |
3.4 |
||
Working capital |
0.8 |
0.0 |
0.0 |
(0.7) |
(1.7) |
||
Exceptional & other |
0.2 |
0.0 |
0.0 |
0.0 |
0.0 |
||
Tax |
0.0 |
0.0 |
0.0 |
0.0 |
0.0 |
||
Net operating cash flow |
|
|
(2.4) |
(3.5) |
(4.2) |
(4.5) |
1.8 |
Capex |
(0.1) |
(0.4) |
(0.4) |
(0.4) |
(0.5) |
||
Acquisitions/disposals |
(1.3) |
0.0 |
0.0 |
0.0 |
0.0 |
||
Net interest |
0.0 |
0.1 |
0.0 |
0.0 |
0.0 |
||
Equity financing |
6.3 |
15.7 |
0.0 |
0.0 |
0.0 |
||
Dividends |
0.0 |
0.0 |
0.0 |
0.0 |
0.0 |
||
Other |
1.2 |
0.0 |
0.0 |
0.0 |
0.0 |
||
Net cash flow |
3.8 |
11.9 |
(4.5) |
(4.9) |
1.3 |
||
Opening net debt/(cash) |
|
|
0.0 |
(3.8) |
(15.8) |
(11.3) |
(6.3) |
FX |
0.0 |
0.2 |
0.0 |
0.0 |
0.0 |
||
Other non-cash movements |
0.0 |
0.0 |
0.0 |
0.0 |
0.0 |
||
Closing net debt/(cash) |
|
|
(3.8) |
(15.8) |
(11.3) |
(6.3) |
(7.6) |
Source: Foresight Autonomous Holdings accounts, Edison Investment Research
|
|
FY17 results were broadly in line with year-end guidance. UK activity is increasing but, for now, we have reduced its expected contribution to our estimates. Organisational change under an updated strategy should improve the quality of earnings and, following Paul Hamer’s departure, a new management team is in place to execute this. Earnings growth prospects are somewhat greater than the current rating appears to suggest.