Nanobiotix
Written by
Nanobiotix |
Plenty of triggers in 2016 |
Company update |
Pharma & biotech |
1 February 2016 |
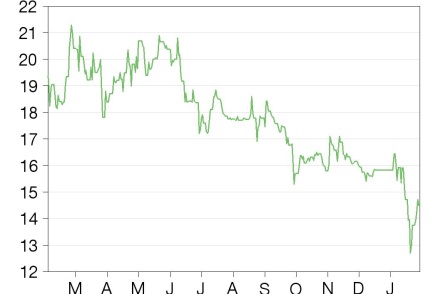
Share price performance
Business description
Next events
Analysts
Nanobiotix is a research client of Edison Investment Research Limited |
|||||||||||||||||||||||||||||||||||||||||||||||||||||||
2016 started on a positive note for Nanobiotix, with the IND for lead product NBTXR3 approved in prostate cancer. The company is running trials across six indications, some of which will deliver key data this year. Results from the pilot Phase I/II H&N cancer trial are due in H116, followed by a hallmark event – interim pivotal STS trial data – in mid-2016 and an expected CE mark approval by end 2016. Another two Phase I/II studies for liver cancers are also due to report in H216. Our rNPV increases to €527m.
Year end |
Revenue (€m) |
PBT* |
EPS* |
DPS |
P/E |
Yield |
12/14 |
2.8 |
(9.5) |
(0.75) |
0.0 |
N/A |
N/A |
12/15e |
3.9 |
(18.3) |
(1.30) |
0.0 |
N/A |
N/A |
12/16e |
7.0 |
(28.6) |
(2.01) |
0.0 |
N/A |
N/A |
12/17e |
9.2 |
(49.7) |
(3.47) |
0.0 |
N/A |
N/A |
Note: *PBT and EPS are normalised, excluding amortisation of acquired intangibles, exceptional items and share-based payments.
Positive messages start 2016
Nanobiotix has started this year on a positive note. The FDA approved the investigational new drug application for its lead product NBTXR3 to be tested in prostate cancer in addition to five indications already in clinical trials. The company also announced the expansion of preclinical research into the immuno-oncology field. In our view, the underlying rationale has sound scientific basis and worth exploring, especially since this represents a new type of application of Nanobiotix’s platform – a combination treatment involving NBTXR3-enhanced radiotherapy with an immuno-oncology drug. At this early stage (preclinical), we do not include this in our model, but can see potential for this project to progress rapidly should a partner emerge even before the project enters clinical trials.
Expecting an eventful 2016
2016 could be a pivotal year for Nanobiotix with several significant data points. The most advanced pivotal trial with soft tissue sarcoma (STS) patients will report interim results around mid-2016. This is the last step before the company can obtain a CE mark, which could then lead to initial self-pay sales in STS, while full reimbursement is likely to be sought once clinical data from the trial mature, potentially 12-18 months later. Several Phase I/II trials are also due to report results in head and neck (H&N) cancer in H116 and in liver cancer (HCC) and liver metastases in H216. In addition, we would expect news from the company’s partner PharmaEngine, which could launch trials in new indications in Asia. PharmaEngine is running pilot studies in rectal cancer on its own in Asia, and is responsible for the Asian part of the pivotal STS study.
Valuation: rNPV slightly up to €527m
Our key assumptions are largely unchanged although our overall valuation increases slightly to €527m (from €505m) after rolling forward our model to 2016 and including the last reported net cash position. We continue to believe that net cash of €20.1m as reported at end of June 2015 should be sufficient to fund operations to H216.
New indication and expansion into immuno-oncology
IND for prostate cancer approved
On 30 December 2015 the FDA approved the investigational new drug application (IND) for NBTXR3 to enter clinical trials for intermediate- and high-risk prostate cancer patients. As well as a potentially large new indication, this is Nanobiotix’s first trial to be conducted in the US. NBTXR3 is being investigated for a total of six indications including STS (Europe/Asia; Phase II/III; in partnership with PharmaEngine), liver cancers (Europe; HCC and metastases; Phase I/II), head and neck cancers (Europe; Phase I/II) and rectal cancer (pilot, run by PharmaEngine in Asia). The US trial will be a Phase I/II, open-label, non-randomised study with two treatment arms and will involve at least three US oncology centres. We expect the results to be reported around mid-2017.
We had already included this indication in our valuation, so make no changes on this announcement. Being the second leading cause of cancer death among men in the US, the indication represents a vast patient population of around 233k new cases and around 29k of deaths per year. We believe the latter is a good proxy for high-risk cases, which we use in our model. Based on this target patient market, and assuming 25% penetration of those patients who receive radiotherapy in the US and Europe, our calculated peak sales stand at €400m (we maintain our assumed price of €20k per patient). Assuming two years for the upcoming pilot trial and another three to four years for a pivotal study and regulatory filing, we estimate launch in 2021 (as previously included in our model).
New preclinical research in immuno-oncology
On 5 January 2016 Nanobiotix announced new plans to expand preclinical research into immuno-oncology. The underlying rationale is the observed effect of radiotherapy (RT) in amplifying the immune system’s response to the tumours it targets. Although this is a new area for the company, Nanobiotix will be able to use its lead product NBTXR3 as it is. The core idea behind this is a so-called immunogenic cell death (ICD) effect, which occurs after the RT. A combination regimen of RT enhanced with Nanobiotix’s NBTXR3 and used alongside immuno-oncology treatment theoretically should have a number of synergies:
■
NBTXR3 mechanistically enhances the effect of the RT without increasing the dose;
■
dual effect of standalone RT:
•
local effect: RT not only directly causes the death of cancerous cells in the specific location where it is targeted, but also changes surviving malignant cells so they become more ‘visible’ to the immune system; and
•
distant effect: due to ICD and other mechanisms, the immune system starts to recognise malignant cells and, if the cancer is spread, a distant anti-tumour effect has been also observed;
■
immunotherapy drugs enable the immune system to fight cancer and can be less effective in cases where a cancer has developed an immune-suppressive mechanism; RT can potentially counteract such mechanisms; and
■
such a multimodal treatment approach could have a greater therapeutic effect without worsening the safety profile or could even improve it if lower doses of RT or immunotherapy are required.
When RT is applied to a tumour locally, the resulting cancerous cell death activates different chain reactions that in turn amplify the immune system’s response to the tumour itself, which is also visible in distant locations away from the treatment field of RT.1 Several other mechanisms that are responsible for immunogenic potential of RT have also been described.1 For example, besides causing cell death, irradiation can alter malignant cells so they become more visible to the immune system. Such increased immunogenicity of a tumour (ie, whether a cancer is ‘visible’ to the immune system) can potentially enable a better control of the disease and has garnered significant attention in the research community over the past few decades.
K. Reynders, D. De Ruysscher (2015) Radiotherapy and immunotherapy: improving cancer treatment through synergy. Immuno-Oncology, vol 42: 67-78.
More recently, the successful advance of immuno-oncology products has given the ICD effect a whole new perspective. Immuno-oncology drugs are meant to boost a patient’s immune system to fight the cancer, which implies the efficacy of such products depends on the status of a patient’s health and the cancer’s immunogenicity. A variety of different mechanisms have been described,2 which the cancer uses to shield itself from being noticed by the immune system. This in turn lessens immuno-oncology drugs’ efficacy. Therefore a combination of immuno-oncology treatments with RT looks like a natural fit. This has been investigated in numerous retrospective studies with prospective clinical data still very scarce, although with a number of trials already underway.
C. Vanpouille-Box, et al. (2015) In situ vaccination by radiotherapy to improve responses to anti-CTLA-4 treatment. Vaccine.
The RT dose is one of the key variables that causes uncertainty in modelling combination treatment trials. Some authors suggested3 that a low RT dose could be the reason why the ICD effect was sometimes not sufficient to observe a better control of cancer. It would follow that higher doses would be beneficial, which is not always possible. Therefore, due to its mechanistic ability (see our initiation of coverage) to enhance the RT without the need to increase the dose, Nanobiotix’s NBTXR3 seems like a natural evolution of a combination treatment. In preclinical trials Nanobiotix will investigate the potential of NBTXR3-enhanced RT in combination with existing immune-oncology products. Although specific oncology products are not disclosed, in our view, some obvious examples would be anti-PD-1/PD-L1, anti-CTLA4 or CAR T-cell therapies.
C. A. Barker, M. A. Postow (2013) Combinations of radiation therapy and immunotherapy for melanoma: a review of clinical outcomes. Int J Radiation Oncol Biol Phys, Vol. 88, No. 5, pp. 986-997.
To date, RT alongside treatment with ipilimumab (Yervoy, Bristol-Myers Squibb; anti-CTLA4; approved for melanoma by the FDA in 2011) is one of the most-researched combinations in this area. Due to ipilimumab’s established clinical use, there have been numerous case studies and retrospective trials published, so this direction can provide some learning points and insights that can be leveraged to expand in other indications.
Early-stage R&D partnerships with companies involved in immuno-oncology seem plausible to us due to the win-win situation enabled by multiple synergistic interactions. Although we see the scientific rationale as sound, it is still the first step and we do not include any immune-oncology projects in our model at this stage. We will revisit this opportunity once Nanobiotix announces more details or, possibly, a new clinical project. Nevertheless, we can see potential for this project to progress rapidly should a partner emerge even before the project enters clinical trials.
Valuation
Our key assumptions are largely unchanged although our overall valuation increases slightly to €527m (from €505m) due to rolling our model forward, including last reported net cash position and updating for the currency effect. We have made only one change to our underlying product assumptions, which was postponing the initiation of the Phase I/II study in prostate cancer from H215 (our previous assumption) to H116, however, this had a minimal impact on the rNPV. Otherwise, we continue to include NBTXR3 in the various indications being pursued (STS, H&N, HCC and high-risk prostate cancer), which we assume will be commercialised alone in the US and Europe. Our combined US/EU peak NBTXR3 sales are €1.4bn. Our valuation also includes a contribution from the partnership with PharmaEngine in Asia-Pacific in indications that we believe could be pursued in this region. The breakdown of our rNPV valuation, which uses a 12.5% discount rate, is shown in Exhibit 1.
Exhibit 1: Nanobiotix rNPV valuation
Product |
Indication |
Launch |
Peak sales (€m) |
NPV (€m) |
Probability |
rNPV (€m) |
rNPV/share (€/share) |
NBTXR3 - US/Europe |
STS |
2016 |
190 |
220.7 |
60% |
127.2 |
9.0 |
Head & neck cancer |
2019 |
350 |
348.2 |
45% |
148.3 |
10.5 |
|
Liver cancers including liver mets |
2021 |
500 |
304.9 |
40% |
112.5 |
7.9 |
|
Prostate cancer |
2021 |
400 |
243.7 |
40% |
90.3 |
6.4 |
|
NBTXR3 - Asia |
STS; rectal, oesophageal, liver cancer |
2017 |
300 |
70.5 |
40% |
28.2 |
2.0 |
Net cash |
20.1 |
100% |
20.1 |
1.4 |
|||
Valuation |
|
|
|
1,208.1 |
526.6 |
37.2 |
Source: Edison Investment Research
Financials
We have updated our financial forecasts to include H115 results. Nanobiotix reported H115 revenues of €1.7m, of which €1.4m was R&D tax credits. Due to increasing activities, operating costs grew to €9.5m (€6.1m R&D spend and €3.4m G&A and other costs) and largely met our expectations; operating loss came in at €7.9m. We have increased our estimate for R&D tax credits in 2015, which is the main driver behind our upped revenue forecast for 2015. Our longer-term projections were only fine-tuned, thus the impact on 2016 and 2017 estimates is minimal.
We continue to believe that net cash at end of June 2015 of €20.1m (consisting of €24.8m gross cash together with debt of €4.7m of OSEO grants and bank loans) should be sufficient to fund operations to H216, assuming development continues in all planned indications. Further cash requirements could be met by the €10m commitment from Capital Ventures International (CVI) as part of the end 2014 private placement, in addition to €14m warrants that expire at the end of June 2016. We do not include the future €10m commitment or the exercise of the warrants in our financial forecasts, but for the purpose of our model we include illustrative long-term debt of €8m to finance operations until the end of 2016. Similarly, in 2017 our model estimates an additional €54m is needed, assuming that all projects can be fully supported with this.
Exhibit 2: Changes to forecasts
|
|
|
|
|
|
|
|
|
€ millions |
2015e |
2015e |
% change |
2016e |
2016e |
% change |
2017e |
% change |
|
Old |
New |
|
Old |
New |
|
|
|
Revenue |
2.717 |
3.868 |
+42% |
6.808 |
6.959 |
+2% |
9.178 |
+0% |
Gross Profit |
2.717 |
3.868 |
+42% |
6.664 |
6.815 |
+2% |
8.887 |
+0% |
Research and development |
(16.000) |
(18.000) |
N/M |
(26.000) |
(24.000) |
N/M |
(37.000) |
N/M |
Selling, general and administration |
(4.531) |
(4.531) |
N/M |
(11.383) |
(11.383) |
N/M |
(21.598) |
N/M |
EBITDA |
(17.619) |
(18.558) |
N/M |
(30.518) |
(28.433) |
N/M |
(49.564) |
N/M |
Operating Profit |
(17.813) |
(18.662) |
N/M |
(30.719) |
(28.568) |
N/M |
(49.711) |
N/M |
Profit Before Tax |
(17.444) |
(18.291) |
N/M |
(30.727) |
(28.568) |
N/M |
(49.720) |
N/M |
EPS (€) |
(1.23) |
(1.30) |
N/M |
(2.16) |
(2.01) |
N/M |
(3.47) |
N/M |
Source: Edison Investment Research
Exhibit 3: Financial summary
€'000s |
2010 |
2011 |
2012 |
2013 |
2014 |
2015e |
2016e |
2017e |
||
December |
IFRS |
IFRS |
IFRS |
IFRS |
IFRS |
IFRS |
IFRS |
IFRS |
||
PROFIT & LOSS |
||||||||||
Revenue |
|
|
1,135 |
1,360 |
971 |
1,595 |
2,771 |
3,868 |
6,959 |
9,178 |
Cost of Sales |
0 |
0 |
0 |
0 |
0 |
0 |
(143) |
(291) |
||
Gross Profit |
1,135 |
1,360 |
971 |
1,595 |
2,771 |
3,868 |
6,815 |
8,887 |
||
Research and development |
(4,186) |
(5,213) |
(4,312) |
(6,026) |
(8,076) |
(18,000) |
(24,000) |
(37,000) |
||
EBITDA |
|
|
(3,935) |
(5,030) |
(5,006) |
(7,945) |
(9,312) |
(18,558) |
(28,433) |
(49,564) |
Operating Profit (before amort. and except.) |
(4,092) |
(5,213) |
(5,146) |
(8,171) |
(9,605) |
(18,661) |
(28,566) |
(49,709) |
||
Intangible Amortisation |
(4) |
(14) |
(7) |
(8) |
(15) |
(2) |
(2) |
(2) |
||
Exceptionals |
0 |
0 |
0 |
0 |
0 |
0 |
0 |
0 |
||
Other |
(0) |
(0) |
(22) |
0 |
2 |
0 |
0 |
0 |
||
Operating Profit |
(4,096) |
(5,227) |
(5,175) |
(8,179) |
(9,618) |
(18,662) |
(28,568) |
(49,711) |
||
Net Interest |
11 |
(19) |
(77) |
34 |
141 |
372 |
(1) |
(9) |
||
Profit Before Tax (norm) |
|
|
(4,081) |
(5,233) |
(5,223) |
(8,137) |
(9,464) |
(18,289) |
(28,566) |
(49,718) |
Profit Before Tax (reported) |
|
|
(4,086) |
(5,247) |
(5,252) |
(8,145) |
(9,477) |
(18,291) |
(28,568) |
(49,720) |
Tax |
0 |
0 |
(79) |
18 |
(173) |
0 |
0 |
0 |
||
Profit After Tax (norm) |
(4,081) |
(5,233) |
(5,324) |
(8,118) |
(9,635) |
(18,289) |
(28,566) |
(49,718) |
||
Profit After Tax (reported) |
(4,086) |
(5,247) |
(5,331) |
(8,126) |
(9,650) |
(18,291) |
(28,568) |
(49,720) |
||
Average Number of Shares Outstanding (m) |
6.8 |
7.7 |
8.2 |
10.8 |
12.9 |
14.1 |
14.2 |
14.3 |
||
EPS - normalised (€) |
|
|
(0.60) |
(0.68) |
(0.65) |
(0.75) |
(0.75) |
(1.30) |
(2.01) |
(3.47) |
EPS - normalised and fully diluted (€) |
|
(0.60) |
(0.68) |
(0.65) |
(0.75) |
(0.75) |
(1.30) |
(2.01) |
(3.47) |
|
EPS - (reported) (€) |
|
|
(0.60) |
(0.68) |
(0.65) |
(0.76) |
(0.75) |
(1.30) |
(2.01) |
(3.47) |
Dividend per share (€) |
0.0 |
0.0 |
0.0 |
0.0 |
0.0 |
0.0 |
0.0 |
0.0 |
||
Gross Margin (%) |
100.0 |
100.0 |
100.0 |
100.0 |
100.0 |
100.0 |
97.9 |
96.8 |
||
EBITDA Margin (%) |
N/A |
N/A |
N/A |
N/A |
N/A |
N/A |
N/A |
N/A |
||
Operating Margin (before GW and except.) (%) |
N/A |
N/A |
N/A |
N/A |
N/A |
N/A |
N/A |
N/A |
||
BALANCE SHEET |
||||||||||
Fixed Assets |
|
|
682 |
580 |
485 |
545 |
1,549 |
2,887 |
3,067 |
3,335 |
Intangible Assets |
2 |
7 |
0 |
9 |
10 |
10 |
10 |
10 |
||
Tangible Assets |
638 |
511 |
416 |
468 |
1,292 |
2,629 |
2,810 |
3,078 |
||
Investments |
42 |
63 |
69 |
68 |
247 |
247 |
247 |
247 |
||
Current Assets |
|
|
7,253 |
2,333 |
13,539 |
6,894 |
35,505 |
20,398 |
3,521 |
7,546 |
Stocks |
0 |
0 |
0 |
0 |
0 |
0 |
0 |
24 |
||
Debtors |
0 |
0 |
1 |
1 |
2 |
2 |
4 |
5 |
||
Cash |
649 |
899 |
12,361 |
5,002 |
32,986 |
17,879 |
1,000 |
5,000 |
||
Other |
6,604 |
1,434 |
1,177 |
1,891 |
2,517 |
2,517 |
2,517 |
2,517 |
||
Current Liabilities |
|
|
(1,539) |
(1,415) |
(2,160) |
(3,282) |
(4,424) |
(5,861) |
(2,591) |
(2,581) |
Creditors |
(1,349) |
(1,119) |
(1,800) |
(3,051) |
(4,103) |
(5,611) |
(2,341) |
(2,393) |
||
Short term borrowings |
(190) |
(295) |
(360) |
(231) |
(321) |
(250) |
(250) |
(188) |
||
Long Term Liabilities |
|
|
(505) |
(573) |
(1,167) |
(975) |
(2,314) |
(3,880) |
(18,770) |
(72,541) |
Long term borrowings |
(474) |
(527) |
(1,072) |
(875) |
(2,002) |
(3,552) |
(11,438) |
(65,208) |
||
Other long term liabilities |
(31) |
(46) |
(95) |
(100) |
(312) |
(328) |
(7,332) |
(7,332) |
||
Net Assets |
|
|
5,891 |
926 |
10,697 |
3,182 |
30,315 |
13,543 |
(14,773) |
(64,240) |
CASH FLOW |
||||||||||
Operating Cash Flow |
|
|
(4,157) |
(4,862) |
(3,786) |
(6,837) |
(8,573) |
(16,739) |
(24,449) |
(49,284) |
Net Interest |
13 |
(7) |
(119) |
(18) |
(48) |
372 |
(1) |
(9) |
||
Tax |
0 |
0 |
0 |
0 |
0 |
(43) |
0 |
0 |
||
Capex |
(245) |
(60) |
(45) |
(196) |
(963) |
(174) |
(313) |
(413) |
||
Acquisitions/disposals |
0 |
0 |
1 |
4 |
0 |
(2) |
(2) |
(2) |
||
Financing |
8,011 |
15 |
14,807 |
14 |
36,532 |
0 |
0 |
0 |
||
Dividends |
0 |
0 |
0 |
0 |
0 |
0 |
0 |
0 |
||
Net Cash Flow |
3,621 |
(4,914) |
10,858 |
(7,034) |
26,947 |
(16,586) |
(24,765) |
(49,708) |
||
Opening net debt/(cash) |
|
|
(396) |
15 |
(76) |
(10,929) |
(3,895) |
(30,663) |
(14,077) |
10,688 |
HP finance leases initiated |
0 |
0 |
0 |
0 |
0 |
0 |
0 |
0 |
||
Other |
(4,033) |
5,006 |
(5) |
0 |
(179) |
0 |
0 |
0 |
||
Closing net debt/(cash) |
|
|
15 |
(76) |
(10,929) |
(3,895) |
(30,663) |
(14,077) |
10,688 |
60,396 |
Source: Nanobiotix accounts, Edison Investment Research. Note: In 2016 long-term liabilities include our future fund-raising estimate of €8m. This could potentially be met by commitments from the strategic US investor, CVI. In 2017 long-term liabilities include additional €54m is needed, assuming all clinical trials progress as planned.
|