Last close As at 05/08/2026
—
— 0.00 (0.00%)
Market capitalisation
—
Research: Investment Companies
Seneca Global Income & Growth Trust (SIGT) has a value-based, multi-asset investment policy, aiming to achieve an average annual return of at least CPI +6% over the course of a normal business cycle, and to grow the annual dividend at least in line with UK inflation. SIGT’s manager believes that active asset allocation can add value and can mitigate the effects of a stock market downturn. In anticipation of an expected global economic downturn in 2020, it has been reducing risk by gradually lowering equity exposure, while adding to specialist assets. The manager expects to continue to reduce the trust’s equity position as the end of the bull market approaches. The shorter-term tactical asset allocation (TAA) to equities of 56% compares to the longer-term strategic asset allocation (SAA) of 60%. The trust has a positive investment track record; it has outperformed its blended benchmark over one, three and five years and since the change of investment mandate in January 2012.
Seneca Global Income & Growth Trust |
Moving to a more defensive position |
Investment trusts |
1 March 2018 |
Share price/discount performance
Three-year share price perf.
Gearing
Analysts
|
|||||||||||||||||||||||||||||||||||||||||||||||||||||||||||||||||||||||||||||||||||||
Seneca Global Income & Growth Trust (SIGT) has a value-based, multi-asset investment policy, aiming to achieve an average annual return of at least CPI +6% over the course of a normal business cycle, and to grow the annual dividend at least in line with UK inflation. SIGT’s manager believes that active asset allocation can add value and can mitigate the effects of a stock market downturn. In anticipation of an expected global economic downturn in 2020, it has been reducing risk by gradually lowering equity exposure, while adding to specialist assets. The manager expects to continue to reduce the trust's equity position as the end of the bull market approaches. The shorter-term tactical asset allocation (TAA) to equities of 56% compares to the longer-term strategic asset allocation (SAA) of 60%. The trust has a positive investment track record; it has outperformed its blended benchmark over one, three and five years and since the change of investment mandate in January 2012.
12 months ending |
Total share price return (%) |
Total NAV return (%) |
Blended benchmark* (%) |
FTSE All-Share (%) |
FTSE All-World (%) |
31/01/14 |
13.9 |
9.0 |
3.5 |
10.1 |
9.2 |
31/01/15 |
7.1 |
7.9 |
3.5 |
7.1 |
17.6 |
31/01/16 |
8.1 |
0.1 |
3.6 |
(4.6) |
(0.7) |
31/01/17 |
18.2 |
18.7 |
3.5 |
20.1 |
33.9 |
31/01/18 |
14.0 |
13.2 |
6.5 |
11.3 |
13.4 |
Source: Thomson Datastream. Note: 12-month discrete total returns. *Blended benchmark is three-month Libor +3% to 6 July 2017 and CPI +6% thereafter. Past performance is not necessarily a guide to future performance.
Investment strategy: Multi-asset investing
SIGT is managed by Seneca Investment Managers (SIML), which operates a team-based approach to construct a diverse portfolio of assets that are trading at a discount to their perceived intrinsic values, as well as third-party funds that apply a similar approach. Compared to the longer-term allocations, SIGT is currently tactically underweight UK equities and fixed income, market weight overseas equities, and overweight specialist assets.
Market outlook: Above-average equity valuations
Both UK and global equities have performed very strongly since early 2016, as investors have focused on growth in corporate earnings, due to a synchronised improvement in the global economy. Multiples have expanded, meaning equity valuations are now looking relatively full. On a forward P/E basis, both developed and emerging market equities are trading at a c 15% premium to their 10-year averages. With this backdrop in mind, investors may find appeal in a fund of attractively valued assets, offering a diverse income stream.
Valuation: Trading at a small premium
SIGT adopted a discount control mechanism (DCM) in August 2016, since when its shares have traded close to NAV. The current 1.4% premium to cum-income NAV compares to the range of discounts over the last three, five and 10 years of 0.6% to 6.1%. The trust aims to increase annual dividends at least in line with the rate of UK inflation; SIGT’s prospective yield is 3.6%.
Exhibit 1: Trust at a glance
Investment objective and fund background |
Recent developments |
|||||||||||||||||||||||||||||||||||||||||||||||||||||||||
SIGT’s objective is to achieve net returns in excess of CPI +6% per annum over the course of a typical investment cycle, with low volatility. It also aims to grow aggregate annual dividends at least in line with CPI, through investment in a multi-asset portfolio including UK and overseas equities, fixed-income securities and specialist assets (including property). |
■ 22 February 2018: Third interim dividend of 1.58p announced, 3.9% higher year-on-year. ■ 4 December 2017: Six-month results ending 31 October 2017. NAV TR +6.1% versus benchmark TR +3.4%. Share price TR +6.1%. |
|||||||||||||||||||||||||||||||||||||||||||||||||||||||||
Forthcoming |
Capital structure |
Fund details |
||||||||||||||||||||||||||||||||||||||||||||||||||||||||
AGM |
July 2018 |
Ongoing charges |
1.61% |
Group |
Seneca Investment Managers |
|||||||||||||||||||||||||||||||||||||||||||||||||||||
Final results |
June 2018 |
Net gearing |
4.3% |
Managers |
Seneca team |
|||||||||||||||||||||||||||||||||||||||||||||||||||||
Year end |
30 April |
Annual mgmt fee |
0.90% of market cap up to £50m, 0.65% above £50m |
Address |
10th Floor Horton House, Exchange Flags, Liverpool L2 3YL |
|||||||||||||||||||||||||||||||||||||||||||||||||||||
Dividend paid |
Sep, Dec, Mar, Jun |
Performance fee |
None |
|||||||||||||||||||||||||||||||||||||||||||||||||||||||
Launch date |
August 2005 |
Trust life |
Indefinite (subject to vote) |
Phone |
+44 (0)151 906 2461/2475 |
|||||||||||||||||||||||||||||||||||||||||||||||||||||
Continuation vote |
Annual |
Loan facilities |
£14m three-year rolling (£7m drawn) |
Website |
||||||||||||||||||||||||||||||||||||||||||||||||||||||
Dividend policy and history (financial years) |
Share buyback policy and history (financial years) |
|||||||||||||||||||||||||||||||||||||||||||||||||||||||||
SIGT aims to grow annual dividends at least in line with the rate of CPI. |
A discount control mechanism was introduced at July 2016 AGM, effective 1 August 2016. |
|||||||||||||||||||||||||||||||||||||||||||||||||||||||||
|
|
|||||||||||||||||||||||||||||||||||||||||||||||||||||||||
Shareholder base (at 31 January 2018) |
Portfolio distribution by capital and income generation (at 31 January 2018) |
|||||||||||||||||||||||||||||||||||||||||||||||||||||||||
|
|
|||||||||||||||||||||||||||||||||||||||||||||||||||||||||
Top five holdings by asset category (at 31 January 2018) |
||||||||||||||||||||||||||||||||||||||||||||||||||||||||||
|
||||||||||||||||||||||||||||||||||||||||||||||||||||||||||
Source for charts and tables above: SIGT, Edison Investment Research, Morningstar
Market outlook: Equity valuations look pretty full
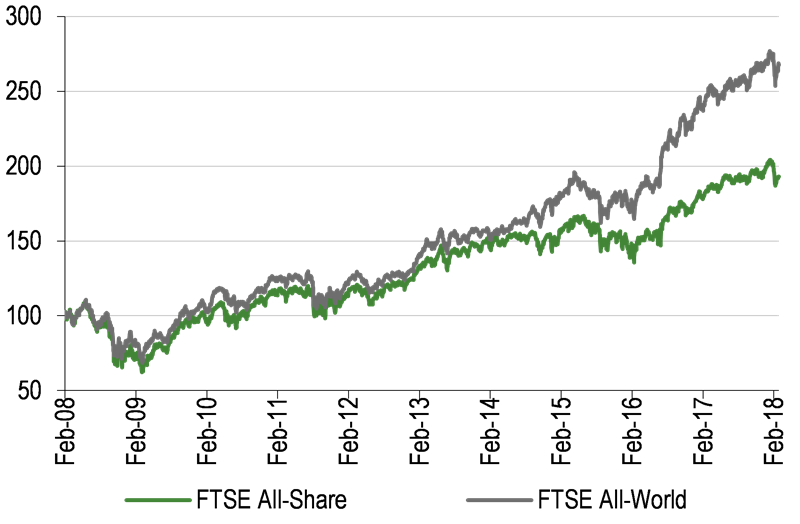
Despite recent volatility in global stock markets, both UK and to a greater extent, global equities have performed very strongly since early 2016, as shown in Exhibit 2 (LHS). Investors have shaken off political concerns during the period and instead focused on the synchronised improvement in the global economy, which has fed through into robust corporate earnings growth. There have also been continued fund flows into equities due to the low returns available on other asset classes such as government bonds or cash. As a result, equity valuations are looking somewhat full. On a forward P/E multiple basis, both developed and emerging market equities are trading at a c 15% premium to their averages over the last 10 years (Exhibit 2, right-hand table). Of the major developed markets, the US and Europe are looking the least attractive, trading at a c 20% premium to their 10-year averages and are towards the high end of the ranges over this period. Against this valuation backdrop, investors may be interested in a fund with a value approach that generates an income stream from a broad range of assets.
|
Exhibit 2: Equity performance and valuations |
|||||||||||||||||||||||||||||||||||||||||||
Performance of UK and global equities in £ terms (last 10 years) |
Datastream indices forward P/E valuations (x) |
||||||||||||||||||||||||||||||||||||||||||
|
|
||||||||||||||||||||||||||||||||||||||||||
|
Source: Thomson Datastream, Edison Investment Research. Note: Data as at 27 February 2018. |
|||||||||||||||||||||||||||||||||||||||||||
Fund profile: ‘Multi-Asset Value Investing’
Founded as the Taverners Trust and managed by Aberdeen Asset Management, the trust became the Midas Income & Growth Trust in August 2005. In March 2014, the trust’s investment manager was purchased by Seneca Asset Managers Limited. The fund management business was renamed Seneca Investment Managers Limited (SIML) and the trust itself was renamed Seneca Global Income & Growth Trust, highlighting its diverse mandate. SIML is a multi-asset specialist, with a focus on value. The investment process is transparent and team based, and the portfolio investments are straightforward.
SIGT aims to generate income and capital growth, with low volatility, via investment in a diversified portfolio of UK and overseas equities, fixed income and specialist assets (speciality financial, infrastructure, property and private equity). In 2012, its mandate was changed, aiming to improve the trust’s returns. The strategic asset allocation to overseas equities was increased (by 10pp to 25%) and fixed income was reduced (by 10pp to 15%). The dividend was rebased to what was considered to be a sustainable level, the fee structure was simplified and an annual continuation vote was introduced. The benchmark was changed from a nominal return of 8% per year to three-month Libor +3% pa. However, more recently, the board considered that this hurdle was too low. Following shareholder approval at the July 2017 AGM, the performance benchmark was increased to CPI +6% pa. SIML believes that this level of average annual returns can be achieved, over the course of a typical business cycle, by a combination of strategic asset allocation, active management and the use of gearing (minus costs). While there may be shorter periods when asset returns are lower, which will make it difficult for SIML to generate investment returns in excess of the benchmark, the managers believe that over the course of a typical business cycle (when total real returns from equities and bonds over the entire cycle are in line with, or above, long-term averages), the new benchmark is more appropriate. There has been no change in investment process following the change in benchmark.
SIML adopts a team-based approach. Following the retirement of Alan Borrows at the end of 2017, the company is looking to further grow the investment team. Currently, there are four investment professionals, who each contribute to the management of SIGT’s portfolio. Each team member has specific research responsibilities, acting as research specialist in a particular area:
■
Peter Elston – asset allocation (strategic and tactical);
■
Mark Wright – direct investment in UK equities;
■
Tom Delic – overseas equities and fixed income fund selection; and
■
Richard Parfect – specialist assets.
Elston has a portfolio oversight role, which includes process implementation, and cash and cash flow management. However, given SIML’s team-based investment approach, he has only limited discretion to move away from the target portfolio, which has been proposed by the research specialists and agreed by the team.
SIGT has broad investment limits in place. At the time of investment, up to 10% of the portfolio may be in any one company, up to 5% in a single security and up to 7.5% in unquoted securities (currently c 3% – AJ Bell Holdings). Up to 25% may be held in cash (currently c 3%). Gearing of up to 25% of NAV is permitted; at end-January 2018 gross gearing was 8.9%. Annual portfolio turnover is c 33%, which takes into account tactical asset allocation shifts, as well as activity within the individual asset classes.
The fund managers: Seneca team
The managers’ view: Reducing risk within the portfolio
Asset allocation specialist, Elston, adopts a business cycle analytical framework for tactical asset allocation. He says that in each of the four stages of the business cycle (expansion, peak, recession and recovery) the relative performance of individual asset classes tends to follow a similar pattern. For example, equities tend to perform better in the recession and recovery phases and relatively poorly in the peak phase. Each of the four phases of the business cycle is characterised by different economic growth, inflation and central bank monetary policy trends. Elston says that the US is well into the expansion phase and the UK is heading that way, while Europe and Japan are still in recovery phase, although also heading for expansion. In regions where inflation is nudging up against central bank inflation targets, such as the US and the UK, short-term interest rates are starting to rise. However, absolute interest rate increases have been slower than in previous cycles and due to the extremely low starting point, peak interest rates in this business cycle are likely to be lower than normal.
SIGT has been gradually reducing equity exposure, and therefore portfolio risk, in anticipation of a global economic slowdown in 2020 due to tighter monetary policy. Elston uses a driving analogy to explain this strategy – a careful driver brakes ahead of a bend, rather than when it is reached. For 2018, he believes that equity returns can be respectable, but he expects them to be lower than long-term averages. The US yield curve remains upwardly sloping, rather than being inverted, suggesting to him an economic downturn is not imminent. Commenting on stock market volatility early in 2018, Elston compares it to seismic activity that undergoes dormant periods, then builds up pressure and is explosive when released. He says that stock markets have appreciated in an orderly fashion and volatility has been very low versus history. However, Elston does not believe the recent correction was the start of a protracted bear market, which normally occurs when yield curves are inverted and inflation is above central bank targets; this is not currently the case. He says that significant investment reallocations away from equities and credit will only emerge when positive real interest rates make returns on cash look more attractive. In the meantime, the managers expect to continue to reduce equity exposure as the end of the bull market approaches.
Asset allocation
Investment process: Multiple income streams
SIML’s investment style is ‘Multi-Asset Value Investing’. The managers focus on high-quality assets, which are trading at a discount to their perceived intrinsic value, as well as third-party funds that employ a similar philosophy. SIGT’s resulting portfolio comprises UK and overseas equities, fixed income and specialist assets. Specialist assets include: speciality finance – leasing, mortgages, global reinsurance and direct lending to small- and medium-sized enterprises; infrastructure – renewable energy and proven social infrastructure; commercial and residential property – with a focus on UK secondary and niche markets and private equity – AJ Bell Holdings and private equity funds of funds. The managers employ a long-term strategic asset allocation (SAA), which is based on the expected long-term returns from individual asset classes. They seek to add value by using a shorter-term tactical asset allocation (TAA), to take advantage of relative valuation differences between asset classes, as well as from individual stock and fund selection. SIML’s investment approach is team-based – potential new holdings are proposed by the relevant research specialist and discussed within the team. Any changes to the portfolio have to be agreed by a majority, which acts as a risk control. Each asset allocation position and each holding has a target weighting. Actual portfolio exposures can vary modestly from the target, as successful positions are allowed to run or when the managers wait for income to be captured; however, any variances are limited and closely monitored.
Exhibit 3: Asset allocation ranges, long-term core and tactical asset allocations (TAA)
% |
Asset allocation range |
Core asset allocation (SAA) |
TAA end-January 2018 |
UK equities |
15-60 |
35 |
31.0 |
Overseas equities |
10-40 |
25 |
25.0 |
Total equities |
25-85 |
60 |
56.0 |
Fixed income |
0-40 |
15 |
9.2 |
Specialist |
0-50 |
25 |
31.5 |
Cash |
0-10 |
0 |
3.3 |
Total |
100 |
100 |
100.0 |
Source: Seneca Global Income & Growth Trust
Current portfolio positioning
Exhibit 3 shows SIGT’s current TAA versus SAA by asset class. Since our last report was published in October 2017, the managers have continued to reduce risk by lowering the trust’s TAA equity exposure by a further 3pp (2pp from UK and 1pp from Japanese equities), with the majority of proceeds reinvested into specialist assets. Within the UK, 1pp reduction came from the sale of drinks distributor and retailer Conviviality, which had performed very strongly, while the other 1pp came from taking profits across a range of UK equity positions. Within Japan, the Goodhart Michinori Japan Equity Fund and the CC Japan Income & Growth Trust were both reduced.
The equity TAA is now underweight the SAA by 4pp (56% versus 60%). The underweight exposure is in UK equities, while the TAA to overseas equities is now in line with the SAA, having previously been overweight. Within overseas equities, SIGT is overweight Asia Pacific ex-Japan, global funds and Europe ex-UK, underweight North America (where it has no exposure, with the last position having been sold in August 2017) and emerging markets, and neutral weight Japan. The trust retains an underweight fixed income exposure, with no exposure to developed markets government debt, which the managers consider to be unattractively valued. SIGT is overweight all subsectors within specialist assets: specialist financial, infrastructure, property and private equity.
|
Exhibit 4: Distribution of equity and non-equity investments at 31 January 2018 |
|
Geographic distribution of equity investments (55% of portfolio) |
Analysis of non-equity investments (45% of portfolio) |
|
|
|
Source: Seneca Global Income & Growth Trust, Edison Investment Research. Note: Numbers subject to rounding. |
|
Exhibit 4 shows SIGT’s actual portfolio at end-January 2017, broken down by equity (55%) and non-equity exposure (45%). UK equity exposure is direct, with a focus on mid-cap companies. These firms are often under-researched, which can lead to their shares being mispriced. SIML says that over the long term, mid-cap companies tend to outperform – since 1998, the mid-cap FTSE 250 index has beaten the large-cap FTSE 100 index by c 5pp per annum. An ideal UK equity investment would be a relatively undervalued company, generating strong cash flow, which can support a growing dividend stream. SIGT’s individual UK equity position sizes are broadly similar (1.3% to 1.7% of the portfolio). Overseas equity exposure is via funds with a value bias and a high active share that offer the potential for outperformance of their underlying benchmarks. (Active share is a measure of how a portfolio differs from its benchmark, with 100% representing no commonality and 0% full index replication.) Fixed income funds are selected on the basis of a strong credit analysis framework being in place. Specialist assets provide a differentiated, diversified income stream, with the manager using them to lower portfolio volatility as well as enhance returns. SIGT’s current specialist asset exposure is split: specialist financial 10.9%, property 8.3%, infrastructure 6.7% and private equity 5.1%. These positions typically yield 5-8%.
Recent changes to the portfolio include, within UK equities, the purchase of Babcock International and the sale of Conviviality and Intermediate Capital (both on valuation grounds). Babcock is a support services company, which the manager believes has been unjustifiably tarnished with the same brush as peers such as Capita, Interserve and Mitie, which have all issued profit warnings. As a result, Babcock is now offering a very attractive dividend yield of c 4.5%, which is its highest level in the last decade. The manager believes that the company is fundamentally different to its peers, operating in industries with high barriers to entry, under long-term, higher-margin contracts. Within overseas equities, there is a new position in the Samarang Asian Prosperity Fund. It is a pan-Asian small cap fund, where the manager aims to exploit valuation anomalies in companies that are under-researched by both the buy and the sell side. Ediston Property Investment Company has been added to specialist assets within SIGT’s portfolio. It has a focused portfolio of 15 properties, which are primarily out-of-town retail warehouses. Ediston’s manager undertakes portfolio management activities, such as refurbishments, aiming to increase the rental and capital values of the properties.
Performance: Long-term outperformance
SIGT aims to outperform its benchmark with low volatility returns. Since the mandate change in January 2012 up to end-January 2018, the trust’s annualised NAV volatility is significantly lower than the FTSE All-Share index (8.2% versus 12.9%) and lower than the average annualised volatility of its peers in the AIC Flexible Investment sector (8.9%) (volatility data from SIML).
|
Exhibit 5: Investment trust performance to end-January 2018 |
|
Price, NAV and benchmark total return performance, one-year rebased |
Price, NAV and benchmark total return performance (%) |
|
|
|
Source: Thomson Datastream, Edison Investment Research. Note: Since change of mandate (SC) is from 18 January 2012. Benchmark is an absolute return of 8% per year until 18 January 2012, three-month Libor +3% to 6 July 2017 and CPI +6% thereafter. Performance figures for periods of more than one year are annualised. |
|
Exhibit 5 shows SIGT’s absolute returns. Over the last 12 months, its NAV and share price total returns of 13.2% and 14.0% respectively are meaningfully ahead of the blended benchmark’s 6.5% total return. The largest contribution to outperformance over the period was UK equity stock selection. SIGT’s relative returns are shown in Exhibit 6, the trust has outperformed its blended benchmark in both NAV and share price terms over one, three and five years and since the change in mandate on 18 January 2012. SIGT has also outperformed the FTSE All-Share index over all of these periods.
|
Exhibit 6: Share price and NAV total return relative performance |
|||||||
|
Three months |
Six months |
One year |
Three years |
Five years |
Since change of mandate |
|
Price relative to blended benchmark |
(2.5) |
(2.3) |
7.0 |
27.5 |
45.1 |
72.2 |
|
NAV relative to blended benchmark |
(2.5) |
(2.7) |
6.3 |
17.8 |
29.3 |
46.6 |
|
Price relative to FTSE All-Share |
(1.4) |
(1.7) |
2.4 |
14.3 |
18.3 |
25.6 |
|
NAV relative to FTSE All-Share |
(1.4) |
(2.1) |
1.7 |
5.6 |
5.4 |
6.9 |
|
Price relative to FTSE All-World |
(2.6) |
(3.9) |
0.5 |
(3.4) |
(8.2) |
(1.2) |
|
NAV relative to FTSE All-World |
(2.6) |
(4.3) |
(0.1) |
(10.7) |
(18.2) |
(15.9) |
|
|
Source: Thomson Datastream, Edison Investment Research. Note: Data to end-January 2018. Geometric calculation. Since change of mandate is from 18 January 2012. Blended benchmark is an absolute return of 8% per year until 18 January 2012, three-month Libor +3% to 6 July 2017 and CPI +6% thereafter. |
|||||||
|
Exhibit 7: SIGT NAV total return vs blended benchmark and FTSE All-Share total return since change of mandate, rebased |
|||||||
|
|||||||
|
Source: Thomson Datastream, Edison Investment Research |
|||||||
Discount: Effective discount control mechanism
Since adopting a discount control mechanism (DCM) on 1 August 2016, SIGT’s share price has traded close to NAV (Exhibit 8). PATAC, the trust’s company secretary and administrator, purchases shares when they are trading at a small discount to NAV and issues shares when they are trading at a small premium. This addresses investors’ concerns that they may suffer from a widening discount and provides liquidity for investors wishing to purchase shares. Since the DCM was introduced, 1.0m shares have been repurchased at a cost of £1.7m and 7.5m shares have been issued raising £13.1m (gross, see Exhibit 1). The execution of both purchases and regular sales of shares highlights SIGT’s board’s commitment to the DCM process. Renewed annually, SIGT has the authority to buy back up to 14.99% and issue up to 20% of outstanding shares. Issuance above the prevailing NAV is modestly accretive to existing shareholders and a higher number of shares in issue should improve liquidity, while growing the trust spreads costs over a larger asset base.
SIGT is currently trading at a 1.4% premium to cum-income NAV, which compares to the range of a 2.2% premium to a 1.7% discount over the last 12 months. The current premium is larger than the 1.0% premium over the last 12 months and compares with the average discounts over the last three, five and 10 years of 0.6%, 3.0% and 6.1% respectively.
|
Exhibit 8: Share price premium/discount to NAV (including income) over three years (%) |
|
|
Source: Thomson Datastream, Edison Investment Research. Note: Negative values indicate a discount, positive values a premium. |
Capital structure and fees
SIGT is a conventional investment trust with one class of share. There are currently 46.4m ordinary shares outstanding and no shares are held in treasury. The trust increased its debt facility with Royal Bank of Scotland from £7m to £11m in July 2016, at a rate of Libor +0.7%, to support the introduction of the DCM. The facility expired at the end of October 2017 and was replaced by a £14m three-year rolling facility at a rate of Libor +1.1%. The higher facility has not been fully utilised as the manager does not believe that asset markets offer sufficient value to increase SIGT’s level of gearing. At end-January 2018, gross gearing was 8.9%.
Following the change in investment mandate in January 2012, SIGT’s annual management fee was reduced from 1.0% to 0.9% per year and the performance fee was removed. Subsequently, fees have been further reduced. SIML is now paid 0.90% of SIGT’s market cap per year up to £50m and 0.65% per year above £50m; the fee is allocated 50:50 to capital and income. Ongoing charges of 1.61% in FY17 were consistent with FY16 (1.60%).
Dividend policy and record
SIGT pays quarterly interim dividends in September, December, March and June. The trust aims to grow total annual dividends at least in line with CPI. Since the dividend was rebased in January 2012, the first three interim dividends have been equal, with a higher fourth interim dividend serving as an indicator of the first three quarterly dividends to be paid in the following year. The 6.14p annual dividend in FY17 was 3.5% higher than in FY16 and dividend cover in FY17 was c 1.1x. It was the fourth consecutive year where the uplift was higher than CPI, with a 4.0% compound annual growth rate over this period. Based on the declared first, second and third interim dividends of 1.58p, barring unforeseen circumstances, the FY18 annual dividend should be at least 6.32p, which is a prospective dividend yield of 3.6%.
Peer group comparison
Since 1 January 2017, SIGT has been a member of the AIC Flexible Investment sector; its classification was changed from the AIC Global Equity Income sector to better reflect its focus on both income and capital growth rather than just income.
Exhibit 9: AIC Flexible Investment sector at 27 February 2018*
% unless stated |
Market cap £m |
NAV TR |
NAV TR |
NAV TR |
Discount (ex-par) |
Ongoing charge |
Net gearing |
Dividend yield (%) |
Seneca Global Inc & Growth Trust |
80.6 |
8.2 |
28.7 |
52.3 |
2.3 |
1.6 |
104 |
3.6 |
Aberdeen Diversified Inc & Growth |
400.8 |
5.1 |
0.4 |
15.1 |
(5.8) |
0.2 |
107 |
4.8 |
Capital Gearing |
216.6 |
0.7 |
19.6 |
25.2 |
2.3 |
0.9 |
100 |
0.5 |
Establishment Investment Trust |
43.0 |
11.9 |
30.5 |
24.4 |
(18.1) |
1.2 |
100 |
2.9 |
F&C Managed Portfolio Growth |
70.5 |
14.1 |
35.6 |
69.1 |
1.9 |
1.0 |
100 |
0.0 |
F&C Managed Portfolio Income |
58.6 |
6.6 |
22.0 |
47.2 |
3.8 |
1.1 |
98 |
4.1 |
Henderson Alternative Strategies |
112.2 |
5.0 |
25.5 |
18.8 |
(13.0) |
1.1 |
100 |
1.6 |
Invesco Perp Select Balanced |
9.6 |
4.5 |
13.9 |
25.8 |
(0.5) |
1.2 |
100 |
0.0 |
Miton Global Opportunities |
76.7 |
14.9 |
54.1 |
78.3 |
1.3 |
1.3 |
100 |
0.0 |
New Star Investment Trust |
80.3 |
6.8 |
34.4 |
43.0 |
(25.0) |
0.9 |
100 |
0.7 |
Personal Assets |
871.9 |
0.4 |
17.8 |
21.0 |
0.9 |
1.0 |
100 |
1.4 |
RIT Capital Partners |
3,041.8 |
5.4 |
27.7 |
56.2 |
6.1 |
0.7 |
107 |
0.0 |
Ruffer Investment Company |
401.8 |
(0.7) |
9.0 |
19.1 |
1.8 |
1.2 |
100 |
0.8 |
Tetragon Financial |
860.7 |
(4.9) |
44.7 |
81.7 |
(40.6) |
1.8 |
100 |
5.3 |
Average |
451.8 |
5.6 |
26.0 |
41.2 |
(5.9) |
1.1 |
101 |
1.8 |
SIGT rank in sector (14 funds) |
8 |
4 |
6 |
5 |
4 |
2 |
3 |
4 |
Source: Morningstar, Edison Investment Research. Note: *Performance at 26 February 2018. TR=total return. Net gearing is total assets less cash and equivalents as a percentage of net assets.
Following the exit of Syncona and the addition of the two F&C Managed Portfolio trusts, there are now 14 trusts in the AIC Flexible Investment sector. They have a variety of different mandates, which means that only a broad comparison can be made, as shown in Exhibit 9. SIGT’s NAV total returns are above average over one, three and five years, ranking fourth, sixth and fifth in each period respectively. SIML highlights that the trust’s NAV returns have been achieved with lower annualised volatility than the peer group average (see page 6). SIGT is trading at the fourth highest premium in the sector and has the second highest ongoing charge. Its level of gearing is above average and it has a competitive dividend yield, which is 1.8pp higher than the peer group average.
The board
SIGT’s board has three directors who are all non-executive and independent of the manager. The directors and their dates of appointment are: Richard Ramsay (2 April 2013 and chairman since 3 September 2013), Ian Davis (1 November 2004 and chairman of the audit committee since 15 December 2004), and James McCulloch (2 January 2015). Their backgrounds are in investment banking, corporate finance, and private client investment and portfolio management.
Glossary
CPI
The Consumer Price Index, which is a measure of UK inflation.
Discount control mechanism
A discount control mechanism (DCM) will usually involve a trust buying back its own shares in the market and either cancelling them or holding them in treasury to be reissued when demand is stronger.
Gearing
Investment companies frequently employ a moderate level of borrowing to buy additional investments to increase returns when they appreciate. The risk is that gearing magnifies losses if the investments fall in value.
Libor
The London Interbank Offered Rate is a reference interest rate widely used in financial markets as a basis for lending rates or an indication of the return available on cash.
Multi-asset fund
Multi-asset funds have a mandate to invest across different asset classes such as equities, fixed income, property and other specialist areas. The fund manager will vary exposures according to market conditions, seeking to optimise the balance of risk and reward.
OECD
The Organisation for Economic Co-operation and Development. It is a group of 35 member countries that discuss and develop economic and social policy.
Ongoing charge
This is a measure of the regular, recurring costs of running an investment company expressed as a percentage of the NAV.
P/E ratio
A price-to-earnings ratio, which is a valuation measure of a company’s share price relative to its annual net income per share.
Premium/discount to net asset value (NAV)
The net asset value of a company, including an investment company, is the value of its assets less liabilities. Depending on a range of factors, including the market’s assessment of the prospects for a company or appetite for yield, its shares may trade at a price above the NAV, at a premium, or at a discount.
Strategic asset allocation
Strategic asset allocation can be thought of as the broad allocation to each asset class that would be expected to achieve the investment performance objective over time. For example, a simple multi-asset fund might have a strategic asset allocation of 60% global equities and 40% global bonds. Given an understanding of how global equities and global bonds would be expected to behave over the longer term, one would have an understanding of how the fund should behave over the longer term as a result of exposure to bonds and equities in the proportions mentioned.
Tactical asset allocation
Tactical asset allocation is generally used in conjunction with strategic asset allocation. Tactical asset allocation refers to decisions to deviate from time to time from strategic asset allocation. Using the example cited, this might mean a decision to have only 50% in equities rather than the strategic allocation of 60% because one might have a slightly negative view on the outlook for equities.
Typical investment cycle
A typical investment cycle is defined as one in which various asset classes produce total real returns over the entire cycle that are broadly in line with their historic long-term average real returns.
Volatility
This is a term used to describe the frequency and severity with which the price of an investment goes up and down.
Yield (income)
The amount of income you receive in monetary terms will be equivalent to the dividend per share multiplied by the number of shares you own. This is usually expressed annually as a percentage based on the investment’s market value.
|
|
Investment Companies
Research: TMT
Strong demand across all markets and geographies, combined with market share gains and the recent Comdel acquisition, have resulted in record revenues and earnings for XP in FY17. Expanding its product range to include high voltage and RF power solutions has widened the company’s addressable market and gives XP the opportunity to support its customers in the development of more complex solutions. With strong cash flow generation and access to debt, XP has the resources to fund growth, whether through internal product development or via acquisition.