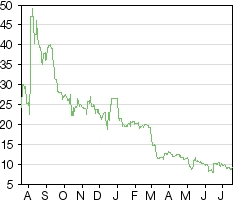
The company has announced a further positive financing development with the securing of $100m of Super Senior Debt with a coupon of 7.5% that provides a significant reduction in interest payable on around 10% of outstanding gross debt. The recent trading updates are less positive and we have reduced our expectations accordingly. In addition, we still await a launch date for HYLAS 4 which is a crucial factor in attaining the required revenue and cash flow development. The fair value for the equity falls to 93p from 109p previously with our longer-term assumptions unaltered.
Written by
Avanti Communications |
More favourable debt terms |
Additional financing secured and trading update |
Fixed satellite services |
18 July 2017 |
Share price performance
Business description
Next events
Analysts
Avanti Communications is a research client of Edison Investment Research Limited |
|||||||||||||||||||||||||||||||||||||||||||||||
The company has announced a further positive financing development with the securing of $100m of Super Senior Debt with a coupon of 7.5% that provides a significant reduction in interest payable on around 10% of outstanding gross debt. The recent trading updates are less positive and we have reduced our expectations accordingly. In addition, we still await a launch date for HYLAS 4 which is a crucial factor in attaining the required revenue and cash flow development. The fair value for the equity falls to 93p from 109p previously with our longer-term assumptions unaltered.
Year end |
Revenue ($m) |
PBT* |
EPS* |
DPS |
P/E |
Yield |
06/15 |
85.2 |
(73.3) |
(61.4) |
0.0 |
N/A |
N/A |
06/16 |
82.8 |
(67.0) |
(49.3) |
0.0 |
N/A |
N/A |
06/17e |
62.0 |
(108.3) |
(70.2) |
0.0 |
N/A |
N/A |
06/18e |
92.0 |
(130.1) |
(79.9) |
0.0 |
N/A |
N/A |
Note: *PBT and EPS are normalised, excluding amortisation of acquired intangibles, exceptional items and share-based payments.
Super Senior Debt issue a positive sign
The $100m 7.5% Super Senior Debt line has been secured from HPS Investment Partners, who have $39bn of assets under management, and this is a positive for Avanti. Not only is a notable investor showing confidence in the model, but the terms also provide a significant interest saving on 10% of the outstanding gross debt. As previously, we assume all the available payments in kind (PIKs) are enacted which will take gross debt to almost $1bn. Improved terms for existing bondholders to compensate for the loss of seniority will offset this to a degree, but the liquidity provided will further underpin Avanti as it prepares for the major capacity addition that should be provided by HYLAS 4. We now expect a launch around the turn of the year although a final date has yet to be confirmed.
Trading remained difficult through H2
The Q3 trading statement showed continued weak revenue development and this persisted in Q4 despite a modest sequential improvement. We believe this was due to customer uncertainty during the refinancing which should now unwind. The order intake of c $50m in H217 is encouraging, although the outcome for FY17 means revenue momentum into FY18 is below expectations. The additional liquidity provided by the debt facility and the deferral of the covenant calculation alleviate the immediate pressures. Given no date has yet been announced for the launch of the HYLAS 4 satellite, which we now expect to be delivered to the company in Q118, we have delayed revenue generation to reflect later commissioning.
Valuation: Decline reflects near-term shortfall
The reduction in near-term expectations leads us to reduce our fair value calculation for the equity, and the value remains sensitive to levels of revenue attainment both to the upside and the downside. It currently stands at 93p but remains highly geared to performance. Greater clarity should be afforded by contributions from the large HYLAS 4 capacity when it finally comes on stream.
Positive debt finance secured
Avanti has secured a $100m line of 7.5% Super Senior Debt from HPS investment Partners maturing in 2020. The debt will replace the $50m tranche of delayed PIK Toggle Notes due for issue and add $50m of additional liquidity, more than compensating for weaker than anticipated trading in the current half year.
While the coupon on the debt of 7.5% represents a significant and very welcome reduction on the existing bonds, some of the terms on the issued notes have been revised in the bondholders’ favour. The new debt represents around 10% of the face value of the gross debt that is expected to be in issue when all of the PIK tranches have been made. In addition, the date of the initial covenant calculation has been deferred to March 2018 from June 2017, relieving the immediate concern caused by weaker current trading than we had expected.
Weak trading has persisted, but order flow is improving
Q3 results announced on 31 May 2017 showed no progress, with uncertainty pending the strategic review and refinancing in H117 persisting amongst customers. As confirmed in the pre-close statement, the weak trading has continued in the final quarter, with a modest sequential revenue improvement to c $17m.
One encouraging sign has been a pick-up in order intake in recent months with almost $50m of new orders signed since April. Recent contract wins have been varied in size and scope but we highlight the major recent announcements below:
■
A contract for an undisclosed customer in the mobility market to fill gaps in network coverage and support peak demand. The mobility market covers satellite connectivity for ships, aircraft and land transportation and is normally provided by specialist service providers. It now forms Avanti’s fifth focus vertical market.
■
A contract from the European Regional Development Fund (ERDF) to supply rural broadband access to small businesses across Cornwall with speeds of up to 40Mbps, worth up to £1.2m.
■
Lead on an €8.3m research and innovation contract to integrate satcom as an intrinsic part of 5G networks, including the provision of live demonstration testbeds in the UK, Germany and Finland. The project’s 16 partners include leading global businesses such as Thales Alenia Space, Airbus Defence and Space, SES and BT.
■
A new $21m three-year contract to supply services to an existing government customer in Africa.
We would expect order intake in FY18 to return to a more normal flow of contracts through the year, with the potential to accelerate as HYLAS 4 enters service.
While the sales run rate picked up in the final quarter, Avanti exits the current year with a reduced sales momentum, which has ramifications for FY18 sales. In addition, as the timing of the HYLAS 4 launch has yet to be announced, we assume this will be later than previously expected. The satellite is due for delivery shortly, and a launch in early 2019 looks increasingly likely. We have reduced our FY18 forecast accordingly. With the largely fixed cost base, the EBITDA declines and cash flow performances reflect this lower outcome very directly, although once again we do expect stronger progression once HYLAS 4 is commissioned.
Exhibit 1: Revisions to estimates
Year to June |
Sales ($m) |
EBITDA($m) |
Net debt ($m) |
||||||
Old |
New |
% chg |
Old |
New |
% chg |
Old |
New |
% chg |
|
2017e |
84.2 |
62.0 |
-26 |
12.3 |
(11.1) |
N/M |
746.2 |
756.1 |
+1 |
2018e |
127.4 |
92.0 |
-28 |
67.6 |
12.8 |
-81 |
905.6 |
971.6 |
+7 |
Source: Edison Investment Research estimates
Reduction in near-term cash generation
Our DCF-based fair value calculation decline reflects the worse than expected near-term performances. The value is highly geared to the revenue generation of the company as the drop through to operational cash flow is very high. In this regard FY18 should prove to be a better indicator of the progress of the model compared to the highly disrupted FY17. However, it will be FY19 before we see the first full year contribution of the HYLAS 4 potential. Until then, now that the debt lines are secured, the focus will be to fill all of the satellite capacities and we await progress on this front. The risks to both the upside and the downside remain, and are highly sensitive to performance.
At present we have maintained our long-term assumptions and expectations in our DCF calculation, including the elimination of HYLAS 1 and 2 contributions from the terminal value. Our adjusted DCF model now returns an equity value of 93p, and the sensitivity to terminal growth rates and WACC is reflected in the table below.
Exhibit 2: Adjusted DCF calculation sensitivity to WACC and terminal growth
WACC |
8% |
9% |
10% |
11% |
12% |
13% |
14% |
15% |
Terminal growth rate |
||||||||
0% |
237 |
186 |
140 |
98 |
61 |
27 |
-4 |
-33 |
1% |
278 |
218 |
166 |
119 |
78 |
41 |
7 |
-23 |
2% |
333 |
260 |
198 |
145 |
99 |
58 |
21 |
-11 |
3% |
410 |
315 |
240 |
177 |
124 |
78 |
38 |
2 |
4% |
526 |
393 |
295 |
218 |
155 |
102 |
57 |
18 |
Source: Edison Investment Research estimates
While our fair value is multiples of the current share price this reflects the current market concerns as to whether Avanti can execute on its strategy, and that with such a large debt burden the risk that the equity could be crushed if it does not. Management success in delivering the planned cash flows should be a crucial factor in alleviating the worries and reducing the discount. We would point out that we have maintained relatively cautious assumptions with respect to HYLAS 4 fill rates, once commissioned, as well as on the existing satellite fleet. In these circumstances the fair value remains sensitive to both the upside and the downside not just on WACC and terminal growth expectations, but also to cash generation levels achieved.
Exhibit 3: Financial summary
$m |
2014 |
2015 |
2016 |
2017e |
2018e |
||
Year end 30 June |
IFRS |
IFRS |
IFRS |
IFRS |
IFRS |
||
PROFIT & LOSS |
|||||||
Revenue |
|
|
65.6 |
85.2 |
82.8 |
62.0 |
92.0 |
Cost of Sales |
(86.7) |
(83.8) |
(86.0) |
(88.6) |
(90.7) |
||
Gross Profit |
(21.1) |
1.4 |
(3.2) |
(26.6) |
1.3 |
||
EBITDA |
|
|
(7.7) |
12.5 |
4.6 |
(11.1) |
12.8 |
Operating Profit (before amort. and except.) |
|
|
(53.9) |
(32.6) |
(39.8) |
(55.8) |
(34.1) |
Intangible Amortisation |
(0.2) |
(0.2) |
(0.2) |
(0.2) |
(0.2) |
||
Exceptionals |
5.3 |
0.0 |
0.0 |
0.0 |
0.0 |
||
Other |
0.0 |
0.0 |
0.0 |
0.0 |
0.0 |
||
Operating Profit |
(48.7) |
(32.8) |
(40.0) |
(56.0) |
(34.3) |
||
Net Interest |
(38.9) |
(40.5) |
(27.0) |
(52.3) |
(95.8) |
||
Profit Before Tax (norm) |
|
|
(93.0) |
(73.3) |
(67.0) |
(108.3) |
(130.1) |
Profit Before Tax (FRS 3) |
|
|
(87.7) |
(73.3) |
(67.0) |
(108.3) |
(130.1) |
Tax |
0.0 |
0.0 |
(2.2) |
0.0 |
0.0 |
||
Profit After Tax (norm) |
(92.0) |
(73.3) |
(69.2) |
(108.3) |
(130.1) |
||
Profit After Tax (FRS 3) |
(87.7) |
(73.3) |
(69.2) |
(108.3) |
(130.1) |
||
Average Number of Shares Outstanding (m) |
107.4 |
119.0 |
139.4 |
153.5 |
162.1 |
||
EPS - normalised (c) |
|
|
(85.2) |
(61.4) |
(49.3) |
(70.2) |
(79.9) |
EPS - normalised fully diluted (c) |
|
|
(85.2) |
(61.4) |
(49.3) |
(70.2) |
(79.9) |
EPS - (IFRS) (c) |
|
|
(81.2) |
(61.4) |
(49.3) |
(70.2) |
(79.9) |
Dividend per share (c) |
0.0 |
0.0 |
0.0 |
0.0 |
0.0 |
||
Gross Margin (%) |
-32.1 |
1.6 |
-3.9 |
-42.9 |
1.4 |
||
EBITDA Margin (%) |
-11.7 |
14.7 |
5.6 |
-17.9 |
13.9 |
||
Operating Margin (before GW and except.) (%) |
-82.1 |
-38.2 |
-48.1 |
-90.1 |
-37.0 |
||
BALANCE SHEET |
|||||||
Fixed Assets |
|
|
645.9 |
721.5 |
804.5 |
851.5 |
932.5 |
Intangible Assets |
14.0 |
11.0 |
10.8 |
10.6 |
10.4 |
||
Tangible Assets |
610.9 |
691.0 |
775.1 |
822.3 |
903.5 |
||
Investments |
21.1 |
19.5 |
18.6 |
18.6 |
18.6 |
||
Current Assets |
|
|
235.7 |
160.3 |
137.8 |
87.6 |
65.4 |
Stocks |
1.7 |
2.6 |
1.9 |
1.4 |
1.9 |
||
Debtors |
21.0 |
17.8 |
39.3 |
27.9 |
28.9 |
||
Cash |
195.3 |
122.2 |
56.4 |
33.2 |
10.0 |
||
Other |
17.6 |
17.7 |
40.2 |
25.2 |
24.6 |
||
Current Liabilities |
|
|
(44.4) |
(36.6) |
(86.1) |
(43.9) |
(40.5) |
Creditors |
(39.9) |
(31.9) |
(82.8) |
(43.9) |
(40.5) |
||
Short term borrowings |
(4.5) |
(4.7) |
(3.3) |
0.0 |
0.0 |
||
Long Term Liabilities |
|
|
(527.7) |
(540.5) |
(654.7) |
(802.0) |
(994.4) |
Long term borrowings |
(512.4) |
(523.7) |
(642.0) |
(789.3) |
(981.7) |
||
Other long term liabilities |
(15.3) |
(16.8) |
(12.7) |
(12.7) |
(12.7) |
||
Net Assets |
|
|
309.4 |
304.7 |
201.5 |
93.2 |
(36.9) |
CASH FLOW |
|||||||
Operating Cash Flow |
|
|
5.1 |
(8.1) |
(22.7) |
(9.0) |
25.9 |
Net Interest |
(39.0) |
(54.4) |
(67.4) |
(32.5) |
(28.0) |
||
Tax |
0.0 |
0.0 |
(2.2) |
0.0 |
0.0 |
||
Capex |
(25.8) |
(102.0) |
(95.7) |
(66.9) |
(119.6) |
||
Acquisitions/disposals |
0.0 |
0.0 |
0.0 |
0.0 |
0.0 |
||
Financing |
(7.6) |
80.0 |
5.3 |
(58.8) |
(93.9) |
||
Dividends |
0.0 |
0.0 |
0.0 |
0.0 |
0.0 |
||
Net Cash Flow |
(67.3) |
(84.5) |
(182.7) |
(167.2) |
(215.5) |
||
Opening net debt/(cash) |
|
|
254.4 |
321.7 |
406.2 |
588.9 |
756.1 |
HP finance leases initiated |
0.0 |
0.0 |
0.0 |
0.0 |
0.0 |
||
Other |
(0.0) |
0.0 |
0.0 |
0.0 |
(0.0) |
||
Closing net debt/(cash) |
|
|
321.7 |
406.2 |
588.9 |
756.1 |
971.6 |
Source: Company reports; Edison Investment Research estimates
|
|
Research: Industrials
Solid State continues to make progress towards management’s goal of doubling revenues over the next five years. It delivered pre-exceptional profit growth from continuing businesses of 6% during FY17. The record order book combined with investment during FY17 in both the Manufacturing and Distribution divisions shows management is driving organic growth to complement its successful acquisition programme.