MedicX Fund
MedicX Fund |
Rent roll and NAV progress |
Q1 NAV update |
Real estate |
18 February 2016 |
Share price performance
Business description
Next events
Analysts
MedicX Fund is a research client of Edison Investment Research Limited |
|||||||||||||||||||||||||||||||||||||||||||||||
Further property acquisitions and continued yield compression has seen the Fund’s rent roll and NAV per share continue to increase in Q116. The recent FY15 results showed strong underlying profit growth with operational gearing on target. A revised management fee will limit cost increases going forward. MXF is a long-term investor in a portfolio of modern primary care properties in the UK and the Republic of Ireland on long, quasi government-backed leases. Similar duration fixed-rate debt at modest (c 50%) gearing underpins secure cash flows to support the c 7% prospective yield.
Year end |
Revenue |
PBT* |
EPS* |
DPS |
Yield |
EPRA NAV/ |
DCF/share |
09/14 |
29.5 |
10.7 |
3.1 |
5.80 |
6.7 |
65.4 |
93.4 |
09/15 |
33.7 |
13.4 |
3.7 |
5.90 |
6.8 |
70.8 |
94.9 |
09/16e |
36.2 |
14.2 |
3.8 |
5.95 |
6.9 |
70.5 |
95.3 |
09/17e |
40.0 |
15.4 |
4.1 |
6.00 |
7.0 |
71.2 |
N/A |
Note: *PBT and EPS are normalised, excluding asset revaluations, performance fees and exceptional items. **Investment Adviser’s DCF value/share. 09/16 DCF value is as last reported at 31/12/15.
Earnings, dividends and cover forecast to grow
The strong 2015 full year results were slightly ahead of our forecasts for earnings and NAV. Total income grew 14.2% and underlying expenses 10.1% (reflecting the reduced performance fee) to produce a 55% increase in underlying EPRA earnings. £23.6m of new investment commitments have been made in FY16 year to date, including further investment in Ireland where investment yields are c 200bp higher than in the UK. The revised management fee agreement should drive further improvement in operational profitability. We have revised our forecasts for FY16 (underlying PBT forecast +4%) and have introduced a 2017 forecast for the first time. Dividend cover increased in FY15 and we forecast further improvement.
UK and Irish growth opportunities
The medium- to long-term growth outlook is good in the UK and the smaller Irish market. Both have ageing populations with growing healthcare needs, an underinvested primary healthcare estate and general acceptance of the need for more integrated primary care services in the community. Both require modern, purpose-built, flexible premises of the sort in which the Fund invests. In the UK, there is financial and political support for NHS planning that should soon see an acceleration of new development spending. Ireland offers investment opportunities at attractive investment yields, while the HSE estate strategy is delivered.
Valuation: Secure dividends with increasing cover
MedicX has locked in secure long-term cash flows and, barring unforeseen circumstances, a dividend of 5.95p is indicated for FY16 (5.9p in FY15). With portfolio growth, dividend cover is building; we forecast 69% in FY17. The Investment Adviser’s DCF value per share of the Fund’s predictable cash flows is currently 95.3p where EPRA NAV is 71.2p (as at 31 December 2015).
Summary of recent results and developments
MedicX Fund has recently issued a quarterly update for the three months ending 31 December 2015, following FY15 results for the year to September 2015 released in December. The FY15 results showed a strong increase in profits on both a reported and an underlying basis, excluding valuation gains, with asset additions supporting revenue growth well in excess of cost increases. A further reduction in the management fee structure took effect from the beginning of FY16. The Fund has continued to add assets despite competition for high-yielding primary care assets driving continued growth in property values. As expected, dividend cover is showing improvement and has been given greater emphasis, with the Fund signalling that dividends will continue to grow, albeit at a reduced rate. The Fund sees good prospects for growth in Ireland, where yield differentials are materially ahead of those that can be earned in the UK. The Fund made its first acquisition in Ireland in June 2015 by way of forward funding for a new primary healthcare facility at an estimated total cost of €10.1m. A second forward funding agreement of c €8.0m was announced in December 2015.
■
The investment portfolio increased from £502.9m to £553.5m during the year to 30 September 2015 (FY15). The average lease term was 15.8 years and the average age of the properties was 7.2 years. Including the most recent acquisition announced on 10 February, the portfolio has increased from 143 properties at the FY15 year end to 150 properties: 143 operational and fully let and seven under construction (all but one to be completed in CY16). The annualised rent roll has now reached £36.4m. Committed investment during FY15 was £27.4m at a cash yield of 5.87%. £23.4m has been committed on new acquisitions since the FY15 year end. During FY15, five properties previously under construction, representing a commitment of £22.6m, were completed and delivered within budget. The Investment Adviser has access to a strong pipeline of potential future acquisitions in both the UK and Ireland, with c £90m of assets in solicitors’ hands or under negotiation.
■
Rents receivable grew 17% (or by £4.7m) to £32.8m in FY15. Measured by tenant type, income for FY15 was 89% reimbursed by the NHS, while an additional 8% was represented by pharmacy operations that are co-located with medical centres. Of the FY15 total, just 1% was from Ireland.
■
Rental growth is currently modest, driven by effectively upward-only reviews. 73% of the FY15 rent roll was subject to open market rent reviews at the instigation of the landlord, 22% is RPI linked and 5% is subject to fixed uplifts. Open market reviews remain challenging and the average 0.9% uplift on these reviews in Q1 is similar to uplift achieved during FY15. As inflation has declined, the average uplift on RPI-linked reviews has reduced to 1.88% in Q1 compared with 2.6% in FY15. The average portfolio increase was 1.1% on £2.4m of rent reviews agreed during Q1 compared with 1.6% on £8.5m of reviews agreed during FY15. Building and land costs have continued to increase and the Investment Adviser expects an acceleration of open market rental growth once the expected pick-up in new development schemes accelerates.
■
Total income increased by 14.2% in FY15, while total expenses (excluding the FY14 Investment Adviser performance fee of £1.9m) increased by 10.1%. Including the FY14 performance fee, headline expenses declined by 16.6%. Normalised EBITDA (excluding valuation gains and other one-offs) increased by £3.6m or 15.2% to £27.3m. With effect from the beginning of FY16 the Fund has agreed with the Investment Adviser a further reduction in the management fee structure. The fees paid to the Investment Advisor will be pegged at the old level in absolute money terms, rather than increasing with AUM until property assets equal or exceed £782m. At that point the new tiered fee schedule will apply, including a reduction in the fee level applied to marginal asset growth.
■
FY15 underlying earnings on an EPRA basis (which excludes valuation movements, performance fees and fixed-debt break costs) increased £4.8m or 55% to £13.4m. EPRA earnings per share increased from 2.5p to 3.7p. Statutory earnings increased by £15.7m or 78% to £35.8m, benefiting from the fall away of the FY14 performance fee, as well as from higher property revaluation gains. FY15 revaluation gains were £25.6m, up from £11.6m in FY14, primarily resulting from further yield compression (net initial yield to 5.46% from 5.57% at mid-year and 5.68% at the end of FY14). The Q116 valuation has seen further yield compression, to 5.4%, resulting in a net valuation gain of £2.5m in the period.
■
Maintaining the progressive dividend policy, total dividends of 5.9p per ordinary share were declared for FY15. Dividend cover, measured against underlying EPRA earnings, increased to 63.3% from 53.6% in FY14. The Fund has traditionally focused on total shareholder return (share price plus dividends), of which the dividend yield (c 7%) is a large contributor. However, greater focus is now being given to continuing to improve dividend cover and it has been indicated that the rate of dividend growth will be reduced in FY16. The board recently approved a quarterly dividend of 1.4875p per share in respect of the first quarter of FY16 and, subject to unforeseen circumstances, expects to pay dividends totalling 5.95p for the year.
■
NAV per share, on an EPRA basis, increased to 70.8p per share in FY15 versus 65.4p in FY14 and in Q1 has increased further to 71.2p (unaudited). EPRA NNNAV has increased at a faster rate in Q1, from 62.7p to 65.4p, reflecting an increase in gilt yields during the quarter. On unchanged assumptions, the Investment Adviser’s discounted cash flow NAV per share was 95.3p in Q1, having increased to 94.9p per share from 93.4p during FY15.
■
Reflecting ongoing asset acquisitions, net debt was £281.4m at the end of FY15, up from £255.2m at the end of FY14. Adjusted gearing was 50.2%, up from 49.9%, but still at the lower end of the 50-65% range targeted over time. Adjusting for cash, total drawn facilities of £338.3m at year end carried an all-in, fixed-rate cost of 4.45% with an average unexpired term of 15.0 years (closely matching the average unexpired lease term). In April 2015, the Fund issued £50m of loan notes to Standard Life, a new institutional investor in the fund, maturing in 2028, with no amortisation, at an all-in rate of 3.838%. Additionally, the maturity of an existing £50m loan note was extended to 2028 on very favourable terms. In February 2015, the Fund issued, and immediately repurchased for treasury, 32.8m shares. These shares have been and will continue to be used to satisfy further investor demand, including scrip dividends, with a sales price at above NAV per share. 8.3m shares were sold from treasury during FY15 and 7.0m shares have been sold subsequently.
Portfolio update: First steps in Ireland
During FY15 the Fund added six properties (total committed investment £27.4m at a cash yield of 5.87%) and in FY16 year to date (commencing 1 October 2015) it has added a further seven properties (total committed investment £23.4m). At the end of FY15 the total committed investment portfolio stood at £559.5m, with the total completed and income-producing portfolio valued at £544.5m. The average unexpired lease term on the properties of 15.8 years at 30 September 2015 provides security over future cash flows, while the average age of 7.2 years and average value of £4.0m provides support that the portfolio as a whole is focused on larger, more modern properties, which should be able to meet the NHS’s changing needs and create longer-term value. The UK market remains competitive, with a restricted supply of properties ahead of the anticipated upturn in new NHS development approvals and investment yields compressing. The Investment Adviser reports that it continues to be selective, targeting best-in-class assets that have the potential to generate returns over the longer term and not just an immediate yield. The entry into the Irish market came after a period of extensive research. Ireland has similar demographic trends to the UK in several respects: the population is expected to continue to grow while living longer and living with medical conditions requiring treatment for longer. To prepare for the future needs of the population (and as part of a post-financial crisis stimulus package), the Irish government has embarked on a major restructuring of the health system. One of the main objectives has been to establish a single-tier system where primary care will become freely and universally available. As part of this process, the Department of Health strategy seeks to deliver a number of new primary care centres (PCCs); nine were delivered in 2015 and 28 are planned for 2016 and the first half of 2017. At the time that the targets were published at the end of 2014, there were around 30 PCCs under construction with a further 50 planned. The planned facilities are relatively large (1,500-5,000sqm) and host care and affiliated providers. At the FY15 year end MedicX Fund reported a €50m pipeline of potential investments and has since announced the €8.0m forward funding of a primary care centre on the outskirts of Dublin.
Republic of Ireland: Attractive risk-reward balance
Unlike the UK, Irish GP rents and rates are not reimbursed by the government. This has inhibited private investment in healthcare facilities. The new strategy put the Health Service Executive (HSE, the Irish equivalent of the NHS) in the position of anchor tenant in the planned new facilities, accounting for 60-75% of the tenanted space on 25-year leases. The HSE will provide a range of services including community and public health nursing teams, home helps, mental health services, social workers, dental care and other services such as speech therapy. The remaining space will be tenanted by GPs and pharmacies or other private tenants.
In the UK, the Fund receives around 90% of its rental income directly or indirectly from the government and nearly all of the rest from co-located pharmacy operations. While the tenant covenant in Ireland will not be as strong as in the UK, the above tenant mix should provide a good-quality income stream. We understand that investment yields, adjusted for funding costs are 150-200bp higher than in the UK currently. We see the main differences as 1) HSE rents are subject to five-year rent reviews, but may in theory go down as well as up (the UK is effectively upwards only); and 2) unlike the UK, with effectively full occupancy, there may be more variability in non-HSE occupancy. We do not feel that foreign exchange movements between sterling and the euro pose a material threat as it should be possible to mitigate much of the risk by matching euro assets with euro borrowings.
The two investments that have been made to date are both forward funding agreements for properties that are expected to be completed in September and December 2016 respectively. In both cases the lead tenant is the HSE. In Westmeath the other tenants are GPs and a pharmacy, whereas the Crumlin primary care centre, where the HSE has taken 60% of the building, has a longer tenant list including two GPs, a dentist, an optician and a pharmacist.
The Investment Adviser has indicated that Irish assets will not exceed 15% of the total portfolio. This seems like a realistic ambition given that the market is much smaller than the UK. Having conducted a cost benefit study, the Fund has concluded that the most efficient structure to hold the Irish assets is as a non-resident landlord, until they total roughly £50m in value. This may change in future if the cost of a different structure is outweighed by the tax saving; other options are under review.
UK growth should soon resume
For the core and much larger UK market, we believe the medium- to long-term growth outlook remains strong in a market driven by an ageing population with growing healthcare needs, an underinvested primary healthcare estate and a general acceptance of the need for more integrated primary care services in the community.
The NHS Five-Year Forward View has adopted the main recommendations of Simon Stevens’ review and this has been endorsed by government. An additional £10bn pa in funding for the NHS has been committed and £6bn of this has been brought forward to 2017-18. In addition to increased funding, the NHS will need to deliver significant operational efficiencies, estimated at £22bn pa and, as part of the plan for achieving this, the NHS plans significant changes to the way it operates. Additional and more integrated services are to be delivered by the primary care sector, in the community, with extended opening hours to improve access. The anticipated changes in healthcare delivery require modern, purpose-built, flexible premises (of the type in which MedicX invests), in contrast to a significant proportion of the existing estate, which is comprised of ageing, converted, residential properties.
Clinical commissioning groups (CCGs) are putting in place their strategies for their primary care estates, aimed at ensuring that the healthcare infrastructure is fit for purpose and able to support changing healthcare needs. As these are completed in the coming months, it is anticipated that the pace of commissioning of required new developments will finally start to increase.
Currently, 50% of primary care premises are more than 30 years old and many of these are converted residential premises (source: Savills/EC Harris). In a recent survey by the BMA, 70% of GPs stated that their premises are too small to be able to deliver enhanced and additional services, 52% stated that their premises had seen no investment or refurbishment in the past 10 years and the majority said that their premises are too small to be able to deliver training and education.
Even allowing for ongoing consolidation of smaller GP practices into larger groups, the implied future demand for investment in modern, purpose-built premises is very significant. However, if the NHS commitment is restricted to rent reimbursement, this would be a much more manageable
5-6% of the capital investment required.
Favourable funding conditions mitigate current yield pressure
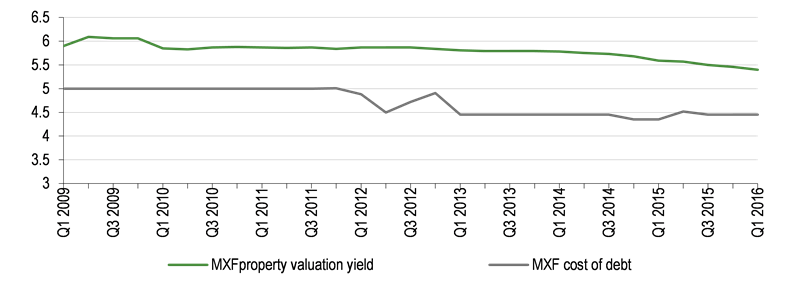
Demand for attractive primary healthcare properties has remained strong, which is continuing to compress yields. While revaluations have helped increase NAV, yield compression continues to make it more expensive to acquire assets and new income streams in the UK. Much of the competition comes from institutional investors seeking larger assets and portfolios, which some market participants indicate are being bought at yields below 5%. For that reason, MedicX is focusing on single assets and forward funding developments.
Funding conditions have continued to be favourable and the Fund has a policy of using long-term, fixed debt to fund acquisitions. A new £50m loan note was agreed in H115 with a term of 13 years and five months at a fixed rate of 3.838%, and an existing £50m loan note was extended by nine years and three months to 2028, locking in a healthy spread between income and funding costs.
|
Exhibit 1: Property yield versus borrowing cost, % |
|
|
Source: Company data, Edison Investment Research. Note: Data to 31 December 2015. |
Valuation and performance
In FY15, EPRA NAV total return (the increase in NAV plus dividends) was 17.2%, although total shareholder return (dividends plus share price movement) was -0.4%, affected by share price weakness towards the end of the period. The share price weakness has reversed, with a total shareholder return of 12.2% since 30 September 2015. The primary care sector enjoys high income visibility and security, with effectively full occupancy, long leases and the UK government as the effective tenant of 90% of properties (in Ireland government income will be 60-75%). Income forms a higher proportion of returns than for the commercial sector in general and both income and capital returns are less volatile in primary healthcare than other sectors. The Fund’s costs are relatively certain because it uses an external manger and does not have the risks associated with being an operator or developer of property. The rising dividend, supported by the security of income, even though not fully covered by EPRA earnings, forms a substantial part of the total return and there is a scrip dividend alternative for shareholders who do not wish to take their returns in cash.
Yield attraction
The dividend yield is a key attraction of the stock and we expect MXF’s dividend for FY16 to be 5.95p per share, a prospective yield of c 7.0%.
Progress towards full dividend cover continues: FY15 saw cover increase to 63.3% from 53.6% in FY14. We estimate further modest progress in FY16 (to 64.7%) and 68.6% in FY17.
Underlying EPRA earnings in FY15 gave a return of 5.5% on average NAV, ahead of the 5.3% earned in FY14. In 2016 we expect a similar level. This measure excludes valuation movements from earnings, but revaluation does increase the asset base to which they are compared.
NAV valuation
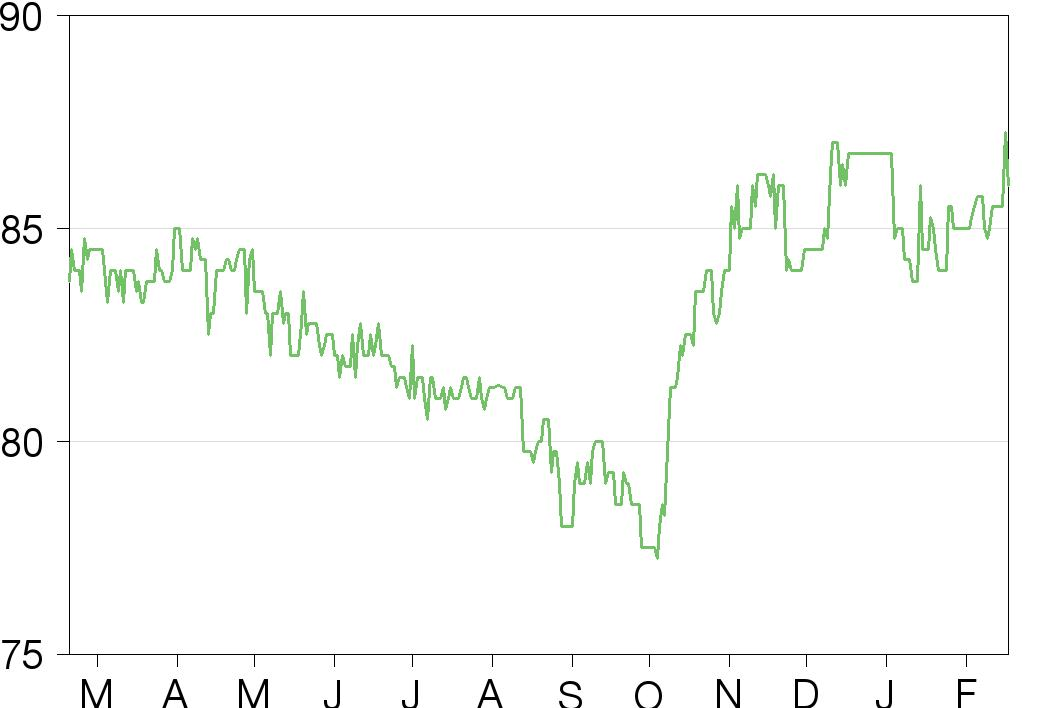
EPRA NAV per share, which is adjusted to exclude the impact of deferred tax not expected to crystallise, was 71.2p per share at the end of Q116 (31 December 2015), up from 70.8p at the year end and 65.4p at the end of FY14. At a price of 84.75p, this puts the shares on a P/NAV of 1.19x.
Our forecasts do not assume any further valuation yield compression beyond the 5.4% (FY15 5.46%) reported for Q116, however, this is entirely possible. The Investment Adviser estimated in December that if valuation yields were to decline by 50bps the year-end EPRA NAV would have increased by 15p per share, or 21%, to 85.8p. We would anticipate a similar result to apply to the current portfolio.
Adviser’s discounted cash flow model
The Investment Adviser undertakes a periodic DCF valuation of the portfolio (see the Investment Adviser’s report in the Annual Report for full details of the methodology). The discounted cash flows assume a long term average 2.5% per year increase in individual property rents at their respective review dates. Residual values continue to be based on capital growth at 1% a year from the current valuation until the expiry of leases (when the properties are notionally sold), and assuming the current level of borrowing facilities. The DCF uses a discount rate of 7% for completed occupied properties and 8% for those under construction. The Q116 weighted average was 7.05%.
At the end of Q116 (31 December 2015), the DCF valuation was £352.9m or 95.3p per share.
The long-term rent growth assumption in the DCF is above the current average level of increases being achieved, although these are expected to increase as new development activity picks up. However, with the FY15 results it was stated that for the year-end DCF value per share of 94.9p to equate to the share price (84.5p at 4 December 2015), the calculation would have to assume a 0.6% pa increase in rents, or a weighted average discount rate of 8.2%.
Financials
The strong 2015 results reported in December were in line with our forecasts, the only exception being higher reported net valuation gains than we had allowed for. Our practice is to anticipate only the revaluation gains that are likely to arise from rental growth, with no assumption for changes in valuation yields. The continued H2 compression in yields lifted full year 2015 net gains to £25.6m compared with our forecast £20.5m. We have included the £2.5m net gain reported for the first quarter of the current year in our revised estimates, but beyond Q1 and through 2017 the forecast gains are based on assumed average rent growth of 1% in 2016 and 1.5% in 2017.
Exhibit 2: Estimate revisions
Revenue (£m) |
EPS (p) |
DPS (p) |
EPRA NAV/share (p) |
Profit before tax (£000s) |
|||||||||||
Old |
New |
% change |
Old |
New |
Change |
Old |
New |
Change |
Old |
New |
Change |
Old |
New |
Change |
|
09/15 |
33.7 |
33.7 |
(0.2) |
3.6 |
3.7 |
2.6 |
5.90 |
5.90 |
0.0 |
69.7 |
70.8 |
1.6 |
13,012 |
13,519 |
3.9 |
09/16e |
37.2 |
36.2 |
(2.6) |
3.7 |
3.8 |
2.7 |
6.00 |
5.95 |
(0.8) |
70.0 |
70.5 |
0.7 |
13,661 |
14,204 |
4.0 |
09/17e |
40.0 |
4.1 |
6.00 |
71.2 |
15,416 |
||||||||||
Source: Company data, Edison Investment Research
For FY16 we reduced our expectation for rental income/revenue, but this is offset by financing and cost savings. We have reduced our forecast for new commitments from £80m to £60m with a higher proportion of development properties that will only contribute to rental income when completed. The revenue deferred during FY16 by this mix effect should be made up in FY17 as the development properties complete, and for 2017 we have allowed for £75m of new acquisitions and commitments. As discussed above, the Fund entered the current year with a strong acquisition pipeline and has announced £23.4m of acquisition in FY16 year to date. Our estimates imply that the pace of acquisitions will slow during FY16 and we will monitor the developments to see if this is in fact the case. We are conscious that it will take time for the supply of UK opportunities to increase and our 2016 forecast is already based on an assumed £30m of Irish investment. Including an assumed £20m of Irish investment in 2017 would take the Irish portfolio to around 8% of the forecast total, still well below the indicated higher limit of 15%. We have assumed c 200bp of additional yield spread after financing on Irish investments versus those in the UK.
Our forecasts show dividend cover continuing to increase, to 64.7% in FY16 (previously 64.4%) and 68.6% in FY17.
Our balance sheet projections assume that portfolio growth is funded by additional debt, taking forecast net debt to £342.4m by the end of FY16 at an assumed similar average cost to the existing debt. This would take the ratio of net debt to portfolio value to 55.3% in FY16, well below management’s preference for an upper limit of 65%. Our forecasts do not include additional sales of treasury stock, although these are likely. We estimate that there are around 17m treasury shares remaining in excess of likely scrip dividend requirements through to the end of 2017. At the current share price, these could raise an additional c £15m in cash for investment.
Exhibit 3: Financial summary
Year end 30 September |
£000s |
2013 |
2014 |
2015 |
2016e |
2017e |
|
PROFIT & LOSS |
|||||||
Revenue |
|
|
25,537 |
29,488 |
33,669 |
36,249 |
40,002 |
Cost of Sales |
(413) |
(666) |
(902) |
(900) |
(987) |
||
Gross Profit |
25,124 |
28,822 |
32,767 |
35,349 |
39,015 |
||
EBITDA |
|
|
20,616 |
23,664 |
27,255 |
29,661 |
33,247 |
Operating Profit (before GW and except.) |
|
|
20,616 |
23,664 |
27,255 |
29,661 |
33,247 |
Intangible Amortisation |
0 |
0 |
0 |
0 |
0 |
||
Revaluation of investment properties |
248 |
11,649 |
25,603 |
5,525 |
9,338 |
||
Investment advisory performance fee / loss on disposal of property |
(240) |
(1,888) |
0 |
0 |
0 |
||
Operating Profit |
20,624 |
33,425 |
52,858 |
35,186 |
42,585 |
||
Net Interest |
(10,959) |
(12,989) |
(13,736) |
(15,457) |
(17,831) |
||
Profit Before Tax (norm) |
|
|
9,657 |
10,675 |
13,519 |
14,204 |
15,416 |
Profit Before Tax (FRS 3) |
|
|
9,665 |
20,436 |
39,122 |
19,729 |
24,754 |
Deferred tax on fair value movements in property values |
(299) |
(264) |
(3,293) |
0 |
0 |
||
Profit After Tax (norm) |
9,656 |
10,675 |
13,520 |
14,206 |
15,419 |
||
Profit After Tax (FRS 3) |
9,366 |
20,172 |
35,829 |
19,729 |
24,754 |
||
Average Number of Shares Outstanding (m) |
263.4 |
341.4 |
361.3 |
371.8 |
375.4 |
||
EPS - normalised (p) |
|
|
3.7 |
3.1 |
3.7 |
3.8 |
4.1 |
EPS - FRS 3 (p) |
|
|
3.6 |
5.9 |
9.9 |
5.3 |
6.6 |
Dividend per share (p) |
5.70 |
5.80 |
5.90 |
5.95 |
6.00 |
||
Dividend cover |
63.8% |
53.6% |
63.3% |
64.7% |
68.6% |
||
BALANCE SHEET |
|||||||
Fixed Assets |
|
|
426,649 |
502,906 |
553,479 |
619,004 |
696,548 |
Intangible Assets |
0 |
0 |
0 |
0 |
0 |
||
Tangible Assets |
399,502 |
492,252 |
544,490 |
615,015 |
681,548 |
||
Properties under construction |
27,147 |
10,654 |
8,989 |
3,989 |
15,000 |
||
Current Assets |
|
|
38,067 |
39,306 |
63,688 |
37,491 |
38,244 |
Stocks |
0 |
0 |
0 |
0 |
0 |
||
Debtors |
11,004 |
8,181 |
6,778 |
7,490 |
8,242 |
||
Cash |
27,063 |
31,125 |
56,910 |
30,000 |
30,000 |
||
Current Liabilities |
|
|
(19,994) |
(56,714) |
(20,862) |
(18,725) |
(20,606) |
Creditors |
(18,865) |
(23,866) |
(18,966) |
(18,725) |
(20,606) |
||
Short term borrowings |
(1,129) |
(32,822) |
(1,896) |
0 |
0 |
||
Financial derivatives |
0 |
(26) |
0 |
0 |
0 |
||
Long Term Liabilities |
|
|
(273,732) |
(254,798) |
(342,208) |
(378,154) |
(450,038) |
Long term borrowings |
(272,615) |
(253,485) |
(336,412) |
(372,358) |
(444,242) |
||
Other long term liabilities |
(1,117) |
(1,313) |
(5,796) |
(5,796) |
(5,796) |
||
Net Assets |
|
|
170,990 |
230,700 |
254,097 |
259,616 |
264,149 |
Net Assets excluding goodwill and deferred tax |
|
|
171,832 |
231,764 |
258,428 |
263,946 |
268,478 |
NAV/share (p) |
62.2 |
65.1 |
69.6 |
69.4 |
70.1 |
||
EPRA NAV/share (p) |
62.5 |
65.4 |
70.8 |
70.5 |
71.2 |
||
Est. value/share of Fund's long-term fixed rate debt (p) |
6.3 |
-0.4 |
-6.9 |
-6.7 |
-6.7 |
||
EPRA NNAV/share including benefit of long-term debt (p) |
68.5 |
64.7 |
62.7 |
62.6 |
63.4 |
||
CASH FLOW |
|||||||
Operating Cash Flow |
|
|
18,515 |
23,639 |
23,362 |
28,708 |
34,376 |
Net Interest |
(11,495) |
(11,342) |
(13,210) |
(15,457) |
(17,831) |
||
Tax |
0 |
0 |
0 |
0 |
0 |
||
Capex |
0 |
0 |
0 |
0 |
0 |
||
Acquisitions/disposals |
(30,428) |
(42,161) |
(23,316) |
(60,000) |
(68,206) |
||
Financing |
(1,757) |
55,577 |
6,119 |
5,943 |
0 |
||
Dividends |
(13,610) |
(16,759) |
(19,247) |
(20,154) |
(20,222) |
||
Net Cash Flow |
(38,775) |
8,954 |
(26,292) |
(60,960) |
(71,884) |
||
Opening net debt/(cash) |
|
|
189,206 |
246,681 |
255,182 |
281,398 |
342,358 |
HP finance leases initiated |
0 |
0 |
0 |
0 |
0 |
||
Other items (including debt assumed on acquisition) |
(18,700) |
(17,455) |
76 |
0 |
0 |
||
Closing net debt/(cash) |
|
|
246,681 |
255,182 |
281,398 |
342,358 |
414,242 |
Source: Company data, Edison Investment Research
|