Last close As at 05/08/2026
GBP6.00
▲ −14.00 (−2.28%)
Market capitalisation
GBP898m
Research: Investment Companies
Standard Life Private Equity Trust (SLPET) continues to follow a long-term, conviction approach to selecting primarily European private equity buyout funds, managing its exposure through the primary and secondary fund markets. Having broadened its investment policy in 2017, SLPET added exposure to a domestic US manager by acquiring a secondary position in Onex Partners IV in H118, and recently made a new primary commitment to MSouth Equity Partners IV, with the manager undertaking due diligence on a number of other US funds. SLPET has achieved above-average NAV returns among its fund of fund peers over one, three and five years, and has also outperformed UK and European stock market indices over these periods. SLPET has a competitive ongoing charge versus peers and its 3.8% yield ranks at the top of the peer group.
Written by
Standard Life Private Equity Trust |
Measured addition of domestic US fund exposure |
Investment trusts |
13 July 2018 |
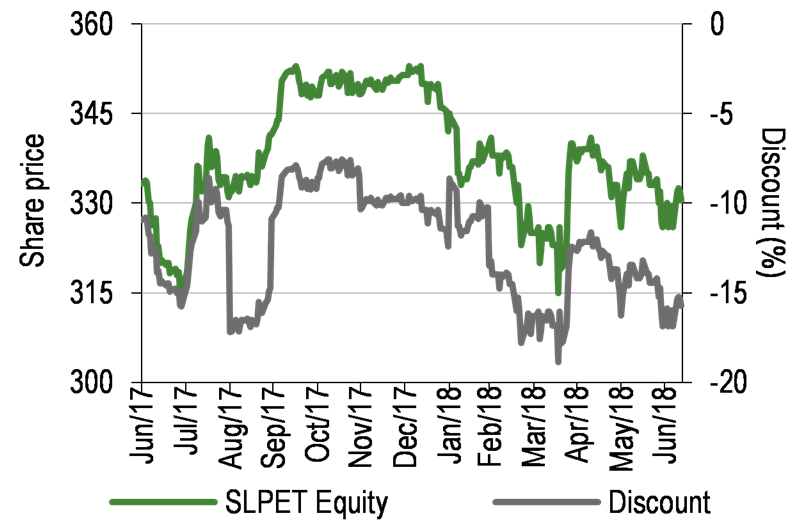
Share price/discount performance
Three-year performance vs index
Gearing
Analysts
|
|||||||||||||||||||||||||||||||||||||||||||||||||||||||||||||||||||||||||||||||||||||||
Standard Life Private Equity Trust (SLPET) continues to follow a long-term, conviction approach to selecting primarily European private equity buyout funds, managing its exposure through the primary and secondary fund markets. Having broadened its investment policy in 2017, SLPET added exposure to a domestic US manager by acquiring a secondary position in Onex Partners IV in H118, and recently made a new primary commitment to MSouth Equity Partners IV, with the manager undertaking due diligence on a number of other US funds. SLPET has achieved above-average NAV returns among its fund of fund peers over one, three and five years, and has also outperformed UK and European stock market indices over these periods. SLPET has a competitive ongoing charge versus peers and its 3.8% yield ranks at the top of the peer group.
12 months ending |
Share price |
NAV |
LPX Europe (%) |
LPX Europe NAV (%) |
MSCI Europe (%) |
FTSE All-Share (%) |
31/03/14 |
12.9 |
6.8 |
17.5 |
6.8 |
14.2 |
8.8 |
31/03/15 |
11.4 |
8.5 |
7.9 |
0.4 |
7.4 |
6.6 |
31/03/16 |
(5.8) |
17.5 |
7.6 |
11.8 |
(5.1) |
(3.9) |
31/03/17 |
53.5 |
20.7 |
29.4 |
25.2 |
27.0 |
22.0 |
31/03/18 |
10.8 |
9.1 |
16.4 |
10.2 |
3.1 |
1.2 |
Source: Thomson Datastream, Bloomberg. Note: 12-month discrete £-adjusted total return performance up to last published non-estimated NAV.
Investment strategy: Focused fund selection
To achieve SLPET’s long-term total return objective, the manager primarily focuses on identifying and investing in Europe’s leading private equity buyout funds. The result is a portfolio consisting of 35-40 active funds run by experienced private equity managers with strong track records of generating attractive investment returns, giving exposure to an underlying portfolio of c 350 private companies. The manager follows a systematic, disciplined approach, involving rigorous screening and due diligence to evaluate primary fund offerings, with additional portfolio analysis conducted on secondary market investments, which are used to adjust portfolio exposures and to maintain SLPET’s capital efficiency.
Outlook: Earnings growth to drive valuation gains
The manager highlights that many of the funds in SLPET’s portfolio are continuing to report positive earnings growth across their investee companies, which is seen as the key driver of valuation gains. In addition, strong levels of exit activity have been maintained across SLPET’s portfolio and the manager views this as likely to continue over the next 12 months. The expectation is that this will add to valuation gains, given the consistent level of exit premiums achieved in recent years, with SLPET seeing a 25% average exit uplift on portfolio valuations two quarters earlier.
Valuation: Widened discount; attractive yield
SLPET’s share price discount to NAV has fluctuated over the last year, widening from 7.5% in November 2017 to 15.7% currently, as the share price has declined while the NAV has remained broadly stable. The board intends to pay four quarterly dividends of 3.1p for FY18, equating to a prospective 3.8% yield.
Exhibit 1: Trust at a glance
Investment objective and fund background |
Recent developments |
|||||||||||||||||||||||||||||||||||||||||||||||||||||||||||||||||||||||||||||||||||
SLPET’s objective is to achieve long-term total returns through investing in a diversified portfolio of leading private equity buyout funds, a majority of which have a European focus, with exposure managed through the primary and secondary funds markets. Since January 2017, there have been no size and geographic restrictions applying to fund selection. There is currently no available benchmark that the board deems an appropriate measure of SLPET’s investment performance. |
■ 13 July 2018: 30 June 2018 estimated NAV per share 392.2p. ■ 18 June 2018: 3.1p dividend announced for Q218. ■ 18 June 2018: Results for six months to 31 March 2018 – NAV total return +1.5%, share price total return -2.3%, vs MSCI Europe index total return -4.0%. ■ 15 June 2018: Jonathon Bond appointed as a director. ■ 26 March 2018: Quarterly update to 31 Dec 2017 – NAV per share +3.1% to 401.5p. ■ 21 March 2018: 3.1p dividend announced for Q118. ■ 11 December 2017: Confirmation of intended move to quarterly dividends, with four quarterly payments of 3.1p planned for FY18. |
|||||||||||||||||||||||||||||||||||||||||||||||||||||||||||||||||||||||||||||||||||
Forthcoming |
Capital structure |
Fund details |
||||||||||||||||||||||||||||||||||||||||||||||||||||||||||||||||||||||||||||||||||
AGM |
January 2019 |
Ongoing charges |
1.14% (FY17 direct fees) |
Group |
SL Capital Partners |
|||||||||||||||||||||||||||||||||||||||||||||||||||||||||||||||||||||||||||||||
Final results |
December 2018 |
Net cash |
16.5% |
Manager |
Team managed |
|||||||||||||||||||||||||||||||||||||||||||||||||||||||||||||||||||||||||||||||
Year end |
30 September |
Annual mgmt fee |
0.95% of net assets |
Address |
1 George Street, Edinburgh EH2 2LL |
|||||||||||||||||||||||||||||||||||||||||||||||||||||||||||||||||||||||||||||||
Dividend paid |
Apr, Jul, Oct, Jan |
Performance fee |
None |
|||||||||||||||||||||||||||||||||||||||||||||||||||||||||||||||||||||||||||||||||
Launch date |
29 May 2001 |
Trust life |
Indefinite |
Phone |
0131 245 0055 |
|||||||||||||||||||||||||||||||||||||||||||||||||||||||||||||||||||||||||||||||
Continuation vote |
N/A |
Loan facilities |
£80m revolving credit facility |
Website |
||||||||||||||||||||||||||||||||||||||||||||||||||||||||||||||||||||||||||||||||
Dividend policy and history (financial years) |
Share buyback policy and history (financial years) |
|||||||||||||||||||||||||||||||||||||||||||||||||||||||||||||||||||||||||||||||||||
The board’s intention is to maintain the real value of the 12.0p FY17 annual dividend in future years, with four quarterly dividends of 3.1p planned for FY18. |
The board views buybacks as part of its strategy in relation to capital efficiency. SLPET has authority to repurchase 14.99% and allot 5.0% of its issued capital. |
|||||||||||||||||||||||||||||||||||||||||||||||||||||||||||||||||||||||||||||||||||
|
|
|||||||||||||||||||||||||||||||||||||||||||||||||||||||||||||||||||||||||||||||||||
Shareholder base (as at 31 May 2018) |
Portfolio exposure by fund type (as at 31 March 2018) |
|||||||||||||||||||||||||||||||||||||||||||||||||||||||||||||||||||||||||||||||||||
|
|
|||||||||||||||||||||||||||||||||||||||||||||||||||||||||||||||||||||||||||||||||||
Top 10 underlying holdings (as at 31 March 2018) |
||||||||||||||||||||||||||||||||||||||||||||||||||||||||||||||||||||||||||||||||||||
|
||||||||||||||||||||||||||||||||||||||||||||||||||||||||||||||||||||||||||||||||||||
Source: SLPET, Edison Investment Research, Bloomberg, Morningstar, Thomson Reuters. Note: *N/A where not in March 2017 top 30.
Fund profile: Selective private equity fund of funds
Launched in May 2001 and listed on the London Stock Exchange, SLPET’s objective is to achieve long-term total returns through investing in a diversified portfolio of private equity buyout funds, a majority of which have a European focus. Investment flexibility was increased in January 2017, when SLPET’s investment policy was revised to remove restrictions over the target enterprise value range of the funds selected for investment, and the limit on portfolio investments outside Europe.
The manager’s investment approach involves rigorous screening and thorough due diligence to identify and evaluate potential private equity fund investments. The manager considers that access to leading private equity managers and selective fund allocation are essential to achieving the best possible investment performance, given that historical returns across the private equity fund universe have varied widely. It is aimed for SLPET’s portfolio to comprise around 35 to 40 active fund investments at any one time, with individual fund and manager exposure limits set at 12.5% and 20.0% of NAV, respectively, to ensure sufficient diversification.
SLPET’s investment manager is SL Capital Partners, part of Aberdeen Standard Investments and one of the largest private equity fund investors in Europe, with a deeply resourced and experienced investment team. The manager sees its scale and the team’s experience as key advantages in selecting Europe’s top-tier private equity funds, which may be less accessible to the wider market.
The fund manager: SL Capital Partners
The manager’s view: Appealing fund of funds characteristics
The manager emphasises a number of SLPET’s features that could appeal to investors, including its broad access to leading private equity managers and its consistent track record in selecting top-performing funds. The manager highlights that its rigorous fund selection process has resulted in the majority of SLPET’s 2007 to 2013 vintage fund investments achieving above-average returns. As shown in Exhibit 2 (left-hand chart), close to 80% of SLPET’s primary fund investments ranked in the top and second quartiles among similar vintage European private equity funds. In addition to the greater geography, sector and vintage diversification provided by a fund of funds, the manager points out the potential for SLPET to deploy capital opportunistically through the secondary private equity market. As well as tending to deliver a less volatile NAV progression than typical for a direct investment fund, the manager notes SLPET’s consistent cash inflows from realisations, which have enabled it to commit to paying quarterly dividends at a yield approaching 4%.
|
Exhibit 2: SLPET total value to paid in (TVPI) multiple and IRR analysis |
||||||||||||||||||||||||||||||||||||||||||||||||||||||||||||||||||
SLPET underlying fund TVPI and IRR quartile rankings by count |
SLPET exit TVPI uplifts to most recent quarterly portfolio valuations (%) |
|||||||||||||||||||||||||||||||||||||||||||||||||||||||||||||||||
|
|
|||||||||||||||||||||||||||||||||||||||||||||||||||||||||||||||||
|
Source: SLPET, Burgiss. Note: TVPI and quartile rankings based on 2001 to 2013 fund vintages as at end-December 2017 (34 SLPET funds benchmarked against 235 European private equity funds). Exit TVPI uplifts in local currency terms, gross of fees and carried interests, excluding fully written off investments, SEP I & II (venture funds), listed investments and two investments with >200% uplifts. |
||||||||||||||||||||||||||||||||||||||||||||||||||||||||||||||||||
While a lack of transparency over private equity managers’ internally derived portfolio valuations may be a source of concern to some investors, the manager highlights SLPET’s experience that private equity funds frequently exit portfolio companies at material uplifts to the most recent portfolio valuation. As shown in Exhibit 2 (right-hand table), aggregate exit TVPI multiples for SLPET’s underlying portfolio companies from 2007 to 2017 were consistently higher than the relevant portfolio valuations in each of the preceding four quarters. While varying appreciably over this period – with the highest exit premiums seen in 2007, prior to the global financial crisis, and the lowest in 2009 – the manager notes that exit TVPI uplifts to portfolio valuations have been broadly stable in each year since 2011. Across SLPET’s portfolio, the manager’s analysis shows average exit premiums of 16%, 25%, 34% and 40% over the portfolio valuations one, two, three and four quarters earlier. This suggests a consistent, relatively conservative approach is generally adopted in the valuation of portfolio companies as they mature.
Asset allocation
Investment process: Systematic, disciplined approach
SLPET’s primary focus is to identify and invest in Europe’s leading private equity buyout funds. The manager’s aim is for SLPET to hold c 35 to 40 active fund investments, providing exposure to around 350 underlying private companies, giving the portfolio a broad diversification by country, industry sector, maturity and number of underlying investments. The investment team’s extensive fund and direct deal experience gives the manager a strong insight into the strategies of the funds reviewed for investment, as well as the processes and disciplines of the private equity managers, which feeds into the team’s qualitative decisions on where to invest.
As well as making primary fund commitments, the manager can acquire or sell selected fund interests in the secondary private equity funds market to adjust SLPET’s portfolio exposures, as well as to maintain capital efficiency. Secondary investments typically generate lower valuation gains in absolute terms, but can generate higher annualised rates of return (IRRs) due to their shorter holding periods. Partly or fully invested secondary interests also have a lower risk profile than primary commitments, as the underlying holdings can be evaluated prior to purchase.
SLPET’s manager follows a systematic, disciplined approach to investment selection, monitoring and realisation. A universe of c 800 institutional-grade private equity funds in Europe is monitored, with 100-150 funds screened for investment each year, of which c 25 are shortlisted and reviewed in detail. SLPET typically makes around four to six primary and secondary investments each year.
Based on a detailed analysis of scheduled and projected portfolio cash flows, fund commitments are made in excess of SLPET’s available uninvested capital, to maximise the level of invested assets and reduce cash-drag on performance. SLPET had total outstanding commitments of £399.4m and net liquid resources of £99.3m at 30 June 2018. However, commitment levels appear relatively conservative, with fund drawdowns lower than realisations in each of the last five financial years. SLPET also has an £80m credit facility that can be used to finance drawdowns. SLPET’s non-sterling currency exposure (primarily to the euro and US dollar) is unhedged, but cash and debt are held broadly in proportion to the currencies of outstanding fund commitments.
Current portfolio positioning
At 31 March 2018, SLPET’s portfolio comprised 54 private equity fund interests (of which six were yet to invest, four had sold all their investments, and four had only one investment remaining), which were collectively invested in a total of 374 separate companies and 80 other private equity funds. While the portfolio is broadly diversified, SLPET’s focused approach is reflected in the concentration of its top 10 fund holdings (see Exhibit 3), which represented 49.7% of NAV and 57.5% of the invested portfolio at 31 March 2018. SLPET is invested in successive funds run by a number of individual managers, and the top 10 managers accounted for 66.4% of NAV, with two Nordic Capital funds making up a combined 10.4% of NAV at end-March 2018 and four Advent funds, all outside the top 10, representing 8.6% of NAV in total. The top 10 underlying portfolio companies accounted for 17.1% of NAV (see Exhibit 1), with the top two together representing 10.0%. Two further companies each represented more than 1.0% of NAV, a level at which individual holdings can materially influence portfolio returns.
In H118, SLPET made three new primary commitments totalling £79.4m to PAI Europe VII, Equistone Partners Europe Fund VI and Bridgepoint Europe VI, all run by managers already represented in the portfolio. Two secondary investments totalling £21.9m were made during the half year, comprising original commitments of US$20.0m to Onex Partners IV and €15.2m to Nordic Capital Fund VIII, which was already held in the portfolio. As at end-March 2018, 17% of the portfolio had been acquired through secondary purchases (see Exhibit 1), and the manager expects that this proportion will increase.
Exhibit 3: SLPET’s top 10 private equity fund holdings as at 31 March 2018
Fund |
Strategy |
Vintage |
No. of invts |
Remaining commit-ments (£m) |
Residual cost (£m) |
Val’n (£m) |
% of NAV |
Net multiple |
|
31 March 2018 |
31 March 2017 |
||||||||
3i Eurofund V |
European mid-market buyouts |
2006 |
5 |
1.8 |
12.6 |
49.0 |
8.2 |
7.6 |
2.5x |
Nordic Capital Fund VIII |
European complex buyouts & global healthcare |
2013 |
17 |
3.1 |
36.8 |
41.5 |
6.9 |
3.6 |
1.3x |
Permira V |
Transformational buyouts globally |
2014 |
18 |
4.3 |
18.7 |
30.4 |
5.1 |
4.8 |
1.7x |
IK VII |
Northern European mid-market buyouts |
2012 |
13 |
1.5 |
21.2 |
29.8 |
5.0 |
5.9 |
1.5x |
Exponent Private Equity Partners III |
UK mid-market buyouts |
2015 |
10 |
3.5 |
24.6 |
28.2 |
4.7 |
2.6 |
1.2x |
BC European Capital IX |
European and US mid to large buyouts |
2011 |
18 |
0.0 |
20.2 |
27.2 |
4.5 |
5.4 |
N/A |
Altor Fund IV |
Northern European mid-market buyouts |
2014 |
14 |
27.6 |
19.6 |
24.7 |
4.1 |
2.7 |
1.3x |
Equistone Partners Europe Fund V |
European mid-market buyouts |
2015 |
24 |
4.2 |
20.7 |
24.1 |
4.0 |
2.9 |
1.2x |
CVC Capital Partners VI |
European and N. American mid to large buyouts |
2014 |
29 |
3.3 |
19.0 |
22.5 |
3.7 |
2.8 |
1.2x |
Nordic Capital Fund VII |
European complex buyouts & global healthcare |
2008 |
13 |
1.6 |
26.7 |
21.2 |
3.5 |
5.6 |
1.3x |
Top 10 at each date |
161 |
50.9 |
220.1 |
298.4 |
49.7 |
46.6 |
|||
Source: SLPET, Edison Investment Research. Note: Commitments, cost and valuation figures relate to SLPET’s interest.
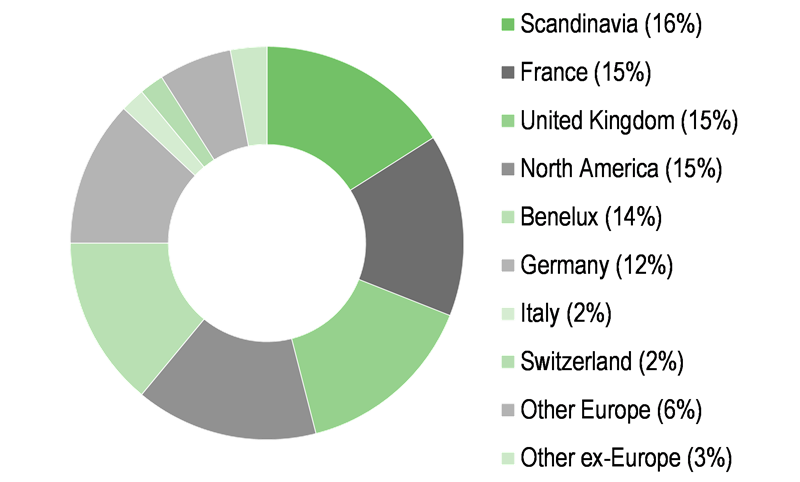
As shown in Exhibit 4, SLPET’s geographic and sector exposures at end-March 2018 reflect the broad diversification of the portfolio. SLPET’s exposure to North America declined to 15% at end-March 2018 from 19% a year earlier. This exposure relates primarily to European-based managers’ allocations to global deals; however, since the broadening of the investment policy in January 2017, the manager has started to add exposure to domestic US private equity managers. A secondary position in Onex Partners IV was acquired in H118 and a new primary commitment to MSouth Equity Partners IV was made more recently, with due diligence being undertaken on a number of other US funds. Sector exposures at end-March 2018 are similar to a year earlier, with the greatest changes being a 3pp decline in financials and a 2pp increase in both healthcare and technology.
|
Exhibit 4: Portfolio diversification by geography and sector at 31 March 2018 |
|
Geographic location of underlying investments by portfolio value |
Underlying investments sector exposure by portfolio value |
|
|
|
Source: SLPET, Edison Investment Research |
|
Performance: Strong medium-term returns
Exhibit 5 illustrates the strength of SLPET’s share price and NAV total returns in absolute terms over one, three and five years to 31 March 2018 (the latest reported NAV that is based on formal underlying fund valuations at the same date), while returns over 10 years include the effects of the 2008 financial crisis. A strong share price performance in 2017 was partly offset by share price weakness during the first three months of 2018, which brought the one-year share price return more closely into line with the NAV return. As shown in Exhibit 6, SLPET’s NAV total return outperformed its European private equity peers, represented by the LPX Europe index, over five years to 31 March 2018, while its performance was more closely in line with the index over one, three and 10 years. Compared with global private equity peers, represented by the LPX 50 index, SLPET’s share price and NAV total returns have outperformed over one, three and five years. Although lagging the LPX Europe index, SLPET’s share price total returns have outperformed the FTSE All-Share and MSCI Europe indices over one, three and five years, and its NAV total returns are ahead of both indices over all periods shown of less than 10 years.
|
Exhibit 5: Investment trust performance to 31 March 2018 |
|||||||
Price, NAV and index total return performance, one-year rebased |
Price, NAV and index total return performance (%) |
||||||
|
|
||||||
|
Source: Thomson Datastream, Edison Investment Research. Note: Three, five and 10-year performance figures annualised. |
|||||||
|
Exhibit 6: Share price and NAV total return performance, relative to indices (%) |
|||||||
|
Three months |
Six months |
One year |
Three years |
Five years |
10 years |
|
Price relative to LPX Europe |
(1.2) |
(1.7) |
(4.8) |
(1.1) |
(1.9) |
(16.4) |
|
NAV relative to LPX Europe NAV |
1.5 |
(1.5) |
(1.0) |
0.4 |
8.4 |
(1.2) |
|
Price relative to LPX 50 |
0.0 |
2.5 |
7.5 |
16.6 |
12.9 |
(14.6) |
|
NAV relative to LPX 50 NAV |
1.7 |
0.4 |
4.7 |
7.2 |
10.8 |
(4.5) |
|
Price relative to MSCI Europe |
0.3 |
1.6 |
7.5 |
29.0 |
32.3 |
(4.8) |
|
NAV relative to MSCI Europe |
4.3 |
5.8 |
5.8 |
24.6 |
17.7 |
(9.1) |
|
Price relative to FTSE All-Share |
1.9 |
(0.0) |
9.5 |
35.1 |
46.4 |
(7.4) |
|
NAV relative to FTSE All-Share |
6.0 |
4.1 |
7.8 |
30.5 |
30.3 |
(11.6) |
|
|
Source: Thomson Datastream, Edison Investment Research. Note: Data to end-March 2018. Geometric calculation. |
|||||||
Discount: Moderate recent widening
As illustrated in Exhibit 7, over the last five years SLPET’s share price discount to NAV has moved in a relatively wide range, from a high of 36.3% in March 2016 to its low of 7.5% in May 2017. The discount has widened from 7.5% in November 2017 to its current level of 15.7%, with SLPET’s share price declining while its NAV has remained broadly stable. The current discount is wider than its one-year average of 12.3%, but narrower than its 18.8% and 18.7% averages over three and five years, respectively.
|
Exhibit 7: Share price discount to NAV over five years (%) |
|
|
Source: Thomson Datastream, Edison Investment Research |
Capital structure and fees
SLPET has a single share class, with 153.7m ordinary shares in issue. The board considers share buybacks with regard to efficient capital management, in conjunction with new fund commitments, secondary fund purchases and dividend payments, and no repurchases have been made since August 2016 (see Exhibit 1). At 31 March 2018, SLPET’s £80m credit facility (which expires in December 2020) was undrawn and £81.3m was held in cash, money market funds and listed equities, equating to a 13.5% net cash position. In total, £13.0m of the £81.3m was held in listed equities as part of SLPET’s cash management process to reduce cash drag. At 31 May 2018, cash and equivalents had declined modestly to £76.5m, equating to a 12.8% net cash position.
Since FY17, SLPET has paid SL Capital Partners an annual management fee of 0.95% of NAV, and no performance fee is payable. Previously, SLPET paid a 0.80% annual management fee, with a five-yearly incentive fee of 10% on returns above 8% per year. Ongoing charges (excluding indirect fund fees) in FY17 were 1.14%.
Dividend policy and record
Holding the belief that a strong, stable dividend is attractive to shareholders, the board substantially increased the FY17 annual dividend, paying a total of 12.0p per share compared with 5.4p for FY16. The board remains committed to maintaining the real value of the dividend from this level, in the absence of unforeseen circumstances. From FY18, the board has moved to quarterly distributions, comprising three interims and a final dividend, which will be subject to shareholder approval. Four quarterly payments of 3.1p are planned for FY18, with the first two interim dividends already declared, and the 12.4p indicated total dividend represents a prospective yield of 3.8%. Dividends are paid from capital and revenue earnings.
Peer group comparison
Exhibit 8 shows a comparison of SLPET with a peer group of seven private equity funds of funds from the AIC Private Equity sector. SLPET’s NAV total return to end-March 2018 is ahead of the peer group average over one, three and five years but lower than average over 10 years. SLPET’s share price discount to NAV is wider than the peer group average, but slightly narrower than the 16.4% average when excluding F&C Private Equity Trust, which is differentiated from other peers by its shares trading close to NAV. SLPET’s 1.14% FY17 ongoing charge (excluding indirect fees) is one of the lowest in the peer group, and it is the sole member of the peer group that does not incur a performance fee directly or indirectly, in addition to the carried interest payments made to the underlying third-party managers. SLPET’s 3.8% yield, which reflects the planned 12.4p FY18 annual dividend, is the highest among the four dividend-paying funds in the peer group.
Exhibit 8: Selected private equity fund of funds peer group as at 12 July 2018*
% unless stated |
Region |
Mkt cap £m |
NAV TR 1 Year |
NAV TR 3 Year |
NAV TR 5 Year |
NAV TR 10 Year |
Discount (ex-par) |
Ongoing charge |
Perf. fee |
Net gearing |
Dividend yield (%) |
Standard Life Private Equity |
Europe |
508.1 |
9.1 |
54.8 |
79.3 |
68.4 |
(15.7) |
1.14 |
No |
100 |
3.8 |
F&C Private Equity Trust |
Global |
252.9 |
3.9 |
43.0 |
62.7 |
86.2 |
(1.7) |
1.24 |
Yes |
100 |
2.5 |
HarbourVest Global Private Equity |
Global |
1,031.8 |
3.3 |
41.4 |
85.3 |
189.3 |
(21.5) |
1.89 |
Yes |
100 |
0.0 |
ICG Enterprise Trust |
Europe |
597.0 |
13.2 |
50.8 |
68.7 |
110.8 |
(11.6) |
1.55 |
Yes |
100 |
2.4 |
JPEL Private Equity |
Global |
221.3 |
3.0 |
44.8 |
65.3 |
32.4 |
(15.1) |
1.86 |
Yes |
100 |
0.0 |
NB Private Equity Partners |
Global |
512.3 |
0.4 |
40.4 |
91.1 |
|
(19.3) |
1.91 |
Yes |
100 |
3.5 |
Pantheon International |
Global |
1,114.8 |
4.9 |
43.4 |
75.1 |
106.5 |
(15.3) |
1.13 |
Yes |
100 |
0.0 |
Average |
605.5 |
5.4 |
45.5 |
75.3 |
98.9 |
(14.3) |
1.53 |
100 |
1.7 |
||
Trust rank in peer group |
5 |
2 |
1 |
3 |
5 |
5 |
6 |
1= |
1 |
Source: Morningstar, Edison Investment Research. Note: *Performance data to 31 March 2018. TR = total return. All returns expressed in sterling terms. Net gearing is total assets less cash and equivalents as a percentage of net assets (100 = ungeared).
The board
SLPET’s board comprises six independent non-executive directors, following the appointment of Jonathon Bond in June 2018. Bond has over 30 years’ private equity industry experience, and is also a director of Jupiter Fund Management and executive chairman of the Skagen Group. Former institutional investment strategist Edmond Warner (appointed November 2008) became chairman in January 2013; he is also chairman of BlackRock Commodities Income Investment Trust. Senior independent director Christina McComb (appointed January 2013) has a private equity and venture capital background, having spent 14 years with 3i Group. Alan Devine (appointed May 2014) has 40 years’ experience in commercial and investment banking. Diane Seymour-Williams (appointed June 2017) spent 23 years at Deutsche Asset Management and nine years at LGM Investments; she is also a director of Witan Pacific Investment Trust and Brooks Macdonald Group. Calum Thomson (appointed November 2017) has over 25 years’ experience in financial services; he is also a director of Diverse Income Trust, British Empire Trust and Baring Emerging Europe.
|
|
Research: Healthcare
Quantum Genomics is a biopharmaceutical company investigating brain aminopeptidase A inhibitors, a new class of drug, for the treatment of hypertension and heart failure. Its lead programme, firibastat (QGC001), is in a 250-patient Phase IIb study in hypertensive overweight patients with patient dosing expected to be completed by the end of 2018 and data in Q119. Another Phase IIb in 300 subjects enrolled within 24 hours after suffering acute myocardial infarction (AMI) is expected to launch by the end of 2018 with results due in H220.