Last close As at 05/08/2026
GBP3.17
▲ 1.50 (0.48%)
Market capitalisation
GBP2,914m
Research: Investment Companies
Templeton Emerging Markets Investment Trust (TEMIT) has recently appointed Andrew Ness as portfolio manager alongside Chetan Sehgal. Ness is based in Edinburgh, providing investors with a more accessible presence in the UK. The managers are constructive on the outlook for emerging markets in 2019, as they believe corporate earnings growth in the regions will surpass that in developed markets and emerging market equity valuations are attractive. TEMIT has outperformed its benchmark in NAV terms over one, three and 10 years, while its share price has also outperformed over five years. The trust now pays a semi-annual, rather than single year-end distribution, and currently yields 2.0% (based on the FY18 dividend).
Templeton Emerging Markets Inv. Trust |
Managers positive on the 2019 outlook |
Investment trusts |
7 March 2019 |
Share price/discount performance
Three-year performance vs index
Gearing
Analysts
|
|||||||||||||||||||||||||||||||||||||||||||||||||||||||||||||||||||||||||||||||||||||||||||
Templeton Emerging Markets Investment Trust (TEMIT) has recently appointed Andrew Ness as portfolio manager alongside Chetan Sehgal. Ness is based in Edinburgh, providing investors with a more accessible presence in the UK. The managers are constructive on the outlook for emerging markets in 2019, as they believe corporate earnings growth in the regions will surpass that in developed markets and emerging market equity valuations are attractive. TEMIT has outperformed its benchmark in NAV terms over one, three and 10 years, while its share price has also outperformed over five years. The trust now pays a semi-annual, rather than single year-end distribution, and currently yields 2.0% (based on the FY18 dividend).
12 months ending |
Share price |
NAV |
MSCI Emerging |
MSCI World |
FTSE All-Share |
28/02/15 |
13.9 |
15.3 |
14.3 |
17.6 |
5.6 |
29/02/16 |
(27.0) |
(25.1) |
(14.8) |
(0.7) |
(7.3) |
28/02/17 |
62.2 |
60.3 |
45.5 |
36.6 |
22.8 |
28/02/18 |
21.7 |
20.1 |
18.3 |
6.6 |
4.4 |
28/02/19 |
(2.7) |
(5.8) |
(6.3) |
4.6 |
1.7 |
Source: Refinitiv. Note: All % on a total return basis in pounds sterling.
Investment strategy: Long-term, value-focused
Sehgal and Ness follow Franklin Templeton’s five-stage, bottom-up stock selection process: valuation-based stock screening; in-depth fundamental analysis; team peer review; portfolio allocation; and portfolio evaluation and attribution analysis. They aim to generate long-term capital growth from a fund of emerging market equities that is diversified by geography and sector, and is constructed without reference to TEMIT’s MSCI Emerging Markets performance benchmark. The trust’s largest overweight sector exposures are communication services and technology, while it is underweight the cyclical materials and industrials sectors. Gearing up to 10% of NAV is permitted; at end-February 2019, net gearing was 1.7%.
Market outlook: Reasons to be optimistic
Emerging markets offer the prospect of higher economic growth and lower equity valuations compared with developed markets. During 2018, emerging markets suffered from outflows, as investors focused on the strong US economy, where corporate profits were supported by lower taxes. These tax benefits will wane in 2019 and there are reasons to be more optimistic about the prospects for emerging markets, such as policy changes to support the Chinese economy, and a more benign political environment in Latin America.
Valuation: Narrowed discount; new dividend policy
TEMIT’s current 9.3% share price discount to cum-income NAV is narrower than the 12.1% to 12.7% range of average discounts over the last one, three and five years. Starting in FY19, shareholders will receive an interim dividend in January and a final dividend in July, rather than a single annual distribution. Based on the 15.0p FY18 dividend, TEMIT currently offers a 2.0% yield. The trust’s first interim dividend of 5.0p per share was paid in January 2019.
Exhibit 1: Trust at a glance
Investment objective and fund background |
Recent developments |
||||||||||||||||||||||||||||||||||||||||||||||||||||||||||||||||||||||
Launched in June 1989, TEMIT was one of the first emerging markets funds in the UK. The trust seeks long-term capital appreciation through investment in companies operating in emerging markets, or listed on the stock markets of such countries. This may include companies that have a significant amount of their revenues in emerging markets, but which are listed on stock exchanges in developed countries. Performance is benchmarked against the MSCI Emerging Markets Index. |
■ 26 November 2018: Interim report to 30 September 2018. NAV TR -1.5% versus benchmark TR -1.8%. Share price TR -2.2%. Announcement of 5.0p interim dividend. ■ 3 September 2018: Announcement of increased revolving credit with The Bank of Nova Scotia (£220m versus £150m). ■ 23 July 2018: Appointment of manager Andrew Ness to work closely alongside lead manager, Chetan Sehgal. |
||||||||||||||||||||||||||||||||||||||||||||||||||||||||||||||||||||||
Forthcoming |
Capital structure |
Fund details |
|||||||||||||||||||||||||||||||||||||||||||||||||||||||||||||||||||||
AGM |
July 2019 |
Ongoing charges |
0.98% |
Group |
Templeton Asset Management |
||||||||||||||||||||||||||||||||||||||||||||||||||||||||||||||||||
Final results |
June 2019 |
Net gearing |
1.7% |
Managers |
Chetan Sehgal and Andrew Ness |
||||||||||||||||||||||||||||||||||||||||||||||||||||||||||||||||||
Year end |
31 March |
Annual mgmt fee |
0.85–1.0% of net assets (see page 7) |
Address |
5 Morrison Street, Edinburgh, |
||||||||||||||||||||||||||||||||||||||||||||||||||||||||||||||||||
Dividend paid |
July and January |
Performance fee |
None |
||||||||||||||||||||||||||||||||||||||||||||||||||||||||||||||||||||
Launch date |
12 June 1989 |
Trust life |
Indefinite (subject to vote) |
Phone |
+44 (0)871 384 2505 |
||||||||||||||||||||||||||||||||||||||||||||||||||||||||||||||||||
Continuation vote |
Five yearly (next in 2019) |
Loan facilities |
£220m |
Website |
|||||||||||||||||||||||||||||||||||||||||||||||||||||||||||||||||||
Dividend policy and history (financial years) |
Share buyback policy and history (financial years) |
||||||||||||||||||||||||||||||||||||||||||||||||||||||||||||||||||||||
FY18 dividend was boosted by a change in fee allocations. Dividends were historically paid annually in July, but starting in FY19, will be paid twice a year in July and January. |
Renewed annually, TEMIT is authorised to repurchase up to 14.99% and allot up to 5% of its issued ordinary shares. |
||||||||||||||||||||||||||||||||||||||||||||||||||||||||||||||||||||||
|
|
||||||||||||||||||||||||||||||||||||||||||||||||||||||||||||||||||||||
Shareholder base (as at 31 January 2019) |
Portfolio exposure by geography (as at 28 February 2019) |
||||||||||||||||||||||||||||||||||||||||||||||||||||||||||||||||||||||
|
|
||||||||||||||||||||||||||||||||||||||||||||||||||||||||||||||||||||||
Top 10 holdings (as at 28 February 2019) |
|||||||||||||||||||||||||||||||||||||||||||||||||||||||||||||||||||||||
|
|||||||||||||||||||||||||||||||||||||||||||||||||||||||||||||||||||||||
Source: Templeton Emerging Markets Investment Trust, Edison Investment Research, Bloomberg, Morningstar. Note: *N/A where not in end-February 2018 top 10.
Market outlook: Potential for outperformance in 2019
Exhibit 2 (LHS) shows that over the last five years, emerging market equities have lagged the world market, but delivered meaningfully higher returns than UK equities. Emerging markets performed particularly strongly from the beginning of 2016 to the end of 2017, a period characterised by continued easy monetary conditions and improving global growth. Market conditions became less benign in 2018, as global stock markets returned to more normal levels of volatility; investor concerns included slowing growth in China, rising US interest rates and a strong US dollar. During 2018, there were significant fund flows into the US and out of other regions, as the American economy and corporate profits were buoyed by lower taxes. Benefits from this stimulus should wane this year and in its January 2019 World Economic Outlook update, the International Monetary Fund reiterated its forecasts for higher GDP growth in emerging markets and developing economies in 2019 compared with world and advanced economies’ output. As shown in Exhibit 2 (RHS), the valuation of emerging market equities remains relatively attractive across a variety of metrics, compared with shares globally. These growth and valuation differentials offer the prospect for relative outperformance of emerging market equities, particularly when considering regional factors such as the Chinese authorities’ efforts to stimulate the domestic economy, and a much quieter election calendar in 2019 in Latin America compared with 2018.
|
Exhibit 2: Market performance and valuation |
|
Performance of indices in £ (last five years) |
Valuation metrics (as at 28 February 2019) |
|
|
|
Source: Refinitiv, Edison Investment Research, MSCI |
|
Fund profile: Diversified emerging market exposure
TEMIT was launched in June 1989 and is quoted on the London and New Zealand stock exchanges. It is managed by the Franklin Templeton Emerging Markets Equity group (FTEME), a pioneer in emerging markets. The firm has more than 90 investment professionals based in 22 regional offices across the globe, providing local insights, corporate access and a global perspective. Since 1 February 2018, TEMIT’s lead manager has been Chetan Sehgal (following the departure of Carlos Hardenberg). The investment team has recently been strengthened with the appointment in September 2018 of Edinburgh–based manager Andrew Ness, who provides a more accessible presence for TEMIT in the UK. Sehgal and Ness aim to generate long-term capital growth from a diversified portfolio of companies listed in emerging markets or companies listed in developed markets that generate a significant percentage of their revenues in emerging markets.
The investment process is disciplined and bottom-up, seeking undervalued securities that can be held for the long term. TEMIT’s performance benchmark is the MSCI Emerging Markets Index and at the time of investment, it can allocate a maximum 10% of assets to a single issuer. The trust can gear up to 10% of net assets; at end-February 2019, net gearing was a modest 1.7%.
The fund managers: Chetan Sehgal and Andrew Ness
The managers’ view: Constructive on the 2019 outlook
TEMIT’s new manager Andrew Ness explains that 2018 was a difficult year for all asset classes, with cash outperforming, which is a very unusual event. Within emerging markets, the Chinese economy slowed, as the authorities sought to rein in off-balance-sheet financing and the US/China trade dispute affected sentiment, despite the fact that China is becoming less reliant on exports to fuel its economic growth. Ness explains that the narrative surrounding higher US interest rates also affected investor sentiment, despite evidence to the contrary; he says that in the last four cycles when the Federal Reserve raised US interest rates, emerging markets outperformed developed markets, as higher rates are typically a response to more robust global growth.
During 2018, the strong US dollar was also a significant headwind for emerging markets, and there were contagion fears following currency crises in Argentina and Turkey, although these concerns proved to be unfounded. The manager explains that, compared with history, many emerging market countries now have more flexible foreign exchange policies, are running current account surpluses, rather than deficits, and have more conservative fiscal policies. To put the structure of emerging markets into context, there are now more than 20 companies in these regions with market caps greater than the whole Argentine and Turkish stock markets.
Emerging market equities underperformed US stocks in 2018, due to the positive impacts of tax reform and the repatriation of overseas assets, which led to strong GDP and corporate earnings growth. Ness notes that these tailwinds will be less supportive in 2019, and he expects corporate earnings growth in emerging markets to be more robust than in developed regions. He says that this situation is generally supportive for the outperformance of emerging market equities and adds that, over the last two-to-three years, in aggregate, emerging market companies have generated higher levels of cash flow and there have been increased payouts in the form of dividends and share repurchases by a range of companies, such as Samsung Electronics and major Russian energy companies, while the importance of good corporate governance is starting to resonate. Ness also notes that the valuation backdrop for emerging markets remains supportive; based on prior cycles its current attractive price-to-book multiple could lead to relative outperformance by the developing regions. In addition, current P/E multiples of c 13.0x trailing and c 11.5x forward are towards the low end of the 20-year range, while the c 25% P/E multiple discount, on current year earnings, compared with developed markets, is also at the wide end of the historical range.
Ness explains that emerging market companies have changed over the last 20 years in terms of the quality of cash flows and capital returns. The MSCI Emerging Markets index now has lower cyclical industrial and materials exposure, with more companies in higher-growth businesses such as media and technology, so he considers emerging market equities to have become a higher-quality asset class. Ness also suggests that, given technology is typically a higher-multiple sector, emerging markets are even more inexpensive compared with developed markets.
The manager offers his perspectives on China, suggesting that the authorities have learnt lessons from prior stimulus cycles; they are reluctant to focus solely on loan-based growth, which in the short term has curtailed economic output. However, he notes that China is a unique market; a self-contained economy with a lot of state-generated credit, which provides policy levers to manage growth. Ness notes that it is difficult to forecast China’s GDP growth, so when investing in the country, it is important to focus on bottom-up company analysis. Small and medium enterprises (SMEs) had experienced tighter credit conditions in 2018, but the stance has softened and the authorities are encouraging banks to provide more credit. The manager says that it remains to be seen if this easing is sufficient to stabilise the contraction in Chinese economic growth, but notes other positive factors in the country, such as more normalised levels of property inventory compared with the levels in 2015/16, while the current level of electricity demand provides a good indicator of steady underlying economic activity. However, Ness is cognizant of the fact that, while corporate profits are still growing, China still has a lot of debt, which could ultimately become a problem for growth.
Asset allocation
Investment process: Research-based, long-term value approach
The managers follow FTEME’s investment approach, aiming to benefit from the long-term structural growth and innovation in emerging markets. The process is research intensive, seeking undervalued companies that can be held for the long term, across different stages of the economic cycle. Over the short term, emerging market equities may be volatile, reacting to ‘market noise’; however, the managers believe that, over the long term, markets are efficient and a company’s value will be realised. There are five stages to the investment process:
■
Identification of potentially undervalued companies – a key benefit is FTEME’s large and experienced research team, which has an extensive network of local contacts across the globe.
■
In-depth fundamental research – bottom-up analysis including assessment of a company’s long-term worth. Company meetings are a key element of the process.
■
Team review – FTEME employs a collaborative approach.
■
Portfolio construction – TEMIT’s portfolio is made up of the team’s best ideas. It is diversified by geography and sector in order to diversify risk, and has relatively low turnover.
■
Portfolio evaluation and attribution analysis – the portfolio is reviewed weekly, and in more depth every six months to evaluate methodology, team resources, themes, issues at a country level, and global trends. The fund is also regularly reviewed by an independent risk management group.
Changes to the portfolio are made based on relative price moves. A position may be sold on valuation grounds; when there is a change in the investment thesis and a loss in conviction; or, most commonly, when a superior opportunity is identified.
FTEME’s global footprint comprises more than 80 investment professionals in 22 regional offices. While Sehgal, TEMIT’s lead manager, is based in Singapore and Ness is based in Edinburgh, Ness explains that they manage the trust’s portfolio together and communicate with one another every day. In terms of other more formal lines of communication, there are four team meetings a week. Three team-wide video calls to discuss company meeting feedback, internal published research and any other news (there is mandatory participation by all regional teams), and a one and a half hour research session, with a clearly defined topic. This is typically a 30-minute presentation followed by an hour of discussion, covering top stock recommendations, news and regulatory issues, along with ideas and insights from across the team. There is also another global meeting, with around six senior team members, covering recent investment conclusions reached, transactions undertaken, and what is happening over the next week. These meetings highlight that although FTEME’s operations are spread around the world, the investment team works closely together, with clear lines of communication.
Ness explains that he is also bringing his outside experience to the team, by working with FTEME’s head of research to prioritise collaboration, such as earlier-stage conversations between the fund managers and analysts when initiating fundamental analysis on a company, and boosting information flow. Ness believes that this increased collaboration will enhance portfolio performance and risk management. The manager also believes there needs to be a greater focus on reporting on the high level of company engagement, given that active management requires responsible stewardship of client capital; Ness is confident in the enduring positive impact of engagement.
Current portfolio positioning
Ness reiterates that TEMIT’s investment approach is index agnostic; all the geographic and sector exposures (Exhibits 3 and 4) are a result of bottom-up stock selection. The trust’s active share is at the lower end of the 75–85% three-year range. (Active share is a measure of how a fund differs from its benchmark, with 0% representing full replication, and 100% zero commonality.) This reflects higher conviction in large-cap names, and a marginal shift away from non-benchmark stocks. The manager explains that the team intends to keep TEMIT’s active share within the above range, in keeping with the aim of having a well-diversified portfolio of stocks selected on a bottom-up basis. Fund turnover is relatively low at c 20% pa, as the managers are patient long-term investors who believe in the benefits of a company’s compounding cash flows over time.
Looking at the trust’s top 10 holdings (Exhibit 1) it is overweight in Tencent through its direct underweight holding and its indirect exposure through Naspers (overweight). The managers prefer Naspers as they believe it offers better relative value; the company’s management is working hard to narrow the discounted valuation of its stake in Tencent, such as by spinning off its South African TV assets, which are a cash cow, and taking full control, by acquiring the remaining minority holdings, of Avito, Russia’s largest classified advertising platform.
Exhibit 3: Portfolio sector exposure vs benchmark (% unless stated)
Portfolio end-February 2019 |
Portfolio end- February 2018 |
Change |
Index |
Active weight |
Trust weight/ |
|
Financials |
26.9 |
23.3 |
3.6 |
24.6 |
2.3 |
1.1 |
Information technology |
19.5 |
31.4 |
(11.9) |
14.6 |
4.9 |
1.3 |
Communication services |
17.1 |
1.0 |
16.1 |
12.0 |
5.1 |
1.4 |
Consumer discretionary |
15.8 |
20.8 |
(5.0) |
13.2 |
2.6 |
1.2 |
Energy |
7.7 |
7.6 |
0.1 |
8.1 |
(0.4) |
1.0 |
Consumer staples |
6.6 |
7.0 |
(0.4) |
6.4 |
0.2 |
1.0 |
Materials |
3.3 |
6.1 |
(2.8) |
7.4 |
(4.1) |
0.4 |
Industrials |
2.4 |
2.8 |
(0.4) |
5.4 |
(3.0) |
0.4 |
Healthcare |
2.0 |
1.6 |
0.4 |
2.7 |
(0.7) |
0.7 |
Real estate |
0.4 |
0.6 |
(0.2) |
3.0 |
(2.6) |
0.1 |
Utilities |
0.0 |
0.2 |
(0.2) |
2.6 |
(2.6) |
0.0 |
Other net assets |
(1.7) |
(2.4) |
0.7 |
0.0 |
(1.7) |
N/A |
100.0 |
100.0 |
100.0 |
Source: Templeton Emerging Markets Investment Trust, Edison Investment Research
The year-on-year changes in sector exposure are somewhat misleading as during the period several companies within the index were reclassified due to changes in the Global Industry Classification Standard (GICS) definitions. Broadly, the telecoms sector was enlarged and renamed as communication services; it now includes some companies that were previously classified as consumer discretionary and technology stocks. It is more meaningful to consider TEMIT’s breakdown versus the benchmark; its largest overweight exposures are communication services (+5.1pp) and information technology (+4.9pp), while its largest underweight exposures are materials (-4.1pp) and industrials (-3.0pp).
Exhibit 4: Portfolio geographic exposure (% unless stated)
Portfolio end-February 2019 |
Portfolio end-February 2018 |
Change (pp) |
|
China/Hong Kong |
23.5 |
23.1 |
0.4 |
South Korea |
14.3 |
14.2 |
0.1 |
Taiwan |
9.8 |
9.8 |
0.0 |
Brazil |
9.3 |
9.1 |
0.2 |
Russia |
8.7 |
9.3 |
(0.6) |
South Africa |
7.2 |
6.9 |
0.3 |
India |
7.0 |
5.3 |
1.7 |
Thailand |
4.4 |
5.2 |
(0.8) |
Indonesia |
3.3 |
4.0 |
(0.7) |
UK |
2.9 |
2.9 |
0.0 |
Other |
9.6 |
10.2 |
(0.6) |
100.0 |
100.0 |
Source: Templeton Emerging Markets Investment Trust, Edison Investment Research
TEMIT’s geographic exposures are broadly unchanged over the last 12 months (Exhibit 4). The manager explains that in 2018, there were just eight new positions initiated and seven complete disposals; there were no wholesale changes to the portfolio when Sehgal became lead manager in February 2018. New positions include China Resources Cement, one of the largest and most efficient cement producers in China, operating in a region with less price competition; and Cognizant, a US-listed IT services company that was trading at a significant discount to its peers Infosys and TCS.
Ness believes that TEMIT’s portfolio is well positioned, reflecting the managers’ best ideas and diversified across a broad range of countries and sectors; he also comments that the fund has low factor characteristics, which may make performance less affected by market trends. While the trust has access to a global analyst footprint with a strong capability in frontier countries, the manager says that there are plenty of opportunities available in traditional emerging markets.
Performance: Stronger start to 2019
During 2018, TEMIT’s NAV and share price total returns of -11.6% and -10.7% lagged the benchmark’s -8.9% total return. Ness explains that this underperformance was purely a result of the trust’s holding in Brilliance China Automotive, which performed particularly poorly; its share price fell by c 70%, having risen by c 80% in 2017. Parent company BMW bought out part of the joint venture on, what investors considered to be, unfavourable terms with regards to timing and valuation. The manager says that, operationally, Brilliance China Automotive remains very well positioned, and TEMIT’s holding was increased following the severe share price weakness.
Positive contributors to the trust’s performance in 2018 included: Peruvian miner Compania de Minas Buenaventura (BVN), major oil companies Lukoil (Russia) and CNOOC (China), and Brazilian banks Banco Bradesco and Itaú Unibanco.
|
Exhibit 5: Investment trust performance to 28 February 2019 |
|
Price, NAV and benchmark total return performance, one-year rebased |
Price, NAV and benchmark total return performance (%) |
|
|
|
Source: Refinitiv, Edison Investment Research. Note: Three, five and 10-year performance figures annualised. |
|
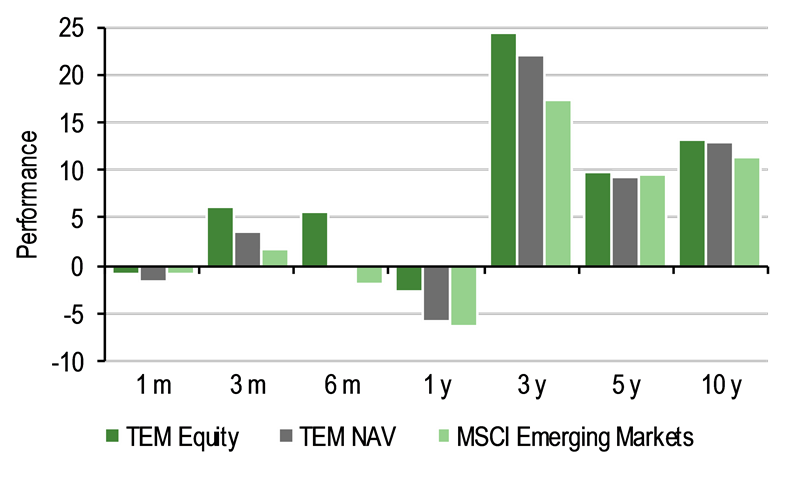
TEMIT’s relative returns are shown in Exhibit 6; its NAV has outperformed the MSCI Emerging Markets index benchmark over one, five and 10 years, while its share price has also outperformed over five years. For UK investors, it is also interesting to note the trust’s meaningful outperformance versus the FTSE All-Share index over three, five and 10 years. Considering TEMIT’s relative performance over the last three years (Exhibit 7), the trust had a strong period of performance between early 2016 and late 2017, and results have improved somewhat in recent months following a period of relative weakness from late 2017 to mid-2018.
|
Exhibit 6: Share price and NAV total return performance, relative to indices (%) |
||||||||
|
One month |
Three months |
Six months |
One year |
Three years |
Five years |
10 years |
|
Price relative to MSCI Emerging Markets |
0.1 |
4.2 |
7.7 |
3.8 |
19.1 |
1.7 |
16.1 |
|
NAV relative to MSCI Emerging Markets |
(0.7) |
1.7 |
1.8 |
0.5 |
12.4 |
(0.3) |
13.7 |
|
Price relative to MSCI World |
(2.7) |
7.8 |
11.7 |
(7.0) |
26.2 |
(10.1) |
(11.1) |
|
NAV relative to MSCI World |
(3.4) |
5.2 |
5.5 |
(10.0) |
19.0 |
(11.9) |
(12.9) |
|
Price relative to FTSE All-Share |
(3.0) |
3.5 |
9.8 |
(4.3) |
47.4 |
25.2 |
19.1 |
|
NAV relative to FTSE All-Share |
(3.7) |
1.0 |
3.7 |
(7.4) |
39.0 |
22.8 |
16.6 |
|
|
Source: Refinitiv, Edison Investment Research. Note: Data to end-February 2019. Geometric calculation. |
||||||||
|
Exhibit 7: NAV total return performance relative to benchmark over three years |
||||||||
|
||||||||
|
Source: Refinitiv, Edison Investment Research |
||||||||
Discount: In a narrowing trend
TEMIT’s discount has been in a narrowing trend in recent months, despite volatility in emerging market equities; its current 9.3% share price discount to cum-income NAV compares with a 15.2% discount in early June 2018. The trust is now trading at a narrower discount than its averages over the last one, three, and five (range of 12.1% to 12.7%). As shown in Exhibit 1, the board actively repurchases shares, aiming to manage the discount. In H119, 13.9m shares (5.1% of the end-FY18 share base) were bought back at a cost of c £100m and an average discount of 13.4%.
|
Exhibit 8: Share price discount to NAV (including income) over three years (%) |
|
|
Source: Refinitiv, Edison Investment Research |
Capital structure and fees
TEMIT is a conventional investment trust with one class of share; there are currently 252.4m shares in issue, with a further 20.8m held in treasury. On 31 August 2018, the board announced changes to TEMIT’s gearing facility. It now has a three-year, unsecured, multicurrency revolving loan facility with The Bank of Nova Scotia. Up to £220m (previously £150m) may be drawn, in sterling, US dollars and Chinese renminbi (maximum equivalent to £44m versus previous limit of £30m). If TEMIT had taken full advantage of the gearing facility, at end-August 2018, gross gearing would have been c 10% of NAV; the maximum level permitted. While mindful of the heightened risks when employing debt, the board believes that the long-term outlook for emerging markets is positive and interest rates remain low versus history, so a higher borrowing facility, to be utilised when considered appropriate, is in the long-term interests of shareholders. At end-February 2019, TEMIT had a modest 1.7% net gearing. The managers are hesitant to increase gearing while there are significant macro uncertainties, such as the China/US trade dispute, for example; however, they will be looking for suitable opportunities to draw down more debt later in the year.
With effect from 1 July 2018, Templeton is paid a 1.0% annual management fee on net assets up to £1bn and 0.85% on net assets above that level (previously 1.0% up to £2bn and 0.85% above this, and prior to 1 July 2017, a flat 1.1% fee); no performance fee is payable. Since 1 April 2017, 70% of the annual management fee and borrowing costs have been allocated to the capital rather than revenue account. The 70:30 ratio reflects the board’s expectation of the long-term split between TEMIT’s capital and revenue returns. Ongoing charges in FY18 were 1.12% (FY17: 1.20%). The trust is subject to a five-year continuation vote, next due at the July 2019 AGM.
Dividend policy and record
Starting in FY19, TEMIT will pay an interim dividend in January and a final dividend in July, rather than a single dividend in July. In FY18, TEMIT’s annual distribution of 15.0p was 82% higher than the 8.25p paid in FY17, helped by the reallocation of expenses highlighted above; it was 1.06x covered. The trust currently offers a 2.0% dividend yield (based on the 15.0p FY18 payment). TEMIT has meaningful revenue reserves (£110.8m at end-H119, which is equivalent to c 2.8x the FY18 distribution). The first interim dividend of 5.0p per share was paid in January 2019.
Peer group comparison
Exhibit 9: Selected peer group as at 6 March 2019*
% unless stated |
Market cap (£m) |
NAV TR |
NAV TR |
NAV TR |
NAV TR |
Discount (cum fair) |
Ongoing charge |
Perf. |
Net gearing |
Dividend yield |
Templeton Emerging Markets IT |
1,887.7 |
(4.2) |
72.4 |
57.1 |
244.6 |
(9.3) |
1.1 |
No |
102 |
2.0 |
Aberdeen Emerging Markets |
254.2 |
(6.6) |
47.2 |
50.9 |
148.1 |
(14.1) |
1.0 |
No |
102 |
0.3 |
BlackRock Frontiers |
324.9 |
(11.8) |
41.6 |
43.6 |
|
0.7 |
2.0 |
Yes |
120 |
4.3 |
Fundsmith Emerging Equities Trust |
326.4 |
(0.5) |
28.9 |
|
|
1.2 |
1.9 |
No |
100 |
0.0 |
Genesis Emerging Markets Fund |
938.0 |
(3.7) |
45.7 |
46.9 |
235.5 |
(11.8) |
1.5 |
No |
100 |
2.1 |
JPMorgan Emerging Markets |
1,099.0 |
(0.6) |
60.6 |
77.2 |
263.7 |
(9.4) |
1.0 |
No |
100 |
1.4 |
JPMorgan Global Emerging Markets |
387.3 |
(1.8) |
55.9 |
52.5 |
|
(1.3) |
1.3 |
No |
107 |
3.8 |
Utilico Emerging Markets |
503.3 |
(0.8) |
36.8 |
45.0 |
228.8 |
(11.6) |
1.1 |
Yes |
100 |
3.3 |
Average (8 trusts) |
715.1 |
(3.8) |
48.6 |
53.3 |
224.2 |
(6.9) |
1.4 |
104 |
2.5 |
|
TEM rank in peer group |
1 |
6 |
1 |
2 |
2 |
4 |
6 |
4 |
5 |
Source: Morningstar, Edison Investment Research. Note: *Performance as at 5 March 2019 based on ex-par NAVs. TR=total return. Net gearing is total assets less cash and equivalents as a percentage of net assets.
Exhibit 9 shows the eight members of the AIC Global Emerging Markets sector that have been trading for more than a year and have a market cap higher than £200m; TEMIT is by far the largest fund in this selected peer group. TEMIT’s NAV total return ranks sixth over 12 months, which was a period characterised by high market volatility. However, the trust’s results are much stronger over the other periods shown, ranking first out of eight funds over three years (a significant 23.8pp above the mean); second out of seven over five years (3.8pp above average); and second out of five over 10 years (20.4pp above average). The trust’s discount is wider than average, in a group where only two funds are trading at a premium. TEMIT has a competitive ongoing charge, and a lower than average level of gearing and dividend yield compared with the selected peer group.
The board
TEMIT’s board has six directors; five of whom are independent. Paul Manduca is the chairman (he joined the board in August 2015 and assumed his current role three months later). Beatrice Hollond was appointed in April 2014, Simon Jeffreys in July 2016 and David Graham in September 2016. The newest director is Charlie Ricketts, who was appointed at the July 2018 AGM, following the retirement of Hamish Buchan, who had served on the board since June 2008. Ricketts has more than 30 years’ investment trust experience, including eight years as head of investment funds at Cenkos Securities. Gregory Johnson was appointed in December 2007; as he is the chairman and CEO of Franklin Resources, the parent company of the investment manager, he is considered to be non-independent.
|
|
Research: Consumer
bet-at-home (BAH) is a long-established European sports betting brand, successfully cross-selling into gaming. Regulatory risks are high, as witnessed by IP blocking in Poland and Switzerland and the company has issued guidance of a c 10–20% decline in EBITDA for FY19. Nonetheless, BAH has consistently produced strong operating cash flow and its ability to pay high dividends is very attractive. The stock is up 28% ytd and trades at 14.9x P/E, 10.9x EV/EBITDA and 8.5% dividend yield for FY19e.