Last close As at 06/08/2026
—
— 0.00 (0.00%)
Market capitalisation
—
Research: Investment Companies
UK Commercial Property REIT (UKCM) achieved a 10.6% NAV total return over the year to the end of June 2018, but its share price has lagged its steadily rising NAV and its discount has widened to 5.2%, among the widest in its UK direct property peer group. In July 2018, UKCM became a UK REIT to mitigate the risk of significant potential tax charges falling due from 2020 and agreed a reduced management fee, effective January 2019. UKCM is significantly overweight in the industrial sector, which is expected to continue to lead market performance, while exposure to the weaker retail sector has been reduced. The manager sees considerable scope for near- and medium-term earnings improvement from the portfolio’s reversionary potential, which implies c 26% upside to rental income if market rates are achieved across all property assets.
Written by
UK Commercial Property REIT |
Making steady progress in uncertain times |
Investment companies |
3 September 2018 |
Share price/discount performance
Three-year performance vs index
Gearing
Analysts
|
|||||||||||||||||||||||||||||||||||||||||||||||||||||||||||||||||||||||||||||||||||||||||||||||
UK Commercial Property REIT (UKCM) achieved a 10.6% NAV total return over the year to the end of June 2018, but its share price has lagged its steadily rising NAV and its discount has widened to 5.2%, among the widest in its UK direct property peer group. In July 2018, UKCM became a UK REIT to mitigate the risk of significant potential tax charges falling due from 2020 and agreed a reduced management fee, effective January 2019. UKCM is significantly overweight in the industrial sector, which is expected to continue to lead market performance, while exposure to the weaker retail sector has been reduced. The manager sees considerable scope for near- and medium-term earnings improvement from the portfolio’s reversionary potential, which implies c 26% upside to rental income if market rates are achieved across all property assets.
12 months ending |
Share price |
NAV |
Benchmark |
UK Real Estate |
FTSE All-Share (%) |
30/06/14 |
13.9 |
21.0 |
16.3 |
22.7 |
13.1 |
30/06/15 |
16.5 |
14.3 |
15.3 |
20.8 |
2.6 |
30/06/16 |
(17.2) |
5.7 |
8.9 |
(10.1) |
2.2 |
30/06/17 |
33.6 |
7.2 |
5.8 |
9.8 |
18.1 |
30/06/18 |
(0.4) |
10.6 |
9.8 |
9.3 |
9.0 |
Source: Thomson Datastream. Note: 12-month rolling discrete total return performance in sterling terms up to last reported NAV date.
Investment strategy: Focused on prime assets
UKCM aims to produce a sustainable income from a focused portfolio of prime UK commercial property assets. A largely unrestricted bottom-up investment approach is adopted, but sector and regional allocations broadly follow the investment manager’s market views. The manager prefers to hold resilient assets, such as multi-let industrial properties, which reduce exposure to individual tenants, thus reducing void risk. Drawing on the local market knowledge of Aberdeen Standard Investments’ extensive property team, the manager seeks to add value by identifying market developments before they are reflected in pricing, and actively managing the portfolio to improve the rental value of properties.
Market outlook: Resilient income a key factor
UK GDP growth is forecast to be below its future long-term trend in 2018 and 2019, with Brexit uncertainty affecting market sentiment. Within commercial property, the industrial sector is expected to continue to lead near-term market performance, although alternative sectors are likely to remain popular with investors, and asset selection within sectors is likely to become increasingly important. Relatively modest property market returns are anticipated over the medium term, with income the key driver and asset management initiatives providing upside potential.
Valuation: Share price lagging a steadily rising NAV
After reaching a 5% premium to NAV in June 2017, UKCM’s share price moved back below NAV in October 2017. Despite a steadily rising NAV per share, the share price has remained relatively flat in 2018. As a result, the discount has widened, and the shares are currently trading at a 5.2% discount to EPRA NAV.
Exhibit 1: Company at a glance
Investment objective and fund background |
Recent developments |
||||||||||||||||||||||||||||||||||||||||||||||||||||||||||||||||||
UKCM’s objective is to provide ordinary shareholders with an attractive level of income, together with the potential for capital and income growth, by investing in a diversified UK commercial property portfolio. Investments primarily comprise direct holdings in the industrial, retail and office sectors, and UKCM also has some exposure to the smaller leisure and hotel sectors. The preferred lot size range is £20m to £70m, with a focus on investments between £30m and £50m. |
■ 2 August 2018: New lower, tiered management fee structure announced, effective January 2019 – 0.60% on total assets up to £1.75bn; 0.475% above £1.75bn. ■ 2 August 2018: Quarterly results to 30 June 2018 – NAV total return +2.2% vs +1.9% benchmark return; 0.92p dividend declared for Q218 vs 0.92p for Q217. ■ 5 July 2018: c £51m acquisition of the White Building, a multi-let office in Reading. ■ 5 July 2018: Disposal of 1 Rivergate office building in Bristol for £27.6m. ■ 1 July 2018: Company entered the UK REIT regime and changed name to UK Commercial Property REIT. ■ 27 June 2018: New 15-year lease agreed at Ventura Park industrial estate in Radlett. ■ 3 May 2018: Quarterly results to 31 March 2018 – NAV total return +1.6% vs +2.0% benchmark return; 0.92p dividend announced for Q118 vs 0.92p for Q117. |
||||||||||||||||||||||||||||||||||||||||||||||||||||||||||||||||||
Forthcoming |
Capital structure |
Fund details |
|||||||||||||||||||||||||||||||||||||||||||||||||||||||||||||||||
AGM |
June 2019 |
Ongoing charges |
1.5% |
Group |
Aberdeen Standard Investments |
||||||||||||||||||||||||||||||||||||||||||||||||||||||||||||||
Final results |
April 2019 |
Net gearing |
11.9% loan to value |
Manager |
Will Fulton |
||||||||||||||||||||||||||||||||||||||||||||||||||||||||||||||
Year end |
31 December |
Annual mgmt fee |
0.65% of total assets (0.60% and 0.475% from Jan 2019 – see page 7) |
Address |
1 George Street, Edinburgh EH2 2LL |
||||||||||||||||||||||||||||||||||||||||||||||||||||||||||||||
Dividend paid |
May, Aug, Nov, Feb |
Performance fee |
None |
||||||||||||||||||||||||||||||||||||||||||||||||||||||||||||||||
Launch date |
20 September 2006 |
Company life |
Indefinite (subject to vote) |
Phone |
0345 600 2268 |
||||||||||||||||||||||||||||||||||||||||||||||||||||||||||||||
Continuation vote |
2020 and seven yearly |
Loan facilities |
£300m total (£250m drawn) |
Website |
|||||||||||||||||||||||||||||||||||||||||||||||||||||||||||||||
Dividend policy and history (financial years) |
Share buyback policy and history (financial years) |
||||||||||||||||||||||||||||||||||||||||||||||||||||||||||||||||||
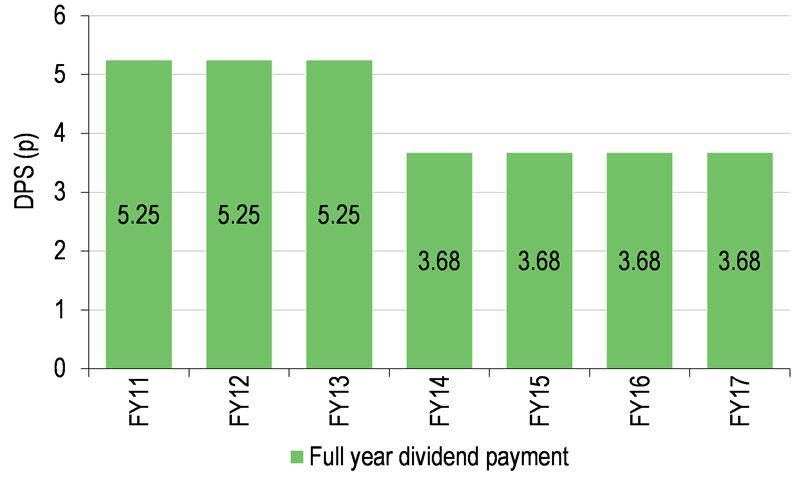
UKCM pays dividends quarterly. A key objective is to provide an attractive sustainable level of income to shareholders. The dividend was rebased in 2014. |
UKCM has authority to purchase up to 14.99% and allot up to 10% of its issued share capital. There have been no capital changes since 2014. |
||||||||||||||||||||||||||||||||||||||||||||||||||||||||||||||||||
|
|
||||||||||||||||||||||||||||||||||||||||||||||||||||||||||||||||||
Shareholder base (as at 30 June 2018) |
Portfolio exposure by region (as at 30 June 2018) |
||||||||||||||||||||||||||||||||||||||||||||||||||||||||||||||||||
|
|
||||||||||||||||||||||||||||||||||||||||||||||||||||||||||||||||||
Top 10 holdings (as at 30 June 2018) |
|||||||||||||||||||||||||||||||||||||||||||||||||||||||||||||||||||
|
|||||||||||||||||||||||||||||||||||||||||||||||||||||||||||||||||||
Source: UKCM, Edison Investment Research, Bloomberg, Morningstar. Note: *N/A where not in June 2017 top 10.
Market outlook: Modest returns ahead, driven by income
Over the year to end June 2018, UK real estate outperformed UK equities and government bonds (Exhibit 2, left-hand chart). Although there was a modest narrowing of the yield premium on real estate relative to government bonds over the year, UK property assets continue to offer a materially higher income return than 10-year UK government bonds (Exhibit 2, right-hand chart). This is likely to maintain the appeal of UK real estate as an asset class to income-seeking investors.
|
Exhibit 2: UK real estate returns vs equities and bonds over 10 years |
|
UK real estate annualised total returns vs equities and bonds |
UK real estate yield vs 10-year government bond yield |
|
|
|
Source: UKCM, Thomson Datastream, Bloomberg, Edison Investment Research. Note: Data to 30 June 2018. |
|
The manager’s view is that the industrial sector will continue to lead market performance in the near term, while the weaker trend in the retail sector is expected to persist. Relatively modest returns are anticipated across the UK commercial property market in 2018 and 2019, with income the key driver. In this environment, the alternative sector (including hotels) is also expected to see continued interest from investors, due to the attraction of long, stable, inflation-linked leases.
Fund profile: Diversified portfolio with prime asset focus
Launched in September 2006 and listed on the London Stock Exchange, UKCM is a Guernsey-registered, closed-ended investment company that aims to provide an attractive level of income to shareholders with the potential for capital and income growth from a diversified UK commercial property portfolio. On 1 July 2018, following shareholder approval, UKCM entered the UK real estate investment trust (REIT) regime and changed its name to UK Commercial Property REIT. UK REIT status exempts UKCM from significant capital gains and corporation tax (currently 19%) charges that are proposed under changes to tax legislation taking effect in 2019 and 2020.
UKCM makes direct property investments, primarily in the industrial, retail and office sectors, with lesser exposure to the leisure and hotel sectors. The portfolio is quite concentrated (42 properties at end December 2017) and new investments are typically in a £30m to £50m range. Performance is benchmarked against the MSCI Investment Property Databank (IPD) Balanced Monthly & Quarterly Funds index, which comprises direct property funds. The manager seeks property assets that are considered prime due to their location, build quality or tenant profile and aims to acquire properties at attractive prices, often when they are not viewed as prime assets by the wider market.
UKCM has been managed by Aberdeen Standard Investments (formerly Standard Life Investments) since July 2014, when it acquired Ignis Asset Management, UKCM’s previous investment manager. Will Fulton was appointed as lead manager in 2015 and he aligned UKCM’s portfolio with the house investment strategy, turning over c 25% of the portfolio by value, leading to an increase in industrial sector exposure and a reduction in retail sector exposure.
The fund manager: Will Fulton
The manager’s view: Focused on realising reversionary potential
Will Fulton notes that UKCM’s portfolio performance in the first half of 2018 was stronger than its NAV total return, with 2.1% income and 2.6% capital returns combining to outperform the 4.3% benchmark total return. Non-recurring items affected NAV, including a £3m dilapidations settlement that will not be credited to NAV until the property is vacated in March 2019, and UKCM’s conversion to REIT status led to a £3.3m deferred tax asset write-off. Fulton emphasises that the 3.8% NAV total return was achieved with low net gearing (11.9% loan to value at end June 2018), noting that performance was helped by the portfolio’s strategic overweight to industrials, the strongest sector in the half year, with UKCM’s industrial portfolio generating a 10.2% total return in the period.
Looking ahead, Fulton points out that UKCM has a strong, diversified portfolio with overall exposure well aligned to Aberdeen Standard Investments’ house view of where the strongest returns will be generated on a three-year view. Within sectors, he emphasises that income resilience and asset selection can make a significant difference to performance, noting that the property market has been rewarding income resilience in good locations with positive fundamentals, to the benefit of UKCM. The portfolio void rate was 7.1% of income at end-June 2018, but Fulton comments that over 50% of this void is in strong industrial locations, noting that Radlett has now been let following refurbishment, and strong interest has been received at Lutterworth, which is under refurbishment.
The reversionary potential of the portfolio is seen by the manager as providing considerable scope for earnings improvement over the near and medium term. This potential includes a number of factors (including vacancies being filled, lease renewals, pre-let developments) that could lift rental income by c 26% to its estimated rental value (ERV), which is based on market rents. Further potential upside comes from the current £30m of uncommitted cash (out of a total £84m), that could be invested to add to rental income.
Asset allocation
Investment process: Focused portfolio and active management
UKCM focuses on identifying and acquiring institutional-grade, income-producing commercial property, and seeks to identify assets that benefit from wider infrastructure improvements delivered by others. Investments are made in four commercial property sectors: industrial, office, retail and other commercial/alternatives. No limits are imposed on regional exposures within the UK or property sector weightings, with broad sector and regional allocations influenced by the top-down market views of Aberdeen Standard Investments’ property research and strategy team.
Individual property investment decisions incorporate future capital and income growth potential, sector and geographic prospects, yield, lease length, covenant strength and asset management opportunities, drawing on the local market knowledge of the wider property investment team. When acquiring and selling assets, the manager aims to identify market developments before they are reflected in pricing. There is also a focus on asset management activity to improve the rental value of properties, which can involve re-gearing/extending a lease early or refurbishment. Apart from the 2015 realignment, portfolio turnover has been fairly low and the manager expects this to continue.
The portfolio manager is in regular contact with property agents to monitor investment opportunities and potential buying interest in UKCM’s existing portfolio properties. The investment manager’s size and reputation means that private, off-market deals are regularly presented to the team. For any new property of interest, the manager conducts an initial assessment of the building, its location and potential returns, and follows up with a site visit if the preliminary screening is positive.
Investment risks are managed by maintaining a diversified portfolio, with the following restrictions:
■
No single property shall at the time of acquisition exceed 15% of gross assets.
■
Maximum gearing permitted by the board is set at 25% of gross assets at the time of draw down, with borrowings not to exceed 65% of gross assets at any time.
■
Cash held for working capital purposes and awaiting investment may be invested in cash deposits, gilts and money market funds.
Current portfolio positioning
UKCM’s portfolio comprised 39 properties at end June 2018, compared with 42 at end 2017. The reduction is accounted for by the sale of three Shrewsbury shopping centres, which moved UKCM’s shopping centre subsector exposure below that of the benchmark. Total retail exposure has fallen by 6.0pp since June 2017, with reductions in shopping centres (-3.7pp), retail warehouses (-1.8pp) and retail high street (-0.7pp). UKCM’s overweight in the industrial sector has increased to 12.5pp from 10.9pp a year earlier, with increased exposure in both the South East (+2.8pp) and the rest of the UK (+1.7pp) subsectors (see Exhibit 3). Similar to the benchmark index, UKCM’s largest regional exposures are the South East and London, together accounting for over 60% of portfolio value (see Exhibit 1). While South East exposure has increased by 5.6pp, making it UKCM’s largest overweight (+8.3pp), London exposure has hardly changed and remains UKCM’s greatest underweight (-7.4pp). UKCM also has a significant 6.6pp underweight in the North West and a 5.4pp overweight in the South West, despite a 3.0pp reduction in exposure to this region.
|
Exhibit 3: Portfolio sector and subsector analysis as at 30 June 2018* |
|
Portfolio sector exposure by value versus benchmark |
Portfolio subsector exposure by value |
|
|
|
Source: UK Commercial Property REIT, Edison Investment Research. Note: *Latest available benchmark data as at 31 March 2018. |
|
UKCM’s portfolio included 257 tenancies at end June 2018, down from 343 at end 2017, largely due to the sale of the three shopping centres. While this has led to an increase in rental income concentration by tenant, the top 10 tenants provide 35.9% of rental income, compared with 35.4% a year earlier, and only one tenant accounts for more than 5% of income, as shown in Exhibit 4.
Exhibit 4: Top 10 tenants by annual rent at 30 June 2018
% of income |
||||
Tenant group |
IPD risk band |
30 June 2018 |
30 June 2017 |
Change (pp) |
B&Q |
Negligible |
6.1 |
5.8 |
0.3 |
Public sector |
Negligible |
5.0 |
4.8 |
0.2 |
Ocado Retail |
Low |
4.7 |
3.9 |
0.8 |
Marks & Spencer |
Negligible |
3.6 |
3.1 |
0.5 |
Sony Centre Entertainment |
Negligible |
3.2 |
3.1 |
0.1 |
DSG Retail |
Negligible |
3.1 |
2.9 |
0.2 |
Odeon Cinemas |
Low/medium |
2.9 |
2.7 |
0.2 |
Total E&P UK |
Negligible |
2.8 |
2.7 |
0.1 |
Cine-UK |
Negligible |
2.8 |
2.6 |
0.2 |
Capita |
Low |
1.7 |
N/A |
N/A |
35.9 |
35.4 |
|||
Source: UK Commercial Property REIT, Edison Investment Research
Discount: Widening trend has developed
|
Exhibit 7: Share price premium/discount to EPRA NAV over three years (%) |
|
|
Source: Thomson Datastream, Edison Investment Research. Note: EPRA NAV excludes swap liability. |
As illustrated in Exhibit 7, UKCM’s share price has predominantly ranged between a 5% premium and a 10% discount to EPRA NAV over the last three years, except for a brief sharp widening of the discount at the time of the UK’s vote to leave the European Union in June 2016. The discount steadily narrowed subsequently and the shares reached a 5% premium to NAV in June 2017. However, the share price moved decisively back below NAV in October 2017, and the discount has since widened, with the shares now trading at a 5.2% discount to EPRA NAV.
Capital structure and fees
UKCM has a single share class, with 1,299.4m ordinary shares in issue. While UKCM has annually renewed authority to purchase up to 14.99% and allot up to 10% of its issued share capital, no shares have been repurchased or issued since 2014. UKCM has two fully utilised debt facilities: £150m expiring in 2020 and £100m expiring in 2027, with a 2.89% pa blended cost. It also has an undrawn £50m revolving credit facility to provide short-term investment flexibility. The £250m debt equates to 16.9% gross loan to value at end June 2018, while the net loan to value was 11.9%. The £150m facility has an associated interest rate swap (swapping the facility’s variable rate for a fixed rate of 1.30% pa), which had a fair value liability of £1.1m as at end June 2018.
UKCM has agreed a reduced, tiered management fee structure from January 2019, calculated at a rate of 0.60% pa on total assets up to £1.75bn and 0.475% pa on total assets over £1.75bn. Currently, Aberdeen Standard Investments is paid a management fee at a flat rate of 0.65% pa of total assets and a £0.1m pa administration fee. No performance fee is payable. Based on current gross assets, fees would reduce by £0.8m pa. Excluding direct property costs, FY17 and FY16 ongoing charges were both 0.9% of average net assets. Including direct property costs, FY17 and FY16 ongoing charges were 1.5% and 1.4% of average net assets, respectively.
Dividend policy and record
UKCM’s initial dividend policy was based on the prospect of strong rental growth, but expectations were lowered following the 2008 financial crisis, leading to UKCM rebasing its quarterly dividend to a more sustainable level in 2014 (see Exhibit 1). The dividend has subsequently been held steady, with 0.92p declared quarterly through to Q218 and the 3.68p total annual dividend was 93% covered by revenue earnings in FY17 (94% covered in FY16). Looking ahead, the manager sees significant near- and medium-term reversionary potential for the portfolio rental income (in aggregate, market rents are higher than those being received under current lease terms), which would improve UKCM’s revenue earnings and provide higher dividend cover.
Peer group comparison
Exhibit 8 shows members of the AIC Property Direct UK sector that have a market cap of more than £100m and a performance history of at least three years. UKCM is distinguished by being one of the largest companies in the peer group by market cap and having one of the lowest levels of net gearing. Lower gearing moderates UKCM’s performance in a strong market relative to its peers that are more highly geared, and this is reflected in its NAV total returns ranking in the lower half of the peer group over three and five years. However, UKCM’s performance is ahead of the peer group average over one year and it ranks second out of six over 10 years, a period during which many property investment companies were severely affected by the 2008 financial crisis. UKCM’s 4.1% yield is lower than the peer group average, which may be a reflection of its current vacancy rate and significant reversionary potential, as well as its focus on prime properties and lower gearing. UKCM’s discount is slightly wider than average among the seven companies in the peer group that are trading at a discount to NAV, with four of the peer group trading at a premium. UKCM’s ongoing charge is one of the lowest in the peer group, with no performance fee payable, and this position will be reinforced by the lower management fee that will be effective from January 2019.
Exhibit 8: Selected UK direct property fund peer group as at 31 August 2018*
% unless stated |
Market cap (£m) |
NAV TR |
NAV TR |
NAV TR |
NAV TR |
Discount |
Ongoing charge |
Perf. |
Net gearing |
Dividend yield |
UK Commercial Property REIT |
1,165.6 |
10.6 |
25.3 |
73.3 |
98.9 |
(5.1) |
1.5 |
No |
114 |
4.1 |
AEW UK REIT |
143.2 |
12.9 |
24.1 |
|
|
(1.9) |
2.2 |
No |
125 |
9.1 |
Custodian REIT |
471.2 |
8.2 |
26.1 |
|
|
13.2 |
2.0 |
No |
129 |
5.7 |
Ediston Property Investment Company |
232.5 |
9.0 |
29.0 |
|
|
(3.3) |
1.7 |
No |
137 |
5.0 |
F&C Commercial Property |
1,186.3 |
9.1 |
29.5 |
86.2 |
128.5 |
1.9 |
1.2 |
No |
120 |
4.0 |
F&C UK Real Estate Investments |
237.8 |
12.0 |
25.8 |
79.7 |
75.0 |
(7.5) |
1.7 |
Yes |
134 |
5.0 |
Ground Rents Income Fund |
102.3 |
(6.7) |
27.9 |
55.4 |
|
(13.6) |
1.0 |
No |
100 |
3.7 |
Picton Property Income |
496.9 |
16.2 |
50.3 |
142.0 |
75.4 |
(0.5) |
2.1 |
No |
136 |
4.1 |
Schroder Real Estate Investment |
341.2 |
9.3 |
28.7 |
92.3 |
27.5 |
(2.6) |
2.2 |
No |
134 |
4.2 |
Secure Income REIT |
1,221.9 |
7.8 |
43.5 |
|
|
3.8 |
3.7 |
Yes |
198 |
2.9 |
Standard Life Inv. Property Income |
382.9 |
13.3 |
35.8 |
108.2 |
74.9 |
5.1 |
2.4 |
No |
123 |
5.0 |
Average |
543.8 |
9.2 |
31.5 |
91.0 |
80.0 |
(1.0) |
2.0 |
132 |
4.8 |
|
Rank in peer group |
3 |
5 |
10 |
6 |
2 |
9 |
9 |
10 |
7 |
Source: Morningstar, Datastream, Edison Investment Research. Note: *Performance data to end June 2018. TR = total return. Net gearing is total assets less cash and equivalents as a percentage of net assets (100 = ungeared).
The board
UKCM’s board comprises six independent non-executive directors. Continuing the phased succession of long-serving directors initiated in 2016, John Robertson retired in March 2018, having served on the board since UKCM’s launch in 2006, and two new directors have recently joined the board. Margaret Littlejohns, who is chair of Henderson High Income Trust and a director of JPMorgan Mid Cap Investment Trust, was appointed as a director in January 2018 and Robert Fowlds, who most recently led the real estate investment banking team at JP Morgan Cazenove, joined the board in April 2018. Andrew Wilson is scheduled to stand down from the board at the 2019 AGM, after close to 12 years as a director and two years as chairman, with a new chairman to be selected in due course. The other board members (and dates of appointment) are Ken McCullagh (February 2013), who is CEO of LNC Property Group; Sandra Platts (December 2013), former MD of Kleinwort Benson in Guernsey; and Michael Ayre (February 2016), a Guernsey resident and qualified accountant with a focus on taxation.
|
|
Research: Real Estate
Raven Property Group (Raven) made good underlying progress in H118 against the backdrop of a modestly growing Russian economy and improving supply-demand conditions in the warehouse sector. Occupancy and operating income were up, although headline results are affected by unrealised FX movements. Not reflected in our forecasts, further acquisitions are likely, funded by a strong cash position (almost $200m), with the potential to more than offset rent reversion to market levels and return the company to growth.