Last close As at 06/08/2026
—
— 0.00 (0.00%)
Market capitalisation
—
Research: Investment Companies
UK Commercial Property Trust (UKCM) is a property investment company which seeks to generate an attractive and sustainable income with potential for capital and income growth by investing in high quality UK real estate. UKCM was set up in 2006, aiming to appeal to institutions as well as private investors by adopting a lower risk profile by focusing on prime assets and maintaining a conservative level of gearing. In April 2015, following Standard Life Investments’ (SL) acquisition of Ignis Asset Management, Will Fulton became lead manager. He reshaped UKCM’s portfolio to reflect SL’s house view, while retaining the conservative approach. NAV total return was ahead of its benchmark in 2016, following the repositioning of the portfolio in 2015.
Written by
UK Commercial Property Trust |
Income key in world of low numbers |
Investment trusts |
24 March 2017 |
Initiation of coverage |
Share price/discount performance
Three-year performance vs index
Gearing
Analysts
|
|||||||||||||||||||||||||||||||||||||||||||||||||||||||||||||||||||||||||||||||||||||
UK Commercial Property Trust (UKCM) is a property investment company which seeks to generate an attractive and sustainable income with potential for capital and income growth by investing in high quality UK real estate. UKCM was set up in 2006, aiming to appeal to institutions as well as private investors by adopting a lower risk profile by focusing on prime assets and maintaining a conservative level of gearing. In April 2015, following Standard Life Investments’ (SL) acquisition of Ignis Asset Management, Will Fulton became lead manager. He reshaped UKCM’s portfolio to reflect SL’s house view, while retaining the conservative approach. NAV total return was ahead of its benchmark in 2016, following the repositioning of the portfolio in 2015.
12 months ending |
Share price |
NAV |
IPD Benchmark* (%) |
IPD UK Monthly Index (%) |
UK Real Estate Equity Index (%) |
31/12/12 |
2.5 |
(0.9) |
2.4 |
2.3 |
29.9 |
31/12/13 |
25.7 |
13.1 |
10.7 |
11.0 |
23.8 |
31/12/14 |
20.4 |
19.5 |
17.4 |
19.5 |
21.3 |
31/12/15 |
0.8 |
9.0 |
12.8 |
13.9 |
12.1 |
31/12/16 |
3.8 |
3.8 |
3.6 |
2.6 |
(8.5) |
Source: Thomson Datastream. Note: All % on a total return basis in pounds sterling. *The MSCI/Investment Property Databank UK Balanced Monthly & Quarterly Funds index.
Investment strategy: Focus on income enhancement
UKCM seeks to derive a sustainable income from a diversified portfolio of c 40 UK commercial property assets. It manages the portfolio to reflect SL’s sector strategy and to maintain a bias towards prime properties with good income visibility. Reaching positive outcomes with tenants ahead of lease expiry is seen as key to optimising long-term income and minimising voids. The manager seeks to enhance income further through other asset management initiatives, such as refurbishment or applying for strategic change of use. This aims to secure the cash flows required to ensure attractive and sustainable dividend payouts to shareholders.
Market outlook: Brexit a double-edged sword
The current uncertain macroeconomic environment and the recent trough in bond yields, following several years of yield compression across all income-generating assets, suggest lower capital return expectations are now warranted. That said, UK property income is buoyant and yields compare favourably with other income generating assets, while the significant depreciation in sterling since June 2016 has made UK property cheaper for non-UK investors, arguably reducing Brexit-induced reticence to invest. However, a weaker pound has resulted in higher UK inflation, the future impact of which is not yet clear.
Valuation: Wider than average discount
UKCM’s portfolio is well diversified by sector, region and number of tenancies and its 4.3% dividend yield appears attractive relative to other income-generating products such as equity income funds. UKCM’s share price discount to cum-income EPRA NAV widened briefly following the Brexit vote in June 2016 but narrowed sharply shortly thereafter and currently measures 1.3%.
Exhibit 1: Company at a glance
Investment objective and fund background |
Recent developments |
|||||||||||||||||||||||||||||||||||||||||||||||||||||||||||||||||
UKCM’s objective is to provide ordinary shareholders with an attractive level of income, together with the potential for capital and income growth from investing in a diversified UK commercial property portfolio. The majority of the portfolio will be invested in direct holdings across four key sectors: industrial, retail, office and leisure. The preferred lot size is between £20m and £50m, larger than many in the peer group and reflecting its larger size. |
■ 10 February 2017: £22.2m investment in distribution warehouse development in Burton upon Trent, reflecting a yield on capital of 5.8%. ■ 27 January 2017: Off-market sale of 13 Great Marlborough Street for £30.5m (reflecting a 3.3% net initial yield) to Sony Interactive Entertainment. ■ 18 August 2016: Interim results to 30 June – NAV total return +1.9%. ■ 15 June: Andrew Wilson appointed chairman on retirement of Christopher Hill. |
|||||||||||||||||||||||||||||||||||||||||||||||||||||||||||||||||
Forthcoming |
Capital structure |
Fund details |
||||||||||||||||||||||||||||||||||||||||||||||||||||||||||||||||
AGM |
June |
Ongoing charges |
1.5% (FY15) |
Group |
Standard Life Investments |
|||||||||||||||||||||||||||||||||||||||||||||||||||||||||||||
Final results |
April |
Gross gearing |
18.2% |
Manager |
Will Fulton |
|||||||||||||||||||||||||||||||||||||||||||||||||||||||||||||
Year end |
31 December |
Annual mgmt fee |
0.65% of total assets |
Address |
1 George Street, Edinburgh EH2 2LL |
|||||||||||||||||||||||||||||||||||||||||||||||||||||||||||||
Dividends paid |
May, Aug, Nov, Feb |
Performance fee |
None |
|||||||||||||||||||||||||||||||||||||||||||||||||||||||||||||||
Launch date |
20 September 2006 |
Trust life |
Indefinite |
Phone |
0345 600 2268 |
|||||||||||||||||||||||||||||||||||||||||||||||||||||||||||||
Continuation vote |
2020 and 7 yearly |
Loan facilities |
£250m at 2.89% |
Website |
||||||||||||||||||||||||||||||||||||||||||||||||||||||||||||||
Dividend policy and history |
Share buyback policy and history |
|||||||||||||||||||||||||||||||||||||||||||||||||||||||||||||||||
UKCM pays dividends quarterly. A key objective is to provide an attractive sustainable level of income to shareholders. The dividend was rebased in 2014. |
Renewed annually, UKCM has authority to purchase up to 14.99% and allot up to 10% of its issued share capital. |
|||||||||||||||||||||||||||||||||||||||||||||||||||||||||||||||||
|
|
|||||||||||||||||||||||||||||||||||||||||||||||||||||||||||||||||
Shareholder base (as at 12 December 2016) |
Distribution of portfolio (as at 31 December 2016) |
|||||||||||||||||||||||||||||||||||||||||||||||||||||||||||||||||
|
|
|||||||||||||||||||||||||||||||||||||||||||||||||||||||||||||||||
Top 10 assets by market value (as at 31 December 2016) |
||||||||||||||||||||||||||||||||||||||||||||||||||||||||||||||||||
|
||||||||||||||||||||||||||||||||||||||||||||||||||||||||||||||||||
Source: UK Commercial Property Trust, Edison Investment Research, Bloomberg, Morningstar
Market outlook: Brexit angst offset by weak sterling
Historically, a key attraction for investing in UK commercial property has been as a source of real income. When assessing the market outlook, therefore, three main questions should be considered:
Has investor thirst for income declined?
With the UK consumer under pressure from higher import prices following sterling’s depreciation since June last year, and with an arguably limited prospect of UK deposit rates rising significantly any time soon, it seems that UK investor demand for income is unlikely to dissipate in the immediate future.
Is the current level of income offered by UK commercial property sustainable?
While commercial property is increasingly viewed from a global perspective, in any given country there is often constraint on supply. The UK is no exception, with its limited landmass and tight regulation. The waters have been muddied by Brexit, which may lead to some businesses relocating part of their UK operations elsewhere (eg HSBC’s planned shift to Paris) but may also encourage others to take advantage of the weaker pound (eg Bank of America’s planned expansion in London, and the recently agreed sale of the City of London’s tallest tower, known as the Cheesegrater, to China’s CC Land).
The double-digit depreciation of sterling relative to the US dollar since June 2016, international respect for the UK’s rule of law, its infrastructure, transport links, intellectual capital, alongside its consumer market and central time zone location, seem likely to support continuing demand for UK commercial real estate. However, demand tends to be selective and dependent on a large number of variables. Assuming a world of lower returns, the onus will be on portfolio managers to find, buy and manage those properties with most potential – to optimise income generation, managers will need to ensure that properties are occupied by high-quality tenants, with lease expiries/renewals proactively managed and voids kept to a minimum.
While the Brexit vote in June heightened uncertainty, UK property activity remained healthy in the second half of 2016, with investment volume broadly the same as in the first half. Agents JLL and Savills estimate that activity in 2017 will be similar to the c £40bn long-term average, albeit below the levels of the last four years. There is little sign that tenant quality has deteriorated since the referendum, but some recent London office construction hotspots are reportedly seeing signs of overcapacity. Following major construction projects in EC3, partly speculative, in anticipation of growing insurance sector demand, some completed space remains vacant. We note that UKCM has been reducing its exposure to London offices since 2015, primarily on valuation grounds, and now has only one property in the City of London representing 2.2% of the overall portfolio.
How does real estate income compare to other asset classes?
After a strong period for property returns over the last five years (+9.7% pa for the UK IPD Monthly index – Exhibit 2 left-hand side), it is reasonable to question the likely level of prospective returns for the asset class. However, Exhibit 2 (right-hand side) shows that the index real estate yield has not fallen in line with government bond yields, making real estate continue to look attractive from a relative yield perspective. The current wide yield spread provides a meaningful cushion if gilt yields continue to rise, suggesting scope for UK property investments to outperform. Moreover, unlike conventional fixed interest investments, as a real asset with rental income subject to upward reviews, property can provide a measure of inflation protection.
Clearly, yield is not the only factor on which to judge the attractiveness of an asset class, but if the view is held that scope for capital growth across all asset classes is limited in an environment of low economic growth, a direct property fund such as UKCM, which provides an attractive dividend yield, may merit consideration. Its prudent investment approach, low gearing and focus on income sustainability are all attributes which might appeal to the more conservative investor seeking regular income. While there could be concerns over the potential effect on asset values once UK monetary policy starts to normalise, property has recorded positive capital returns during previous periods of rate tightening and policy normalisation is itself a manifestation of increasing economic strength.
|
Exhibit 2: UK real estate returns vs equities and bonds over 10 years |
|
UK real estate total returns vs equities and bonds to 31 January 2016 |
UK real estate yield vs 10-year government bond yield to 20 February 2017 |
|
|
|
Source: Thomson Datastream, Edison Investment Research |
|
Fund profile: Large UK fund focused on prime assets
Launched in September 2006, UKCM is a Guernsey-registered, closed-ended investment company listed on the London Stock Exchange. Its objective remains unchanged since launch: to provide shareholders with an attractive level of income together with the potential for capital and income growth from investing in a diversified UK commercial property portfolio. The portfolio is invested across four main sectors – industrial, retail, office and leisure. UKCM is one of the larger property investment companies in the UK peer group with assets of over £1.3bn, and maintains a relatively concentrated portfolio of investments (42 at end-2016). As a result, the preferred lot size per property investment is between £20m and £70m, with a “sweet spot” of between £30m and £50m. UKCM’s performance is measured against the MSCI Investment Property Databank (IPD) Balanced Monthly & Quarterly Funds index. This is a direct property fund peer group index, while another comparator is the IPD Monthly Index, which measures the change in value of c 8,500 UK commercial properties. Investors also look at the performance of UK real estate equity, which includes property development companies and generally more leveraged companies.
Strategic change came in 2015, following the purchase in 2014 of UKCM’s then manager, Ignis Asset Management by Standard Life Investments (SL). With board approval and following the appointment of Will Fulton as lead manager, UKCM’s portfolio was repositioned to reflect SL’s investment strategy, while continuing to operate under the same board, investment policy and risk controls. This resulted in some 25% of the portfolio by value being reallocated, in a year of uncharacteristically high portfolio turnover for the fund. The thrust of the changes was to increase exposure to the industrial sector, while moving to an underweight in the retail sector. This has worked well so far, with the industrials segment outperforming both the office and retail segments during 2016, generating total returns of +10.8%, versus +5.1% and -1.3% respectively, according to data published by UKCM. Industrials was also the strongest performing sector of the IPD index.
The management team believes that the benefits of the repositioning and subsequent portfolio activity in 2016 will become fully apparent over the next 18 months. The manager is focused on prime property assets, in terms of their location, build quality or tenant profile. While there is plenty of subjectivity as to what constitutes a prime asset, one measure is to consider estimated rental value (ERV) per square foot. SL reports that as at 31 December 2016, 65% of UKCM’s portfolio by weight of capital has a superior ERV per sq ft to the IPD average. It should also be borne in mind that the IPD benchmark contains a majority of institutional assets, which are themselves mostly of a higher standard than a swathe of other property assets in the whole UK market. The investment manager views certain assets as being prime simply on account of their location. Ideally, such a view is not universally accepted when the investment is made, enabling the asset to be acquired at an attractive price. An example of this is UKCM’s South East (London) industrial estate portfolio; while it is older stock, it has been experiencing good rental growth because the properties are situated in locations where it is hard to create an economically viable development of new stock due to lack of suitable/affordable land, putting UKCM in a position of strength when it comes to negotiating lease renewals with existing tenants.
The fund manager: Will Fulton
The manager’s view: Income to become key part of total return
Will Fulton has 27 years’ experience spanning property investment, valuation, asset management and development. Prior to becoming lead manager of UKCM in April 2015, he managed a £2.3bn real estate life assurance fund. He works closely with three other portfolio managers: David Rodger, David Fleetwood and Jamie Horton, who also work full-time on UKCM. In addition, Fulton draws on the investment manager’s wider real estate resources, including its research and strategy team.
Fulton shares SL’s head of global strategy’s view that we are “in a world of low numbers”, but takes some comfort from the fact that UK property assets still yield significantly more than gilts, while also offering some inflation protection. “We may be past peak returns in the UK property cycle”, he argues, “but decent returns can still be made for shareholders by seeking to sustain and opportunistically enhance rental income”.
Fulton is comfortable with the current positioning of UKCM’s investment portfolio. The portfolio has considerable reversionary potential, he argues, meaning that passing rents on many of UKCM’s assets would be higher were they to be re-let at today’s market rates. This potential can be demonstrated by comparing UKCM’s current income yield (4.9% net initial yield) versus its reversionary yield (5.8%). Moreover, as UKCM’s void rate is considerably lower than the benchmark (3.7% vs 6.9%), it can be inferred that most of the reversionary potential is through re-letting current under-rented properties rather than filling voids. In short, Fulton is confident that as some of UKCM’s more mature leases reach expiry over the next two years (c 22% of the portfolio by value), so the majority of the properties can be re-let on improved terms. This positive reversionary trend is expected by the manager to enhance both the level of UKCM’s portfolio income and its sustainability.
In terms of trends in the property sector, Fulton is keen to highlight how technology advancement is affecting the UK property market. Such has been the growth in e-commerce, highlighted by John Lewis reporting that more than 50% of its sales are now executed online, that demand for industrial and distribution space from retailers continues to grow, while demand for non-prime retail property declines. “The standard retail sector has become polarised”, he argues – “the more affluent and the more economically dynamic the location, the easier it is to attract high-quality anchor tenants and therefore the greater the future rental value and vice versa.”
Fulton supports the view that London offices are likely to be most negatively affected over the medium term, given the linkages to European markets and relatively low yields. However, more broadly, he expects overall supply to remain limited with development constrained by uncertainty.
Asset allocation
Investment process: Experience married with research
The manager is focused on institutional-grade, income-producing assets and UKCM’s portfolio is currently invested in four distinct commercial property sectors: industrial, office, retail and leisure. No restrictions on geographic exposures in the UK or weightings in the principal property sectors are imposed by the board. However, to manage risk, the following restrictions apply:
■
No single property shall at the time of acquisition exceed 15% of gross assets.
■
Borrowings will not exceed 65% of gross assets.
■
The board is responsible for setting the gearing range within which the manager may operate and maximum gearing is currently set at 25% of gross assets.
Investment decisions are based on a range of metrics including future capital and income growth projections, sector and geographic prospects, yield, lease length, covenant strength and asset management opportunities. Decisions are reached in two main ways: first, top-down input is received from SL’s nine-strong property research and strategy team. This research is then allied with the collective intelligence gleaned from fund managers on the ground, who ‘live and breathe’ the UK’s towns and cities, and who between them have many decades of real estate experience, allowing access to both on- and off- market investment opportunities.
Managers maintain regular contact with property agents to keep informed of new investment opportunities and potential buying interest in UKCM’s current portfolio properties and this information is shared at the team’s daily investment meeting. Should Fulton be interested in a new lead, he will conduct his own initial research – a perusal of Google Maps to make an assessment of the property and its location, some number crunching to get an idea of potential returns, followed by a physical inspection of the property, if it is deemed worthy of closer scrutiny. Ideally, Fulton favours private deals where he is not competing with other buyers and the purchase can be executed off-market. He is confident that UKCM gets to see all the major deal flow in the UK due to SL’s size and reputation, as well as UKCM’s ability to act quickly with cash in the bank.
Portfolio turnover has historically been relatively low, and the manager has no plans to change this. In Fulton’s view, value is being added by proactively managing existing investments, which has become increasingly important in today’s “world of low numbers”, rather than churning the portfolio for no good reason. Investments are continually monitored, with particular attention paid to those assets where leases are coming up for renewal and action will be taken to adjust the portfolio to preferred sectors or away from those with limited rental growth potential.
Income enhancement through asset management
The investment manager’s philosophy is to seek to add value by focusing on change, both macro and micro – and by looking ahead, in order to react to market changes before these are reflected in pricing. For example, he keeps a keen eye on upcoming lease expiries such that research can be carried out and strategies adopted for each property. If he anticipates that significant capital expenditure is required with limited return prospects, or that long-term return prospects are low, he will prepare the asset for sale. However, if the manager believes there is scope to improve rental income, he will focus on reaching a positive outcome ahead of the lease expiry.
The process of managing existing portfolio properties to improve or maximise rental value, known as asset management activity, is viewed positively by the investment manager. To what extent an asset can be actively managed to add value depends on a combination of factors, including the economic environment, location/characteristics of the property and timing of the opportunity, argues Fulton. In his view, UKCM’s portfolio contains a significant number of positive asset management angles, varying from regearing/extending leases early to refurbishment.
Recent examples of asset management activity include the proactive move by the manager to offer a lease to Ovo Energy at 1 Rivergate in Bristol. At the time, the property’s tenant BT was subletting the space to Ovo Energy as it was surplus to BT’s requirements. The manager could see that Ovo was a fast-expanding, highly successful business with a growing share of the UK energy market, and that it was well suited to the layout and design of the office. Instead of waiting for the lease with BT to expire, UKCM negotiated a five-year reversionary lease with Ovo at an improved future rent. Another example is the 15-year reversionary lease signed with Cineworld in Glasgow, which included some inflation protection and an increased rent. This deal resulted in a capital uplift of 7% taking into account the cost of offering an initial incentive and a 35-year lease with Cineworld.
An example of a recent refurbishment is George Street, Edinburgh, which will be let to Clydesdale Bank, Joules and Inergen when completed, extending the lease term to over 15 years and enabling the property to generate £1.37m pa in rent. Payback on a refurbishment varies by project and the manager considers value, return on investment and income exposure on a case-by-case basis.
Voids
At 3.7%, UKCM’s level of voids is well below the IPD benchmark level of 6.9%. While anticipating that market voids may increase given the UK’s uncertain economic environment, the manager considers that UKCM’s void rate could prove more resilient, with a fair wind behind some expected letting activity that is already in train. UKCM’s recent results presentation highlights the lease break points between September 2016 and September 2018 for those leases with an annual rent of over £0.5m. By value, most of these are in the industrials sector, the sector about which SL is currently most positive and suggesting scope for some profitable re-lets and renewals.
Tenant profile
UKCM generated rental income of £69.4m in 2016 from 346 lease contracts, a similar level to 2015. Rental income would have been higher had it not been for a write-down at one of UKCM’s shopping centres (Swindon) where BHS had been a tenant. This vacancy is now under offer from a new prospective tenant. Another vacancy at the B&Q industrial warehouse on the north M25 (Radlett) is also now under offer to be re-let. As shown in Exhibit 3, the main tenants are well spread, with the biggest tenant, B&Q, representing 5.8% of rental income at end-2016. In terms of IPD risk band, the 10 largest tenants by income range from low/medium risk for Odeon cinemas to low for Ocado to negligible for the remaining eight. UKCM’s chairman, Andrew Wilson, recently reported that UKCM had a strong tenant base and noted that the manager had collected 99% of rent within 21 days of due date during 2016.
Exhibit 3: Top 10 tenants by annual rent
Tenant group |
IPD risk band |
% of income |
||
31 December 2016 |
31 December 2015 |
Change |
||
B&Q |
Negligible |
5.8 |
6.9 |
-1.1 |
Public sector |
Negligible |
4.8 |
5.1 |
-0.3 |
Sony Centre Entertainment |
Negligible |
4.6 |
4.4 |
0.2 |
Ocado Retail |
Low |
3.9 |
3.8 |
0.1 |
Sainsbury’s supermarkets (incl Argos) |
Negligible |
3.8 |
N/A |
N/A |
Marks & Spencer |
Negligible |
3.1 |
2.5 |
0.6 |
DSG Retail |
Negligible |
2.9 |
2.8 |
0.1 |
Odeon Cinemas |
Low/medium |
2.7 |
2.6 |
0.1 |
Total E&P UK |
Negligible |
2.7 |
2.6 |
0.1 |
Cineworld UK |
Negligible |
2.5 |
2.4 |
0.1 |
Top 10 |
36.8 |
33.1 |
||
Source: UK Commercial Property Trust, Edison Investment Research
Current portfolio positioning
UKCM’s current portfolio positioning reflects strategic changes implemented in 2015 when SL became the investment manager and the inherited portfolio was repositioned in line with the house strategy. As highlighted earlier, in particular the overweighting of the industrials sector has been well timed since this sector outperformed both the retail and the office sectors by some margin in 2016, according to data from IPD. Exposure to industrials was increased, especially in the South East and in warehouses. New purchases were financed by sales in the retail and office sectors. Nevertheless, the market and economics do not stand still and SL reviews the outlook for sectors on a quarterly basis, modifying portfolio and asset strategy accordingly.
Exhibit 4 shows the sector split at end-2016. In line with SL’s house view, the fund is overweight industrials/distribution warehouses, where the demand outlook remains positive and valuations are perceived to be relatively attractive. Continuing polarisation is envisaged in the retail sector: leisure parks, major city prime shops, larger regional shopping centres and medium town prime shops are expected to fare well, while outlets in less affluent areas are expected to struggle. SL remains especially negative about the prospects for London offices, where yields appear unsustainably low in an environment of uncertainty ahead of Brexit.
|
Exhibit 4: Portfolio sector allocation at 31 Dec 2016 |
Exhibit 5: Portfolio split by region at 31 Dec 2016 |
|
|
|
Source: UKCM, Edison Investment Research |
|
Exhibit 4: Portfolio sector allocation at 31 Dec 2016 |
|
|
Source: UKCM, Edison Investment Research |
|
Exhibit 5: Portfolio split by region at 31 Dec 2016 |
|
|
Source: UKCM, Edison Investment Research |
Exhibit 6: Portfolio subsector exposure (% unless stated)
Portfolio end-Dec 2016 |
Portfolio end-Dec 2015 |
Change |
Benchmark Dec 2016 |
Active weight vs benchmark (pts) |
Trust weight/ benchmark weight (x) |
|
Industrials - South East |
23.6 |
22.1 |
1.6 |
12.8 |
10.8 |
1.8 |
Retail warehouses |
21.9 |
21.8 |
0.1 |
15.7 |
6.2 |
1.4 |
Offices - West End |
8.9 |
11.1 |
-2.2 |
6.6 |
2.3 |
1.3 |
Offices - Rest of UK |
8.0 |
10.0 |
-2.0 |
6.4 |
1.6 |
1.3 |
Other (including leisure) |
10.1 |
9.6 |
0.5 |
11.5 |
-1.4 |
0.9 |
Industrials - Rest of UK |
8.3 |
7.9 |
0.4 |
8.4 |
-0.1 |
1.0 |
Shopping centres |
7.4 |
8.4 |
-1.0 |
6.0 |
1.4 |
1.2 |
Standard retails - South East |
2.9 |
2.9 |
0.0 |
9.1 |
-6.2 |
0.3 |
Standard retails - Rest of UK |
5.1 |
2.4 |
2.7 |
7.6 |
-2.5 |
0.7 |
Offices - City |
2.2 |
2.2 |
0.0 |
5.0 |
-2.8 |
0.4 |
Offices - Rest of South East |
1.6 |
1.7 |
-0.1 |
10.7 |
-9.1 |
0.1 |
100.0 |
100.0 |
Source: UK Commercial Property Trust, Edison Investment Research
Recent investment activity
In 2016, UKCM made two strategic disposals for £45.6m at prices above valuation. Both assets were offices – one in Arlington Street, London and the other Dolphin House, Sunbury – and were sold with the benefit of a residential planning permission secured by UKCM. Another office disposal was completed in January 2017: 13 Great Marlborough Street, London was sold for £30.5m, reflecting a net initial yield of 3.3%. These disposals further reduced exposure to London offices.
Largely reflecting market uncertainty, no purchases were made by UKCM in 2016. However, in February 2017, UKCM purchased a distribution warehouse in Burton upon Trent for £22.2m on a net initial yield of 5.8% and pre-let on a 15-year lease, with inflation-linked, five-yearly rent increases. The manager aims to purchase further attractively valued assets on long leases to recycle the remaining capital raised from the aforementioned office sales.
Lease expiry/break profile
UKCM’s property portfolio has a weighted average lease length of 8.1 years and the manager is confident about its ability to actively manage upcoming lease expiries, many of which are in the industrial warehouse sector, where the manager continues to see opportunity for rental growth. A broad spread of lease maturities provides a steady flow of asset management opportunities, helping maximise the reversionary yield potential of the portfolio.
|
Exhibit 7: UKCM lease expiry profile versus IPD benchmark as at 31 December 2016 (%) |
|
|
Source: Thomson Datastream, Edison Investment Research |
Performance: Improvement following repositioning
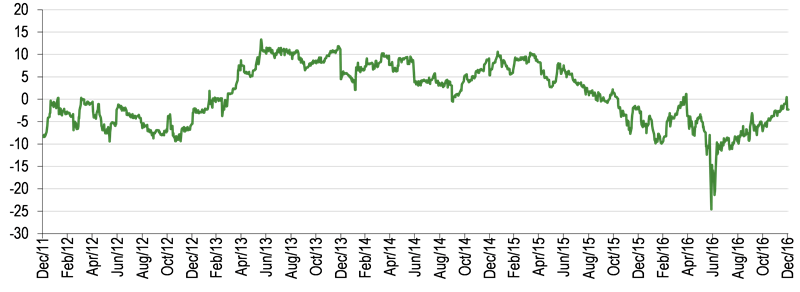
UKCM does not seek to enhance returns using high leverage – taking the view that this would leave it vulnerable in a market downturn – instead it favours a low risk approach, which served it well during the property downturn of 2008/09. While this prudent strategy has been retained under SL’s stewardship, both sector and geographic emphasis have shifted. Although it is too early to judge the full effect of these changes on performance, UKCM generated a 3.8% NAV total return in 2016, despite the one-off loss relating to BHS’s closure and resultant void in its Swindon shopping centre, ahead of the IPD benchmark return of 3.6%. This may be viewed as an encouraging start, following the repositioning in 2015. Over three and five years, UKCM’s NAV total return, although positive in absolute terms, has lagged IPD, reflecting underperformance before SL’s tenure.
|
Exhibit 8: Investment company performance to 31 December 2016 |
|
Price, NAV and benchmark total return performance, one-year rebased |
Price, NAV and benchmark total return performance (%) |
|
|
|
Source: Thomson Datastream, Edison Investment Research. Note: Three, five and 10-year performance figures annualised. |
|
Exhibit 9: Share price and NAV total return performance, relative to indices (%)
|
One month |
Three months |
Six months |
One year |
Three years |
Five years |
10 years |
Price relative to IPD Benchmark |
0.8 |
5.8 |
18.7 |
0.2 |
(8.2) |
4.5 |
2.3 |
NAV relative to IPD Benchmark |
1.7 |
1.7 |
0.8 |
0.2 |
(1.4) |
(2.4) |
6.0 |
Price relative to IPD UK Monthly Index |
1.9 |
5.6 |
19.6 |
1.2 |
(9.7) |
2.4 |
3.3 |
NAV relative to IPD UK Monthly Index |
2.9 |
1.5 |
1.6 |
1.1 |
(3.1) |
(4.4) |
7.1 |
Price relative to UK Real Estate Index |
(3.2) |
7.7 |
13.6 |
13.5 |
1.3 |
(18.8) |
98.8 |
NAV relative to UK Real Estate Index |
(2.3) |
3.5 |
(3.5) |
13.4 |
8.7 |
(24.2) |
106.0 |
Price relative to FTSE All-Share |
(1.8) |
4.2 |
7.1 |
(11.1) |
5.6 |
0.3 |
(11.7) |
NAV relative to FTSE All-Share |
(0.9) |
0.2 |
(9.1) |
(11.1) |
13.4 |
(6.3) |
(8.5) |
Source: Thomson Datastream, Edison Investment Research. Note: Data to end-December 2016. Geometric calculation.
|
Exhibit 10: NAV total return performance relative to IPD benchmark* index over 10 years |
|
|
Source: Thomson Datastream, Edison Investment Research. Note: *IPD Benchmark is an abbreviated term, which refers to the MSCI IPD Balanced Monthly & Quarterly Funds Index. |
Capital structure and fees
UKCM currently has 1,299m shares in issue. In terms of the evolution of UKCM’s capital structure, the initial offering in 2006 raised £530m, with the proceeds used to acquire a portfolio of properties from closed life funds held by Phoenix Group Holdings. Similar exercises were undertaken in February 2007 and October 2009, with separate property portfolios purchased from Phoenix. In 2010 and 2014, shares were issued to enable further acquisitions. While there has been no subsequent share issuance, changes have been made to the company’s debt structure.
UKCM has two main borrowing facilities: £150m expiring in 2020, and a £100m facility, running to 2027. In addition, it has a £50m revolving credit facility to provide additional flexibility. UKCM’s blended cost of debt is 2.89% pa, among the lowest in the peer group. The £150m facility had an associated swap liability of £3.75m as at end-2016. We see scope for this liability to decline if bond yields move higher, which would have a positive effect on NAV. Conversely, the liability would rise if bond yields were to retest their lows. UKCM’s borrowing facilities are not being fully utilised at present, with overall net gearing of 11.4% versus 18.2% gross.
The board is considering UKCM changing to a UK REIT (real estate investment trust) structure, with a view to reducing a potentially higher tax burden. This reflects concerns over potential future tax legislation, including that inter-company borrowing charges may cease being tax deductible. This follows comments in the UK Chancellor’s autumn statement regarding the need to eliminate tax strategies that exploit gaps and mismatches in tax rules. Unlike a traditional investment company, which is obliged to pay out 85% of its earnings as dividends, a REIT’s payout ratio is higher, at 90%.
UKCM’s largest shareholder is Phoenix Group, with a 47.9% stake. It is a longstanding shareholder – UKCM’s initial property assets were acquired from Phoenix in 2006. Thus far, it has proved to be supportive, as evidenced in November 2016 when a continuation vote was held after an in-built shareholder protection mechanism was triggered; 76% of shareholders voted and, of those, 99.9% supported continuation. It is understood that Phoenix’s holdings are in a closed-ended life insurance book, and it is expected that the holding will decrease gradually as life policies mature.
Dividend policy and record
UKCM’s dividend policy was originally set by the board in 2006 when rental growth prospects were deemed to be strong. However, the economic downturn in 2008 undermined rental growth potential, especially outside central London. As a result, in 2013 the board approved the rebasing of the quarterly dividend to a more sustainable level. Since that time, the dividend has remained consistent. In FY16, the 3.68p total dividend was 93% covered by earnings. However, recent lease renewals on higher rents, and the disposal of certain low-yielding assets and recent purchase of a higher-yielding one, make the manager sanguine about the portfolio income outlook.
Peer group comparison
Exhibit 12 shows trusts from the AIC Property Direct UK sector that have a market cap in excess of £100m and a performance history of more than one year. UKCM is the second largest trust in the peer group by market cap and has the second lowest level of net gearing. The low level of gearing compared to its peers reflects its policy since launch to limit risk and maximise the breadth of its investor appeal. As a direct result, NAV total return would be expected to lag that of peers in a market upturn such as that witnessed by direct property funds over the last three and five years. Unsurprisingly, therefore, while UKCM’s performance has been positive in absolute terms over these periods, it has not matched the weighted sector average. However, over 10 years, which includes the global downturn in 2008, the lower gearing appears to have been of benefit to shareholders, with above average NAV total return performance recorded. UKCM successfully navigated the liquidity crisis of 2008, which saw a number of its peers require rescue finance. UKCM yields 4.5%, marginally below the sector average, which might be expected given its focus on prime properties. UKCM’s ongoing charge is in line with the sector average.
Exhibit 12: Selected peer group as at 6 March 2017
% unless stated |
Market cap £m |
NAV TR 1 Year |
NAV TR 3 Year |
NAV TR 5 Year |
NAV TR 10 Year |
Sharpe 1y (NAV) |
Sharpe 3y (NAV) |
Discount (ex-par) |
Ongoing charge |
Perf. fee |
Net gearing |
Dividend yield (%) |
UK Commercial Property |
1,068.8 |
3.8 |
36.3 |
53.3 |
57.1 |
(1.2) |
0.0 |
(3.6) |
1.5 |
No |
107 |
4.5 |
AEW UK REIT |
123.5 |
6.5 |
|
|
|
(1.0) |
(1.1) |
6.7 |
1.5 |
No |
112 |
8.0 |
Custodian REIT |
379.4 |
5.3 |
|
|
|
(1.1) |
(0.6) |
12.9 |
2.0 |
No |
119 |
5.7 |
Ediston Property Investment |
137.8 |
5.2 |
|
|
|
(1.1) |
(0.4) |
(0.8) |
1.6 |
No |
129 |
5.1 |
F&C Commercial Property |
1,111.1 |
5.2 |
49.2 |
75.7 |
67.2 |
(0.7) |
0.3 |
2.6 |
0.9 |
Yes |
128 |
4.3 |
F&C UK Real Estate Investments |
248.5 |
1.0 |
36.2 |
48.5 |
23.5 |
(1.4) |
0.0 |
7.6 |
1.7 |
Yes |
100 |
4.8 |
Picton Property Income |
437.4 |
10.9 |
72.9 |
70.6 |
12.1 |
(0.7) |
0.7 |
1.8 |
1.1 |
No |
148 |
4.1 |
Primary Health Properties |
668.1 |
9.3 |
47.8 |
56.7 |
|
(0.8) |
0.3 |
25.4 |
1.3 |
Yes |
231 |
4.7 |
Regional REIT |
287.9 |
5.5 |
|
|
|
(0.7) |
(0.5) |
(1.6) |
|
Yes |
|
7.3 |
Schroder Real Estate Invest |
313.7 |
1.9 |
47.9 |
42.3 |
(19.4) |
(1.3) |
0.3 |
0.0 |
2.5 |
No |
147 |
4.1 |
Secure Income REIT |
748.7 |
7.3 |
|
|
|
(0.9) |
0.5 |
11.3 |
1.6 |
Yes |
|
4.0 |
Standard Life Inv. Prop. Inc. |
333.9 |
1.2 |
33.5 |
63.1 |
13.9 |
(1.4) |
(0.1) |
8.4 |
1.5 |
No |
145 |
5.5 |
Simple average |
488.2 |
5.3 |
46.3 |
58.6 |
25.8 |
(1.0) |
(0.0) |
5.9 |
1.6 |
137 |
5.2 |
|
Weighted average |
5.6 |
46.0 |
61.3 |
41.4 |
(1.0) |
0.1 |
6.0 |
1.4 |
139 |
4.7 |
||
Rank |
2 |
9 |
5 |
5 |
2 |
9 |
6 |
12 |
6 |
9 |
8 |
Source: Morningstar, Edison Investment Research. Note: TR = total return. Sharpe ratio is a measure of risk-adjusted return. The ratios shown are calculated by Morningstar for the past 12- and 36-month periods by dividing a fund’s annualised excess returns over the risk-free rate by its annualised standard deviation. Net gearing is total assets less cash and equivalents as a percentage of net assets. NAV performance data is up to 31 December 2016.
The board
UKCM has five non-executive directors. The chairman is Andrew Wilson, founder of Rugby Estates, who was appointed in June 2016, following the retirement of Christopher Hill, who had been a director since 2006. The other board members (and dates of appointment) comprise: John Robertson (2006), a retired former director of Ignis Asset Management; Ken McCullagh (2013), who is currently CEO of LNC Property Group; Sandra Platts (2013), former MD of Kleinwort Benson in Guernsey; and Michael Ayre (2016), a Guernsey resident and qualified accountant with a focus on taxation matters. The board has a broad skill set, with expertise and experience across real estate, investment management and accountancy.
|
|
A strong performance from Television and Family and continued recovery at the Box Office in Film put eOne on track to deliver strong growth in reported revenues and underlying EBITDA in FY17, as expected. The divisional mix may be weighted more towards Television than we had forecast but overall, we do not make any changes to our estimates.