Last close As at 05/08/2026
—
— 0.00 (0.00%)
Market capitalisation
—
Research: Industrials
Another record year of performance was achieved by the continuing activities of the group despite challenging market conditions that are persisting into 2018. As management pursues its strategy of focusing on the right brands in the right locations supported by appropriate levels of investment, it is continuing to outperform its markets. We expect this to continue with a remaining proactive focus on costs. Comparatives should ease as FY18 progresses but will start tougher due to the strength of markets in Q117. We now expect a modest decline in PBT for the full year.
Written by
Lookers |
Looking forward |
FY17 results |
Automotive retailers |
4 April 2018 |
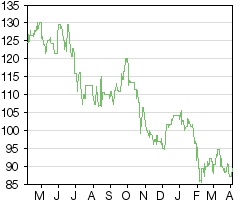
Share price performance
Business description
Next events
Analysts
|
||||||||||||||||||||||||||||||||||||||||||||||||||
Another record year of performance was achieved by the continuing activities of the group despite challenging market conditions that are persisting into 2018. As management pursues its strategy of focusing on the right brands in the right locations supported by appropriate levels of investment, it is continuing to outperform its markets. We expect this to continue with a remaining proactive focus on costs. Comparatives should ease as FY18 progresses but will start tougher due to the strength of markets in Q117. We now expect a modest decline in PBT for the full year.
Year end |
Revenue (£m) |
PBT* |
EPS* |
DPS |
P/E |
Yield |
12/16 |
4,088 |
64.9 |
13.1 |
3.64 |
6.8 |
4.1 |
12/17 |
4,696 |
68.4 |
14.1 |
3.89 |
6.3 |
4.4 |
12/18e |
4,744 |
67.7 |
13.7 |
4.08 |
6.5 |
4.6 |
12/19e |
4,885 |
70.4 |
14.5 |
4.29 |
6.2 |
4.8 |
Note: *PBT and EPS are normalised, excluding amortisation of acquired intangibles, exceptional items and share-based payments.
Delivered growth in FY17 despite market backdrop
New and used car retailing, aftersales and leasing all grew sales volumes on a like-for-like basis boosted by the FY16 acquisitions. Revenues for the continuing business grew by a better than expected 15% to £4.7bn. However, the acquisitions generated a lower than expected £7m of pre-tax profits, against an expectation in excess of £10m, while management restructured HQ in December at a cost of £2.5m to save £3m in FY18. In the absence of these factors, pre-tax profits would have exceeded our forecast, instead finishing the year up 5% at £68.4m, representing a record level for the ongoing retail activities. Net debt rose to £97.8m due to two one off factors that should unwind this year, resulting in cash inflows in excess of £40m. The full year dividend was increased 7% to 3.89p.
FY18 to see modest decline
Q118 performance has been boosted on the used-car side by a manufacturer inventory package bought in December. Forward orders for the important March month were at good levels, but Q118 new car sales will still be down year-on-year compared to record levels last year. Consumer confidence remains low, although improving a little in January, with Brexit concerns still prominent and disposable income constrained. Despite this, year-on-year comparisons will improve from Q218, and the adverse diesel influence should have worked through with personal contract plan (PCP) debt-related concerns starting to abate. With over 100k active service plans in place, we expect continued growth of high-margin aftersales activity. Management’s focus on controlling rising costs while driving above market performance remains. Overall we expect a modest decline in profitability this year.
Valuation: Large discount to peers undeserved
Lookers’ rating has suffered more than many of its peers over the last 12 months. It now trades on a prospective FY19e P/E of just 6.2x compared to the peer group average of 7.1x, which seems unwarranted given the resilience of trading.
Investment summary
Company description: Leading motor retailer
Lookers is a pure UK automotive retailing group, the third-largest UK franchised motor distribution group, selling over 221,000 new and used cars and vans. It continues to grow ahead of the UK new car market with its share rising to 6.0% in FY17 (FY16 5.5%). It has been built by a combination of organic growth and acquisitions, delivering an impressive and consistent trading record over many years. It has strong relationships with its OEM partners and has established a number of strong geographical sales territories, from which the group can generate consistent and growing returns. In addition to new car sales, Lookers operates a growing used vehicle and aftermarket business (servicing, repairs and the provision of franchised parts) in its franchised dealerships, which together contribute 64% of ongoing gross profits. It sold its part distribution operations in November 2016 for £126m.
Record performance in a challenging market
Record performance was achieved in FY17 by ongoing activities in a more challenging market backdrop. UK consumer and business confidence remained undermined by uncertainty over Brexit and lower disposable incomes. The deteriorating perception of diesel engines and the debate about PCP finance have also had an impact. The introduction of new vehicle excise duty (VED) rates in April pulled forward sales into Q117 and should not recur. All of Lookers’ business lines improved like for like sales, and gross profit demonstrated resilience even in the weaker H217. Management continues to proactively manage rising costs and a more stable new car market sequential trend is expected in 2018, allowing a modest decline in profitability with a tougher first half.
Valuation
UK motor retailing subsector ratings have remained depressed due to the market factors mentioned above. However, Lookers profitability has grown, albeit below our expectations due to restructuring at HQ in December that cost £2.5m and lower than expected profits from FY16 acquisitions that should improve in FY18. There has therefore been a further multiple contraction. In response, the company is now embarking on a £10m share buyback, which is relatively modest but indicates management’s view of the shareholder value afforded. Capital allocation remains skewed to investment for growth, both organic and through an increasingly attractive M&A pipeline.
Financials
Underlying pre-tax profits for ongoing operations rose 5% to £68.4m, 6% below our expectations, largely due to a restructuring charge. Fully diluted adjusted EPS rose 8% and the full-year dividend increased 7%. Guidance for 2018 is cautious due to softer markets with the Society of Motor Manufacturers and Traders (SMMT) forecast for a 5.6% fall in new car sales to a still historically high level. We feel Lookers can again outperform the market in FY18 but margins will remain under pressure leading to a likely modest decline in PBT. Net debt finished 2017 32% higher at £97.8m (FY16 £74.1m) reflecting a short-term inventory build and deferrals of two sale and leaseback deals to 2018. We have reduced our EPS estimate for FY18 by 7% and introduce our FY19 estimates.
Exhibit 1: Estimate changes
Year end |
Normalised EPS (p) |
PBT (£m) |
EBITDA (£m) |
||||||
December |
Old |
New |
% chg. |
Old |
New |
% chg. |
Old |
New |
% chg. |
2017 |
14.7 |
14.1 |
-4 |
73.0 |
68.4 |
-6 |
105.2 |
105.4 |
0 |
2018e |
14.8 |
13.7 |
-7 |
73.6 |
67.7 |
.-8 |
105.5 |
103.8 |
-2 |
2019e |
14.5 |
70.4 |
106.3 |
||||||
Source: Company reports, Edison Investment Research estimates
Ongoing activities deliver a record performance
In FY17 Lookers continued to execute its more focused strategy, following the sale of its specialist, high margin automotive parts distribution business in H216. The strategy remains to develop its dealership network organically combined with shareholder value enhancing acquisitions that extend the geographic reach and brand portfolio in the UK. There were no major acquisitions in the period although the dealerships added by the Warwick Holdings and Knights North West acquisitions contributed around £7m to pre-tax profits. In addition, over the last 18 months 15 underperforming dealerships were sold or closed, further driving the more focused franchise portfolio, with three closures in 2017. This largely completes the existing portfolio reorganisation, but as the market continues to consolidate into fewer larger dealerships with higher throughput and investment requirements, including IT (website etc). Lookers will continue to ensure it is optimising its network.
Exhibit 2: Preliminary results
Year end December |
2015 (£m) |
2016 (£m) |
2017 (£m) |
2017/2016 change (%) |
Revenue |
||||
New cars |
1,835.3 |
2,206.1 |
2,476.8 |
12% |
Used cars |
1,212.1 |
1,437.2 |
1,702.7 |
19% |
Aftersales |
382.9 |
444.9 |
516.8 |
16% |
Motor division |
3,430.3 |
4,088.2 |
4,696.3 |
15% |
Parts division - discontinued* |
218.8 |
193.5 |
- |
|
Group revenues |
3,649.1 |
4,281.7 |
4,696.3 |
10% |
Operating profit |
||||
Motor division |
74.9 |
82.6 |
84.7 |
3% |
Parts division -discontinued* |
12.6 |
12.1 |
- |
|
Operating profit before unallocated costs |
87.5 |
94.7 |
84.7 |
-11% |
Unallocated costs |
-1.6 |
0.0 |
0.0 |
|
Group operating profit |
85.9 |
94.7 |
84.7 |
-11% |
Adjusted pre-tax profit |
||||
Motor division |
64.5 |
69.2 |
71.3 |
3% |
Parts division - discontinued* |
12.6 |
12.1 |
- |
% |
Pre-tax profit reported |
77.1 |
81.3 |
71.3 |
|
Adjustments |
-5.0 |
-4.2 |
-2.9 |
|
Normalised group profit before tax |
72.1 |
77.1 |
68.4 |
-11% |
Gross margin ongoing activities (%) |
11.4 |
11.0 |
10.7 |
|
Gross margin - group (%) |
12.4 |
11.8 |
10.7 |
|
Operating margin - ongoing activities (%) |
2.1 |
2.0 |
1.8 |
|
Operating margin – group (%) |
2.4 |
2.2 |
1.8 |
Source: Lookers trading statement. Note: *10 months trading in FY16, sold on 4 November 2016. Before intangibles amortisation, debt issue costs, pension costs and exceptional items.
In terms of the trading performance for the ongoing business (stripping out the disposal of part distribution business sold in November 2016), FY17 was another record year of performance for Lookers. The improvement was achieved despite a less favourable trading environment as the year progressed, notably in new car markets. Revenues for the ongoing activities rose by 15% to £4.7bn, with 4% like-for-like growth augmented by full year contributions from the two Q416 acquisitions. Gross margins slipped back from 11.00% to 10.73%, largely reflecting an adverse mix shift towards the increased volume of car sales compared to aftersales and parts which generate higher margins. Operating margins for the ongoing business fell to 1.85% (2.06% 2016), reflecting the lower margin contribution from acquisitions, the £2.5m charge to operating profits for head office restructuring taken in December, cost inflation factors such as the living wage and apprenticeship levy, as well as the less favourable trading environment. As a result, although underlying pre-tax profits for the ongoing activities rose by 5% to £68.4m from £64.9m, it fell short of our £73.0m estimate. Adjusted fully diluted ongoing EPS rose by 8% to 14.1p (FY16 13.1p). The dividend was increased 7% to 3.89p, covered 3.6x by adjusted EPS.
Year end net debt of £97.8m was higher than expected due to deferral of two property sale and leaseback programmes in Glasgow and Dublin and a manufacturer deal-driven investment in used car stock in December. Both elements are expected to unwind this year, resulting in cash inflows in excess of £40m. The car stock was largely traded out in January and the Glasgow deal has already completed. While the terms of the Dublin deal were unattractive leading to its deferral, Lookers expects to complete an alternative transaction this year if a revised agreement cannot be reached.
Underlying retail operations outperform markets
Lookers is now fully focused on automotive retail activities in the UK. Its operations consist of 155 franchised dealerships operating from 100 locations across the UK and Ireland and representing 32 brands. Sales rose by 15% to £4.70bn on FY16, with pre-tax profits from the ongoing activities up 5% to £68.4m. The year started strongly as changes to VED rates on first-time, new car registrations came in to force on 1 April 2017. The changes had pulled new car sales into Q117, which reached record levels as a result. Thereafter the negative factors that had been in place since the Brexit vote came back into play and new car demand from retail buyers fell in the remainder of the year. The concerns raised over PCP finance and diesel engine cleanliness also created uncertainty.
UK market conditions therefore became less favourable as the year progressed, with a clear slow-down in retail demand during H2. Despite continued support from the OEMs by way of incentives, UK new car registrations to fell by 5.6% from record levels in 2016 to 2.54m units, still representing a historically high level of demand. Within this, sales to retail buyers, which accounted for 48% of new car sales and tend to attract higher margins, fell 6.8% with a 4.7% decline in sales to the fleet segment. Used car transactions also fell modestly for the year overall but remained generally more robust at around 8m transactions overall. Growth in the vehicle parc of cars up to three years old continued in 2017 reflecting the high level of new car sales in recent years, and supporting improved aftermarket sales, especially given the increase in service plans in contract.
Exhibit 3: Lookers divisional analysis
Turnover (£m) |
Gross profit (£m) |
Gross margin (%) |
|||||||||||
Division |
2016 |
2017 |
% change |
2016 |
2017 |
% change |
2016 |
2017 |
change bps |
||||
New cars |
2,206 |
2,477 |
12% |
161 |
165 |
3% |
7.3% |
6.7% |
-60 |
||||
Used cars |
1,437 |
1,702 |
18% |
105 |
133 |
27% |
7.3% |
7.8% |
+50 |
||||
Aftersales |
365 |
409 |
12% |
166 |
189 |
14% |
45.5% |
46.2% |
+70 |
||||
Leasing & other |
80 |
108 |
35% |
17 |
17 |
0% |
21.3% |
15.7% |
-60 |
||||
Group - ongoing |
4,088 |
4,696 |
15% |
449 |
504 |
15% |
11.0% |
10.7% |
-30 |
||||
Parts division - discontinued |
193 |
- |
55 |
- |
28.5% |
- |
|||||||
Group |
4,281 |
4,696 |
10% |
504 |
504 |
0% |
11.8% |
10.7% |
-110 |
||||
Like-for-like turnover (£m) |
Like-for-like gross profit (£m) |
Like-for-like gross margin (%) |
|||||||||||
Division |
2016 |
2017 |
% change |
2016 |
2017 |
% change |
2016 |
2017 |
change bps |
||||
New cars: retail |
1,477 |
1,499 |
2% |
127 |
134 |
6% |
8.6% |
8.9% |
30 |
||||
New cars: fleet |
926 |
978 |
6% |
34 |
31 |
-9% |
3.7% |
3.2% |
-50 |
||||
Used cars |
1,518 |
1,702 |
12% |
116 |
133 |
15% |
7.6% |
7.8% |
20 |
||||
Aftersales |
395 |
409 |
4% |
183 |
189 |
3% |
46.3% |
46.2% |
08 |
||||
Group – cont. (ex leasing) |
4,316 |
4,588 |
6% |
470 |
487 |
4% |
10.9% |
10.7% |
-20 |
||||
Source: Lookers, Edison Investment Research
New cars: New car revenues rose by 12% to £2.48bn, up 3% on a like-for-like basis. Gross profits rose by 2.6% on a like-for-like basis, with a marginal decline in margins. However, this reflected a mix effect between the two segments, retail and fleet. Unit volumes fell by 4.4% in retail and rose 1.4% in fleet, modestly outperforming the declines of 6.8% and 4.7% in the respective market segments. The gross margins for fleet sales fell some 50bp on a like-for-like basis, as Lookers continued to invest to increase market share, which remains lower than in retail sales. It continues to target quality fleet sales and to avoid very low margin business. Fleet sales rose 17.6% or 5.6% on a like-for-like basis reflecting the increased value per vehicle. In retail Lookers managed to expand gross margins on a like-for-like basis despite the tougher than expected market during the year.
While the trends in the UK new car market have continued in early 2018, manufacturers have remained supportive with continued attractive finance packages and adjusted target levels to reflect the market reality. In the first two months of the year registrations are down 5.1%, with fleet sales down 2.1% private buyers down 7.1% and the smaller business segment down 29.8%. The SMMT forecast of forecasts currently envisages these trends to persist through 2018 with an overall market decline of 5.6% (2.398m cars) anticipated for the full year, and a further 2.1% decline expected in 2019. We expect Lookers to continue to outperform these trends, with orders for the important March 2018 selling period in line with management’s expectations, although these are, unsurprisingly, lower than the record seen in 2016 for reasons explained earlier.
The impact of PCP concerns appears to have been limited to perhaps some deferral of purchasing decisions. Finance levels at 81% of Lookers’ new car sales in 2017 (83% in 2016) of which 84% were on PCPs, the same level as the previous year. Of all new car sales (including cash buyers) the use of PCPs dropped slightly to 68% and looks mature but robust. A report from the FCA on the use of PCPs is expected towards at the end of March 2018. We expect this to positively reflect on the financing benefits from most sides of the equation; certainty of cost, fixed rates, lower capital risk to the consumer and relatively short term. Compliance and credit risk are likely to be the main focus, but these are areas where we feel the larger dealerships such as Lookers already behave with rigour. There is undoubtedly some risk that further compliance, regulation and record keeping could add modestly to costs.
|
Exhibit 4: Penetration of PCP finance in Lookers’ new and used car sales |
|
|
Source: Lookers |
Used cars: Lookers has continued the strong performance of recent years in the used car segment. Used car revenues rose by 18% to £1.70bn, including an impressive 12% like-for-like increase. Like-for-like gross profits rose by 15%, with reported gross profits up 27% reflecting a 50 bp rise in achieved gross margins. In the context of an indicated modest drop in used car market and some fluctuation in residual values during the year, especially for used diesel vehicles, the performance was all the more impressive. Lookers appears to be able to continue to improve market share with robust profitability, despite an increasing number of available vehicles.
The focus remains on the quality of sourcing and a continued discipline in stock turn, areas in which Lookers has made significant investment in recent years. The number of website leads increased 34% year-on-year, which we estimate equates to more than 16m website visits, and further development continues.
Despite the strong progress, the used cars segment is still seen by management as a fundamental medium-term growth opportunity. The ambition to improve used car throughput at underperforming franchises remains a key driver. The utilisation of PCPs in newer used car sales also continued to increase in 2017 reaching 50% of total financed used sales. We expect Lookers to achieve further increases in used car market share during the forecast period, with good margin discipline.
Aftermarket: The continuing growth of the one- to three-year-old vehicle parc in the UK remains a positive driver for the group’s high margin aftersales activities, which generated 41% of group gross profit in 2017. In addition, there was a continued increase in cumulative levels of live service plan contracts which have now breached 100,000 for the first time, with a stable penetration rate of 38% of vehicles sold.
Revenues rose by 12% to £409m last year, including like-for-like revenue growth of 4%; with gross margins widening to 46.2%, improving gross profits by 14% (3% like-for-like) to £189m. Improving customer retention levels remains a key focus, and investment in systems to improve the experience continues, as does a focus on cost management to improve profitability. We expect growth to continue in aftersales during the forecast period.
2018 outlook
The overhang of Brexit negotiations probably remains the greatest factor inducing uncertainty among both retail and fleet vehicle purchasers. Unfortunately, this is unlikely to dissipate in 2018, and while the falls in new and used vehicle markets are expected, the declines are contained and the overall levels remain high in comparison to history. There are no signs at present of a disruptive cyclical collapse in demand such as was experienced during the financial crisis of 2008/9.
The economic backdrop remains mixed. Longer-term population growth remains a key driver, although net immigration appears set to fall. New car price increases in response to sterling weakness appear to have largely worked through the market, and sterling has now stabilised. However, while employment remains at record high levels, inflation has been rising thus having an impact on household real disposable incomes and leading to a modest rise in interest rates, although these remain favourable in a historic context. Consumer confidence remains negative.
As mentioned, the UK new car market has started 2018 in much the same fashion as it ended 2017. However, the market comparisons in early 2017 were strong and we suspect that, despite the economic factors mentioned above, the year-on-year declines may abate as 2018 develops. The 5.1% drop in registrations in the first two months of the year and the SMMT forecast for 2018 of a 5.6% decline in UK new car sales for the year implies a deteriorating trend, which most managements are likely to plan for. Any upside would thus be a welcome benefit.
Lookers has already responded by adjusting head office costs to the projected slower market development by stripping out several senior group level positions at head office with a £3m expected benefit to costs in 2018. January trading appears to have been boosted by trading of the used stock package bought towards the end of 2017, and strong order cover of 44% for the all-important March selling period was at a higher level than 2017, albeit based on a lower sales budget reflecting the positively distorted market in Q117.
With PCPs expected to remain a finance tool for both new and used car sales, used car sales should be supported with a growing stream of high quality relatively young product as well as providing a rising parc of vehicles to support service operations.
Lookers looks well positioned to continue to outperform new and used markets that remain under pressure, with flows in the used car and aftersales activities likely to rise consistent with the increased one- to three-year-old car parc. While the medium term is far from certain, Lookers is also starting to see more opportunities in M&A, which could augment organic growth as vendor expectations reflect the tougher market, and has the financial capacity to respond as appropriate.
Sensitivities
■
Performing in a mature market – management has acted to preserve and build share in a mature and competitive market. While the very severe market conditions encountered in 2008 and 2009 affected all motor dealers, Lookers' management has since invested in increasing the sizes of its franchise territories, enabling the group to employ local management more effectively. At the same time Lookers has consistently extended its used car and aftermarket operations across the network, adding considerable gross profit, without a commensurate rise in establishment costs.
■
Macroeconomic factors – like other dealership groups, Lookers cannot be immune from either a major downturn in demand or an unexpected downturn in used car values (as happened in 2008). However, because vehicles deteriorate with age, there is a built-in replacement cycle (usually up to three years), to which many motorists seem to subscribe. Registration plates showing the age of a particular vehicle seem to encourage this trend to continue, while the company car is still seen as one of the most important business perks. The UK automotive market is mature, having recently peaked in 2016 at similar levels to the previous record in 2003. Population trends suggest the market should be relatively stable at around current volumes. Variations in interest rates and FX can influence affordability and thus demand, although increased penetration of PCP finance should help to reduce the risk.
■
Performance of individual marques – specific company performance is likely to be affected by the variable performances of individual marques, related to the timing of new model introductions, temporary reliability problems, adherence to emissions standards and the effectiveness of sales incentive schemes for dealers. However, there is a greater degree of immunity in larger dealership groups such as Lookers because of the spread of its business, so that any adverse impact with one OEM will be balanced by the stronger performances elsewhere. Another factor will be the trend in consumer preference in respect of prestige models and fuel type, which differ within each manufacturer’s model range. Lookers’ portfolio of franchises is balanced between volume and prestige vehicles, with much recent investment aimed at the latter segment of the market.
■
Pension deficit – Lookers operates three defined benefit pension schemes, each of which is closed to new entrants and future accruals. The IAS 19 deficit decreased by £12.2m after deferred tax to end the year at £52.9m.
Valuation
Despite the growth to record performance levels in the ongoing dealership businesses, Lookers’ share price continued its decline, falling almost 25% over the last 12 months. While the disposal of the parts business in November 2016 was dilutive, group level fully diluted adjusted EPS of 14.14p was only 9% lower than in FY16 (15.55p), which was a record level. Fully diluted adjusted EPS for the ongoing businesses rose 7.7% to 14.14p from 13.13p. The derating over the last 12 months is therefore substantial (c 25% on a year-forward basis), with Lookers trading on a FY19e P/E of just 6.2x. While the whole automotive retailing sector has faced the same declining market backdrop, Lookers has seen one of the largest share price falls in its peer group. This looks extremely cautious in our opinion, given there had already been a derating in 2016. Management has responded by initiating a £10m share buyback programme, reflecting a clearly more favourable view of the value proposition.
In addition, while the dividend was increased by 7% to 3.89p, the current historic yield now stands at 4.4% with fully diluted EPS cover of over 3.6x.
Exhibit 5: Peer group comparison
|
Price |
Market cap |
FY17 revenue |
P/E (x) |
P/E (x) |
(p) |
(£m) |
(£m) |
2018e |
2019e |
|
Cambria Auto |
64.0 |
64 |
644 |
8.4 |
7.9 |
Lookers |
.89.0 |
353 |
4,696 |
6.4 |
6.9 |
Marshall Motor Holdings |
162.5 |
126 |
2,269 |
7.0 |
6.8 |
Pendragon |
23.8 |
337 |
4,739 |
6.8 |
6.3 |
Vertu Motors |
44.0 |
1675 |
2,823* |
7.4 |
7.7 |
Simple average |
|
|
|
7.2 |
7.1 |
FTSE All Share General Retailers Index |
|
|
|
12.1 |
11.2 |
Source: Bloomberg, Edison Investment Research. Note: Prices at 04 April 2018, *Bloomberg estimate.
The average prospective P/E rating of 7.1x for 2019 for the automotive retailers is now some 37% below the 11.2x of the FTSE All-Share General Retailers Index. The market continues to appear to be far more conservative than with other types of retailer, reflecting historic cycles. However, the continued trend in dealership consolidation, with the larger groups such as Lookers continuing to build market share while maintaining balance sheet discipline, should increase resilience, in our view. We do not think this is reflected by the current rating, which appears to be discounting a sharper and/or prolonged slowing of car demand that current market dynamics and economic factors do not suggest.
In FY17 Lookers’ dealership operations continued to develop positively, delivering record results, continuing a decade-long trend. Although organic progression is likely to prove even more challenging in FY18, we feel the investment levels and cost actions already undertaken should help to drive profitability modestly ahead this year. The ratings for the subsector and Lookers more specifically should start to more appropriately reflect this as the year develops, especially if enhanced by value-adding M&A.
Financials
Year-end net debt of £97.8m (FY16 £74.1m) came in around £35m above our expectations largely due to the absence of two anticipated property sale and leaseback deals and the investment in a manufacturer’s used inventory late in the year. Both are transient and should unwind in FY18, with the underlying operational cash performance remaining relatively positive. Therefore, we are forecasting a substantial reduction in net debt for the current year in the region of £40m. Management has now commenced the relatively modest £10m share buy back programme which we have adjusted for in our estimates.
The high levels of investment in both facilities and IT systems continued, reaching £46.1m in 2017. Hire fleet investment was essentially neutral during the period, compared to a £6.3m investment in 2016. The dividend payments rose by £1.8m to £15.0m and tax and interest absorbed an additional £10.0m. With no M&A, the disposal of fixed assets raised just £8.0m, and net debt rose by £23.6m.
We expect the high levels of investment in digital marketing and higher standards of customer experience will continue for the next few years, with investment in facilities levelling out. The requirements combined with unutilised headroom in its borrowing facilities should leave ample funds available for appropriate, enhancing acquisitions. Net debt to EBITDA at 0.95x at the year end was towards the middle of the targeted range of 0.5x to 1.5x, or lower end when adjusted for the year-end anomalies. Year-end gearing was 25%.
Net assets had grown to £385m, supported by £309m of freehold and long leasehold properties worth 78p per share. With significant financing facilities also available, Lookers remains well positioned to invest in appropriate M&A opportunities as they arise.
Exhibit 6: Financial summary
£m |
2015 |
2016 |
2017 |
2018e |
2019e |
||
Year end 31 December |
IFRS |
IFRS |
IFRS |
IFRS |
IFRS |
||
PROFIT & LOSS |
|||||||
Revenue |
|
|
3,430.3 |
4,088.2 |
4,696.3 |
4,743.9 |
4,884.5 |
Cost of Sales |
(3,039.6) |
(3,638.7) |
(4,192.2) |
(4,234.7) |
(4,360.2) |
||
Gross Profit |
390.7 |
449.5 |
504.1 |
509.2 |
524.3 |
||
EBITDA |
|
|
84.4 |
97.6 |
105.4 |
103.8 |
106.3 |
Operating Profit (before amort. and except.) |
|
|
73.4 |
82.5 |
84.7 |
83.3 |
85.7 |
Intangible Amortisation |
0.0 |
0.0 |
0.0 |
0.0 |
0.0 |
||
Exceptionals |
(9.3) |
14.7 |
(10.0) |
(12.1) |
(12.1) |
||
Other |
0.0 |
0.0 |
0.0 |
0.0 |
0.0 |
||
Operating Profit |
64.1 |
97.2 |
74.7 |
71.2 |
73.5 |
||
Net Interest |
(13.8) |
(17.6) |
(16.3) |
(15.6) |
(15.3) |
||
Profit Before Tax (norm) |
|
|
59.6 |
64.9 |
68.4 |
67.7 |
70.4 |
Profit Before Tax (FRS 3) |
|
|
50.3 |
79.6 |
58.4 |
55.6 |
58.3 |
Tax |
(9.4) |
(7.9) |
(10.5) |
(11.4) |
(11.8) |
||
Profit After Tax (norm) |
50.2 |
53.3 |
57.9 |
55.5 |
57.7 |
||
Profit After Tax (FRS 3) |
40.9 |
71.7 |
47.9 |
44.2 |
46.4 |
||
Average Number of Shares Outstanding (m) |
394.4 |
396.4 |
397.3 |
393.2 |
386.9 |
||
EPS - normalised (p) |
|
|
12.7 |
13.4 |
14.6 |
14.1 |
14.9 |
EPS - normalised fully diluted (p) |
|
|
12.44 |
13.13 |
14.14 |
13.71 |
14.46 |
EPS - (IFRS) (p) |
|
|
10.4 |
18.1 |
12.1 |
11.3 |
12.0 |
Dividend per share (p) |
3.1 |
3.6 |
3.9 |
4.1 |
4.3 |
||
Gross Margin (%) |
11.4 |
11.0 |
10.7 |
10.7 |
10.7 |
||
EBITDA Margin (%) |
2.5 |
2.4 |
2.2 |
2.2 |
2.2 |
||
Operating Margin (before GW and except.) (%) |
2.1 |
2.0 |
1.8 |
1.8 |
1.8 |
||
BALANCE SHEET |
|||||||
Fixed Assets |
|
|
441.2 |
536.5 |
563.2 |
572.2 |
595.9 |
Intangible Assets |
158.3 |
217.4 |
221.2 |
220.5 |
219.8 |
||
Tangible Assets |
282.9 |
319.1 |
342.0 |
351.7 |
376.1 |
||
Investments |
0.0 |
0.0 |
0.0 |
0.0 |
0.0 |
||
Current Assets |
|
|
1,143.9 |
1,171.3 |
1,332.4 |
1,320.4 |
1,361.8 |
Stocks |
816.0 |
839.4 |
984.1 |
948.8 |
957.4 |
||
Debtors |
319.6 |
292.1 |
303.0 |
316.3 |
329.1 |
||
Cash |
8.3 |
39.8 |
45.3 |
55.3 |
75.3 |
||
Other |
0.0 |
0.0 |
0.0 |
0.0 |
0.0 |
||
Current Liabilities |
|
|
(1,085.4) |
(1,130.3) |
(1,294.2) |
(1,228.2) |
(1,251.9) |
Creditors |
(1,002.0) |
(1,105.2) |
(1,228.1) |
(1,228.2) |
(1,251.9) |
||
Short term borrowings |
(83.4) |
(25.1) |
(66.1) |
0.0 |
0.0 |
||
Long Term Liabilities |
|
|
(201.9) |
(235.8) |
(216.4) |
(261.0) |
(272.5) |
Long term borrowings |
(86.6) |
(88.8) |
(77.0) |
(119.4) |
(128.7) |
||
Other long term liabilities |
(115.3) |
(147.0) |
(139.4) |
(141.6) |
(143.8) |
||
Net Assets |
|
|
297.8 |
341.7 |
385.0 |
403.4 |
433.3 |
CASH FLOW |
|||||||
Operating Cash Flow |
|
|
32.9 |
130.5 |
65.9 |
122.2 |
104.4 |
Net Interest |
0.0 |
(13.8) |
(17.6) |
(16.3) |
(15.6) |
||
Tax |
0.0 |
(17.3) |
(10.5) |
(11.4) |
(11.8) |
||
Capex |
(36.0) |
(45.5) |
(54.2) |
(50.2) |
(50.1) |
||
Acquisitions/disposals |
(104.4) |
18.9 |
0.0 |
0.0 |
0.0 |
||
Financing |
0.9 |
0.0 |
0.0 |
(10.0) |
0.0 |
||
Dividends |
(11.6) |
(13.2) |
(15.0) |
(15.7) |
(16.3) |
||
Other |
8.4 |
28.0 |
7.7 |
15.0 |
0.0 |
||
Net Cash Flow |
(109.8) |
87.6 |
(23.7) |
33.7 |
10.7 |
||
Opening net debt/(cash) |
|
|
51.9 |
161.7 |
74.1 |
97.8 |
64.1 |
HP finance leases initiated |
0.0 |
0.0 |
0.0 |
0.0 |
0.0 |
||
Other |
0.0 |
0.0 |
(0.0) |
0.0 |
(0.0) |
||
Closing net debt/(cash) |
|
|
161.7 |
74.1 |
97.8 |
64.1 |
53.4 |
Source: Company reports, Edison Investment Research ongoing business
Edison is an investment research and advisory company, with offices in North America, Europe, the Middle East and AsiaPac. The heart of Edison is our world-renowned equity research platform and deep multi-sector expertise. At Edison Investment Research, our research is widely read by international investors, advisers and stakeholders. Edison Advisors leverages our core research platform to provide differentiated services including investor relations and strategic consulting. Edison is authorised and regulated by the Financial Conduct Authority. Edison Investment Research (NZ) Limited (Edison NZ) is the New Zealand subsidiary of Edison. Edison NZ is registered on the New Zealand Financial Service Providers Register (FSP number 247505) and is registered to provide wholesale and/or generic financial adviser services only. Edison Investment Research Inc (Edison US) is the US subsidiary of Edison and is regulated by the Securities and Exchange Commission. Edison Investment Research Pty Limited (Edison Aus) [46085869] is the Australian subsidiary of Edison. Edison Germany is a branch entity of Edison Investment Research Limited [4794244]. www.edisongroup.com DISCLAIMER |
Frankfurt +49 (0)69 78 8076 960 Schumannstrasse 34b 60325 Frankfurt Germany |
London +44 (0)20 3077 5700 280 High Holborn London, WC1V 7EE United Kingdom |
New York +1 646 653 7026 295 Madison Avenue, 18th Floor 10017, New York US |
Sydney +61 (0)2 8249 8342 Level 12, Office 1205 95 Pitt Street, Sydney NSW 2000, Australia |
Frankfurt +49 (0)69 78 8076 960 Schumannstrasse 34b 60325 Frankfurt Germany |
London +44 (0)20 3077 5700 280 High Holborn London, WC1V 7EE United Kingdom |
New York +1 646 653 7026 295 Madison Avenue, 18th Floor 10017, New York US |
Sydney +61 (0)2 8249 8342 Level 12, Office 1205 95 Pitt Street, Sydney NSW 2000, Australia |
In March 2018, Cellular Biomedicine Group (CBMG) announced results from the Phase I study of AlloJoin for knee osteoarthritis (KOA). The primary endpoint was safety, and the adverse event (AE) profile was similar to previous studies, with pain and swelling as the primary effects. The company did not release detailed efficacy data, but it appears that the treatment effect was sustained for 48 weeks, and it appeared to stop cartilage degradation.