Last close As at 05/08/2026
—
— 0.00 (0.00%)
Market capitalisation
—
Research: Industrials
Lookers
Written by
Lookers |
Plenty of action |
Interim results |
Retail (automotive) |
31 August 2016 |
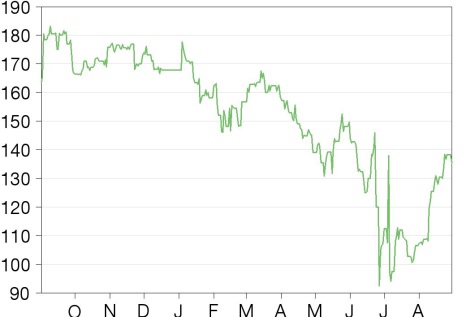
Share price performance
Business description
Next events
Analysts
Lookers is a research client of Edison Investment Research Limited |
|||||||||||||||||||||||||||||||||||||||||||||||
In just two weeks, Lookers successively announced the planned £120m disposal of its Parts division, a £55m acquisition, a fine set of interim results and, finally, another £27m acquisition introducing BMW/MINI to the group. All point positively to the future, yet the shares languish at 30% below their 12-month high and at a 45% P/E discount to the retail sector.
Year |
Revenue (£m) |
PBT* |
EPS* |
DPS |
P/E |
Yield |
12/14 |
3,043 |
65.0 |
13.21 |
2.84 |
10.3 |
2.1 |
12/15 |
3,649 |
72.1 |
14.88 |
3.12 |
9.1 |
2.3 |
12/16e |
4,250 |
80.0 |
16.27 |
3.50 |
8.3 |
2.6 |
12/17e |
4,650 |
80.0 |
16.27 |
3.70 |
8.3 |
2.7 |
Note: *PBT and EPS are normalised and diluted, before intangibles amortisation, debt issue costs, pension costs and exceptional items.
Interims ahead of expectations
As indicated in our pre-close update report, Lookers performed strongly in H116, lifting underlying PBT by 16% to £50.1m, ahead of our £48.5m target. This was achieved in a more challenging trading environment, with improved vehicle availability putting some pressure on margins. Consistent investment by management, especially last year’s acquisition of Benfield Motors, was the key factor. H2 trading will be affected by corporate activity, notably the earnings dilutive disposal of the group’s Parts division. We are leaving our full year estimate unchanged, but have reduced our 2017 underlying PBT target by £3m to £80m.
Positive industry dynamics
Industry dynamics remain positive, with the leading groups gaining market share at the expense of the smaller independent operators. While the margin pressures are likely to remain in the immediate future, they will also raise the number of acquisition opportunities. Lookers has acquired leading Mercedes Benz and BMW/ MINI distributors for a total of £82m in two earnings enhancing deals surrounding the results announcement. We look for continued investment across the group’s dealership network, lifting the immediate and longer-term potential; meanwhile the group has a strong balance sheet to finance its ongoing acquisitive ambitions.
Borrowings down again
Sharp reductions in working capital contributed to an £87m reduction in net debt from £162m to £75m; disposal proceeds will reduce debt further in H2. With facilities totalling £240m and the potential to lift its term loan by a further £30m, Lookers is financially well placed to respond quickly to opportunities that emerge.
Valuation: Weakness based on false premise
Lookers’ share price is 27% below its 12-month high and, even after its recent rally, is 2% below its pre-Brexit level. The prospective P/E rating (8.3x 2016 adjusted EPS) is nominally above that of other motor retailers, but 42% below that of the Retail sector (14.2x); this belies the 9.2% CAGR in adjusted EPS over the past 12 years and the potential from recent investment and positive industry dynamics.
Investment summary
Company description: Leading UK motor dealership group
Lookers is a leading UK franchised motor distribution group. It has been built by a combination of organic growth and acquisitions, delivering an impressive and consistent trading record over many years. Lookers has strong relationships with its OEM partners and has established a number of strong geographical sales territories, from which the group can generate consistent and growing returns. There are key regional presences in Northern Ireland, Scotland and the South-East and across northern England. Lookers also operates a specialist automotive parts distribution business (17% of profits); terms have been agreed for the sale of this business by October 2016.
Valuation: Potential not recognised
Share prices across the UK motor retail subsector have fallen away in recent months. On average, the shares currently stand at a 28% discount to their 12-month high, and have slipped back by 10% since publication of the result of the Brexit referendum. If there is a recession, the typical well-managed motor dealership, with c 35% of gross profit generated from new vehicle sales, would appear far less vulnerable than many other types of retailer. Moreover, the c 45% of profit generated in the aftermarket looks secure; cars will continue to be serviced. With motor retailers valued at little more than half the P/E rating for the retail sector (8.1x vs 14.2x based on calendar 2016 estimates), the whole sector offers real value. Lookers has delivered 9.2% CAGR in diluted adjusted EPS since the new car market high point back in 2003 and has produced record pre-tax profits in each of the past seven years. This record justifies a higher rating, especially with the current disposal proceeds of its Parts division likely to be reinvested in earnings enhancing assets.
Financials
■
Interim results show underlying pre-tax profits up by 16% to £50.1m, comfortably above our £48.5m estimate. Temporary earnings dilution related to a major disposal means that we are leaving our full year estimate unchanged, but we have reduced our 2017 estimate by £3m to £80m. The interim dividend is raised by 20%.
■
Strong working capital control contributed to a sharp reduction in net debt from £162m to £75m; receipt of substantial disposal proceeds will drop borrowings even further in H2.
Exhibit 1: Estimate changes
To December |
EPS (p) |
PBT (£m) |
EBITDA (£m) |
||||||
Old |
New |
% chg. |
Old |
New |
% chg. |
Old |
New |
% chg. |
|
2015 |
14.88 |
14.88 |
N/A |
72.1 |
72.1 |
N/A |
99.6 |
99.6 |
N/A |
2016e |
16.14 |
16.27 |
+1 |
80.0 |
80.0 |
Unch |
109.5 |
115.0 |
+5 |
2017e |
16.71 |
16.27 |
-3 |
83.0 |
80.0 |
-4 |
112.5 |
115.5 |
+3 |
Source: Lookers RNS; Edison Investment Research Note: *PBT and EPS are normalised and diluted, before intangibles amortisation, debt issue costs, pension costs and exceptional items..
Sensitivities
In theory, motor retailers would be expected to see their fortunes fluctuate with shifts in consumer confidence. In practice, the market has been remarkably resilient, with its highly fragmented nature enabling the leading operators to respond effectively to predictable challenges. The UK new car market is mature; record new vehicle registrations in 2015 were marginally above the previous record, which had been established in 2003. However, there is much more to motor retailing than new car sales: Lookers operates an effective and growing used vehicle retail operation within its franchised dealerships, while aftermarket operations in the form of service and parts is a relatively high-margin consistent support business, generating more than 40% of gross profits. These downstream activities often have different cycles.
Leading UK motor retail group
Lookers is the third largest UK motor dealership group; in terms of market capitalisation, it is the largest of the purely UK businesses quoted on the London Stock Exchange. Inchcape is much larger, but, with a major global footprint and a focus on distribution, is materially different; Pendragon has higher annual revenues, but a slightly lower capitalisation. Lookers has grown consistently over many years, employing a decentralised management style that delegates decision-making to the sharp end. The strategy involves organic growth, supported by a series of strategic acquisitions. Individual franchises are developed by strengthening local management and extending the scope of each operation, with a fundamental policy of limiting the reliance on the new car market.
Lookers’ basic business is the sale of new and used vehicles, supported by a highly remunerative aftermarket operation, involving servicing, repair and parts distribution. It has a national presence in motor retailing, operating more than 160 new car franchises, covering 33 different marques, from more than 90 sites. The group also operates an independent parts business servicing the independent repair sector, supplying through the national network of motor factors; Lookers has announced the planned disposal of this business for £120m, to be completed by end October 2016.
The group has national coverage, including several major regional clusters, notably in Northern Ireland (where the group is the clear market leader, trading as Charles Hurst). Other key regions are North-West and South-East England, and southern Scotland; a strong presence in the North-East England was added by acquisition in late 2015. Lookers represents all of the leading marques and has developed important long-term relationships with each of its core OEM suppliers – many of the franchises regularly receive accolades as among the best in the country from the various manufacturers.
Organic growth is being achieved largely by maximising the throughput from any specific location. This inevitably involves extending the used car and aftermarket operations in each franchise. There is an obvious benefit from lifting revenues without a commensurate rise in infrastructure costs, while action to optimise the used car inventory profile will have a material impact on returns. Moreover, there is a clear link between retail vehicle sales and subsequent aftermarket demand – investment in CRM and the availability of PCPs (personal contract purchase agreements) on used cars and the sale of service plans, for example, are helping to lift higher-margin aftersales revenues. Group management is quite willing either to extend or to relocate premises to support the aspirations of individual teams.
As mentioned above, each year there is a flow of positive reactions from the OEMs, which can lead to new opportunities in the form of acquisitions, sales territory extensions, or special support opportunities/incentives in conjunction with OEMs on specific vehicle models. In a fragmented industry (the top 10 dealership groups command little more than 20% of the market) there are always acquisition opportunities. Privately-owned businesses frequently come up for sale, either because of the difficulties in raising the finance necessary to develop facilities to meet the expectations of the OEMs, or simply because of a lack of succession. Consolidation has been a feature across the sector for several years and looks set to continue for some time.
Decentralised management
Lookers operates a decentralised style of management, empowering those at the sharp end, but with strict central control of costs and cash. There is a tier of franchise directors responsible for the group’s day-to-day contact with, and the development of its relationship with, each OEM.
The manager of a specific dealership is responsible for it as a profit centre, deciding strategy in terms of inventory profile and whether to participate in the various promotions being organised by the OEMs. The franchise director will seek out special sales opportunities, which are passed on to the various dealership managers, often making recommendations. However, the final decisions (subject to cash limits) remain with the individual dealership manager. Naturally, those who fail to deliver the required returns tend not to last very long.
This style of management has stood the test of time. Difficulties encountered in 2008, involving sharp progressive reductions in used car values, were felt across the whole motor market; the response from Lookers was speedy and effective. There were key personnel changes at the highest level as part of a major business restructuring, which left the group well placed to respond quickly and effectively to the subsequent stabilisation and steady recovery in the market. A concurrent strengthening of the group balance sheet (rights issue) provided management with the resources to respond quickly to opportunities in the market place.
The fundamental board changes at that time included the appointment of an experienced new chief executive and finance director. Lookers quickly returned to health, delivering record underlying pre-tax profits in 2009. Peter Jones, who was appointed CEO at this time, retired at the end of 2013 and was replaced by Andy Bruce. Andy joined Lookers in 2000, following a number of highly successful years at Land Rover, concluding with the role of UK sales director. He had been appointed group COO in March 2013 and was the natural successor. Nigel McMinn joined the group as MD of the Motor division shortly after Andy’s promotion to group COO; he has an impressive record in the sector, including key roles successively at Reg Vardy, Pendragon and then as CEO of Benfield Motors – the latter was subsequently acquired by Lookers in 2015.
Consistent trading record
The UK motor market is mature, with new vehicle registrations peaking last year at levels little different from the previous record, achieved 13 years ago in 2003. Over this period, Lookers has delivered 9.2% CAGR in diluted EPS, including record underlying pre-tax profits in each of the past seven years. This demonstrates the ability of a strong management team to respond effectively to the opportunities presented in a fragmented market.
Exhibit 2: 10-year trading record
Year to December |
2006 |
2007 |
2008 |
2009 |
2010 |
2011 |
2012 |
2013 |
2014 |
2015 |
Revenue (£m) |
1,426.7 |
1,680.0 |
1,775.9 |
1,749.0 |
1,883.8 |
1,898.5 |
2,056.6 |
2,465.5 |
3,042.9 |
3,649.1 |
Operating profit (£m) |
36.7 |
40.0 |
33.9 |
45.1 |
46.9 |
45.2 |
49.2 |
58.4 |
78.8 |
85.9 |
Pre-tax profit (£m) |
26.4 |
24.7 |
14.0 |
28.3 |
33.6 |
33.8 |
38.0 |
48.1 |
65.0 |
72.1 |
EPS (p) |
10.6 |
10.0 |
4.7 |
7.2 |
6.5 |
7.0 |
7.6 |
10.2 |
13.2 |
14.9 |
Source: Lookers RNS. Note: PBT and EPS are normalised and diluted, before intangibles amortisation, debt issue costs, pension costs and exceptional items.
UK motor retail market
The UK motor retail sub-sector was re-rated over the two years to spring 2014, with all companies substantially outperforming the FTSE All-Share Index. An extended period of consolidation ended earlier this year, with share prices drifting backwards, initially reflecting fears about consumer spending trends. More recently, the market took an adverse view of Brexit, with concerns about the new car market, especially the likely impact of sterling weakness on new car prices.
We have, for some time, espoused the view that the market underrates motor dealerships – fears about the maturity of the market, the low margins and the perceived volatility of new car sales have taken precedence over the opportunities inherent in a fragmented franchise market, an active used car market and the consistent quality of aftermarket earnings. Trading performances in recent years bear out the ability of a quality management team to respond to this opportunity. The quoted dealership groups have delivered consistent profits growth over the past five years and are all on course to deliver record profits again in the current year. This belies the fact that, while the new car market was at record levels last year and is running slightly ahead in 2016, registration figures are only nominally above the previous record level in 2003.
New car market
SMMT figures for the first six months of 2016 show new car registrations up by 3.9% to 1.42m vehicles. This improvement conceals a continued more challenging trading environment, with a switch towards fleet purchases outpacing a modest 1.9% rise in private registrations. The latest SMMT UK forecast for the full year still suggests a small year-on-year increase in registrations to 2.70m, but was published prior to the Brexit vote. Several industry participants have indicated a modest reduction in their targets, suggesting that registrations may still rise year-on-year, but the final figure may be closer to the 2.63m registered in 2015.
UK motor retailers have, in recent years, benefited from weak markets across much of Europe, with the global OEMs fighting for share in one of the continent’s few growing markets. Support from the OEMs continues, despite last year’s useful recovery in several European markets. There remains substantial global manufacturing overcapacity, with few OEMs showing signs of reducing production levels. The recent weakness of sterling relative to the euro will have eaten into OEM gross margins but so far there seems little pressure for price rises; most industry estimates for 2017 still suggest a small rise in new car volumes. Both Ford and PSA have indicated a desire for small price rises, but PCP terms appear not to have been affected.
The level of customer monthly payments is a key factor in vehicle purchase decisions. The progressive reduction in interest rates and the support from OEMs means that payments are close to, or below, the levels of five years ago. This has led to natural fears about rising interest rates – a 0.5% rate rise would typically add up to £3 (2%) to the monthly payment on a standard small car. We believe that increased affordability has led to sustained demand for new cars and a steady increase in switching to higher specification or shifting allegiance to premium brands. The built-in trading pattern related to the length of PCP contracts suggests to us that growing numbers of consumers are enjoying the benefits of driving a new car. This should at least help to sustain new car volumes at around current levels; if the consumer climate does become more challenging, we would look for a shift back towards lower specification vehicles, rather than a drop in new car sales.
There has been much comment about the possible impact of Brexit, as indicated by the under performance of the sector since the result of the referendum. The vast majority of new cars sold in the UK are imported, mostly from Europe and the Far East. Similarly, the majority of UK output is exported – OEM plants build for global distribution. The UK is the second largest European market and one of the most important export markets for both German and French manufacturers. It is illogical to think that EU politicians will do anything to undermine their key export markets. From the point of view of retailers, cars will continue to be sold in very large numbers in the UK; if some OEMs benefit at the expense of others the major groups, such as Lookers, represent all major OEMs and should be able to react quickly and effectively to the changes.
Used car market
The size of the UK used car market rose modestly last year to 7.2m (7.0m) vehicles (source: Experian), after being fairly static at 6.7/6.8m vehicles over the previous five years; the first half of 2016 is reported by SMMT to have seen the biggest rise (7.9%) in the used car market for many years . The franchised dealer network has historically concentrated on vehicles up to three years old, although this has been steadily extending to up to five years old in recent years. Looking at the overall parc of some 33m vehicles, we estimate that the franchised dealers are targeting a market involving some 3.5m transactions. Progressive reductions in new car sales during the post-banking crisis period led to reduced availability of suitable used cars and firm used car prices. The subsequent recovery in new car sales has reversed that trend, but the consequent increasing availability of vehicles has been absorbed by the market, with only a limited impact on margins. We sense that the growth in OEM backed PCPs in the used car market has been a key factor. They have been a growing feature of the premium brands for some time, but are now gaining traction in the volume sector; PCPs now represent some 40% of the financing of the market for vehicles up to three years old.
Over the past five years, the major motor dealership groups have consistently gained share in the used car market at the expense of the independents. This reflects more effective investment in inventory profiles, more efficient sourcing of quality used cars, and significant investment in marketing, especially on the internet. Whereas five years ago, a typical buyer of a used car would visit up to six showrooms before making a decision to acquire a particular vehicle, today’s buyer will undertake considerable research across a number of websites and subsequently visit no more than two showrooms before making a choice. The larger groups are able to spread the cost of website development over a wider number of outlets; they are consistently investing in facilities and improving customer interface. The feedback from the leading groups is that used car gross margins continue to be largely sustained; Lookers has raised unit sales of used cars by 55% over the past four years in a market that has grown by around 5%.
Aftermarket
A similar story applies to aftermarket operations. Dealership groups had to contend with the reducing numbers of vehicles up to three years old, while quality improvements reduced levels of warranty work; then came the recovery in registrations. The leading groups gained market share, by offering free vehicle health checks and targeting vehicles with a wider age profile, through a combination of direct marketing (citing the increased complexity of vehicles) and selling service plans on used car sales. Older vehicles require more work per visit, accentuating the benefits of the strategy. We expect these trends to continue over the medium term and, with the size of the new to five-year old vehicle parc steadily increasing again, the outlook remains encouraging.
The current dynamics of the industry continue to favour the large, multi-franchise distributor. We have mentioned the benefits of website development. In addition, their financial strength enables them to invest in modern, more effective facilities and to take on special buying opportunities when OEMs are temporarily over-stocked with either new vehicles or PCP returns. In addition, they can spread the cost of investment in sophisticated customer management systems and handle the regulatory demands related to financial vehicle purchase schemes.
Strong interim results
Trading conditions have been in line with expectations over the six months to June 2016. Volumes increased modestly in most sections of the market, although margin pressures increased with improved vehicle availability. Benefiting from the 2015 Benfield Motors acquisition, Lookers lifted H1 revenues by 34% to £2.34bn and underlying pre-tax profits rose by 16% from £43.1m to £50.1m, comfortably above our £48.5m estimate. The overall gross margin was lower again, down from 12.1% to 11.0%, largely reflecting a combination of the impact of increased product availability and the mix of business involving relatively higher vehicles sales. Overhead costs remained firmly under control, but operating margins, predictably, came down from 2.7% to 2.4%.
Exhibit 3: Interim results
Six months to June (£m) |
2016 |
2015 |
Change (%) |
FY15 |
Revenue |
||||
Motor division ■ New cars ■ Used cars ■ Aftersales |
1,188.2 808.7 228.4 |
861.3 584.3 188.4 |
+38.0 +38.4 +21.2 |
1,835.3 1,212.1 382.9 |
2,225.3 |
1,634.0 |
+36.2 |
3,430.3 |
|
Parts division |
115.2 |
112.8 |
+2.1 |
218.8 |
2,340.5 |
1,746.8 |
+34.0 |
3,649.1 |
|
Operating profit (before central costs) ■ Motor division ■ Parts division |
53.6 7.5 |
43.7 7.3 |
+22.7 +2.7 |
74.9 12.6 |
61.1 |
51.0 |
+19.8 |
87.5 |
|
Pre-tax profit (before central costs) ■ Motor division ■ Parts division |
47.1 7.5 |
39.7 7.3 |
+18.6 |
64.5 12.6 |
54.6 |
47.0 |
+16.0 |
77.1 |
|
Unallocated costs |
(4.5) |
(3.9) |
(5.0) |
|
|
50.1 |
43.1 |
+16.2 |
72.1 |
Source: Lookers RNS. Note: Before intangibles amortisation, debt issue costs, pension costs and exceptional items.
Each of the core business sectors delivered increased profits; there were no exceptional items. The tax charge was unchanged at 19% of adjusted pre-tax profits, enabling the group to lift adjusted EPS by 16% from 8.89p to 10.30p. The interim dividend was raised by 20%.
Group net borrowings were reduced sharply from six months earlier, falling from £161.7m to £74.9m; gearing fell from 54% at December 2015 to 24% at June 2016.
Motor division
The Motor division delivered an excellent result, with revenue for the half year ahead by 36% to £2.23bn and underlying PBT, before unallocated costs, by 19% to £47.1m. Reflecting the pressures mentioned above, pre-tax margins slipped from 2.4% to 2.1%; it is worth pointing out, however, that because there were more higher-specification vehicles sold, the average cash profit per vehicle was actually higher than in the previous year. The key factor behind the growth was consolidation of the previous year’s major Benfield acquisition; during the half year, Lookers disposed of three Honda dealerships in Derby, Nottingham and Stockton.
New Cars – As indicated above, the new car market rose modestly, with the 4% increase in registrations largely fuelled by the fleet market; the retail market rose by 2%. Lookers lifted volumes in both segments, holding its share of the retail market and gaining ground in the fleet market. Revenues increased by 38%, including 12% like-for-like (LFL) growth.
Margin pressures, related to improved product availability, increased in the retail segment, with a 10% LFL revenue increase delivering just 2% to gross profits. On the other hand, returns were sustained in the fleet market, as action instigated over the past year to lift the quality of new business introduced a number of smaller business customers, including growth in light commercial vehicles. There has been an encouraging start to the second half, with positive early indications for the important month of September.
Used Cars – In a market indicated by most major retailers to have risen modestly, by up to 3%, Lookers delivered a 38% increase in revenue, including 7% LFL growth. As foreshadowed by management, increased vehicle availability led to reduced gross margins (6.9% vs 7.7%), although the increasing number of higher specification cars led to a modest rise in the cash profit per vehicle.
Management has invested consistently in this segment of the business, raising the sourcing skills and adjusting the inventory profile in an attempt to match the needs of the community local to a particular franchise. Lookers has also invested consistently, upgrading the website to generate significant year-on-year increases in the number of sales leads. The growth momentum in used car sales has slowed, but management reported delivering 55% growth over the four years to December 2015. On the basis that the part of the used car market targeted by Lookers is almost three times the size of the retail new car market, there still appears to be a significant medium-term opportunity for further growth in this sector.
Aftermarket – Lookers delivered the expected sound performance in its aftermarket operations, with revenue up by 21% (7% LFL); with margins widening slightly, gross profits increased at a slightly higher 27% (8% LFL) rate. This performance stems from the growing parc of vehicles under five years old, plus the consistent investment in recent years (CRM, IT, vehicle health checks, service plans), which is leading to progressive increases in market share.
The mix was again more favourable with higher service/repair revenues contributing to the rise in gross margins. The immediate outlook remains favourable, with the rate of organic progress likely to be sustained well into the second half and beyond.
Parts division
Lookers has built on last year’s improvement, with H1 revenue and PBT up by 2% and 3% respectively, to £115.2m and £7.5m. With the parc of vehicles principally targeted by the division (four to nine years old) falling slightly and many motorists at the lower end of the market still delaying inessential repairs, this represents another sound performance.
On the assumption that the recently announced disposal of this division proceeds in line with management indications, the businesses will be consolidated for approximately 10 months in the current year. Trading remains sound, with a positive performance expected for this period.
Trading outlook
Trading conditions remain challenging – while the new car market achieved year-on-year volume growth over H116, there was a distinctive slowdown during Q2, while the shift from retail towards fleet sales continued. Margin pressures continue in both new and used cars, reflecting increased vehicle availability. Lookers’ strategy is still working, with volume gains being achieved in all key business areas, with limited surrender of margin. Industry reports suggest that, while many dealerships have achieved higher revenues, several are delivering reduced profits because of these pressures. There seems little doubt that the larger groups are better placed to respond more effectively to the challenge.
Lookers’ management has reported a healthy order book for the key September trading month. With interim figures showing underlying pre-tax profits slightly above our target, we believe that the group is on course to deliver ahead of our previous expectations. However, corporate transactions announced earlier this month mean that the contribution from the Parts division will cease at the end of October, while the subsequent Mercedes Benz and BMW/MINI dealership purchases cannot be expected to make up the shortfall. On balance, we have decided to leave our full year 2016 profit estimates unchanged.
In the aftermath of Brexit, there is increasing uncertainty about the outlook for 2017. Management has already made clear the fact that the proceeds from the Parts division disposal will not earn sufficient income to replace the loss of its earnings. On the other hand, the subsequent acquisitions ought to be able to replace much of the lost profit in their first full year as part of the group; other deals are in the pipeline, although management has indicated that there is nothing imminent. Moreover, if vehicle registrations can match the current year’s level in 2017, as implied by most industry forecasts, the benefits of recent investment in improving the quality of facilities, the website and customer experience point to underlying organic growth of at least 5%. We have decided to reduce our 2017 adjusted pre-tax estimate from £83.0m to £80.0m, although this could prove conservative, especially if further deals do emerge.
Strategically, Lookers will continue its acquisition policy. Opportunities are increasing, with numerous independent operators possibly looking more keenly towards an exit, because of fears about growing trading uncertainties in the market. As we have indicated previously, industry dynamics continue to favour the larger groups – the consolidation process has been with us for several years, but has much further to go. Lookers will continue at the forefront of this move, with the management and the financial strength to move quickly and effectively when appropriate.
Planned disposal of Parts division
On 10 August Lookers announced a conditional agreement to sell its Parts division to Alliance Automotive for £120m, on a cash-free/debt-free basis. Our current estimates show net cash balances of around £5m within the business, which are also receivable by Lookers on completion of the transaction. The deal is subject to shareholder approval, EU merger control clearance and the delivery of certain property titles.
On the basis of last year’s operating profit of £12.6m, the business is valued at 9.5x EBIT, while the exit P/E ratio is 11.1x, assuming a standard tax charge. The Parts division contributed 14% of PBT during H1 of the current year, while the consideration represented 28% of the group market capitalisation on the day before the deal was announced. Management was not planning a disposal of the business, but responded to what they perceived to be an attractive bid.
Management believes that it can reinvest the funds in the Motor division, earning a minimum 15% return within two to three years of the completion of any deal. A 15% return on the £120m proposed consideration for the Parts division would return some £18m, £5m above our current year profit estimate for the business.
Reinvestment of the proceeds
Drayton Group – The first deal, as anticipated in the disposal press release, was announced shortly after the disposal. Warwick Holdings, trading as Drayton Group, was acquired for £55.4m; the deal is subject to completion of the Parts division disposal. It operates seven Mercedes Benz dealerships in the West Midlands, earning a PBT of £5.2m in 2015 from revenue of £276m. It strengthens the group’s relationship with the OEM, doubling its representation to 14 dealerships, with a combined revenue of around £600m. The press release indicated a relatively modest contribution in the current year, followed by a significant contribution to the group bottom line in future. Our 2017 revised estimate consolidates PBT of £6.0m; the 15% return, implying profits of £8.3m, should be delivered within two further years.
Knights North West – This is a long-awaited deal, introducing BMW/MINI to the group. Knights introduces a franchise territory in the West Midlands, comprising three combined dealerships based in Stafford, Stoke and Crewe in a deal valuing the business at £27.2m. In the year to December 2015, the business earned PBT of £1.9m from a turnover of £213m. The BMW/MINI franchise has been a major gap in the Lookers portfolio for many years. Again there will be a relatively modest profit contribution in the current year, but we are looking for a minimum £3.5m in 2017, rising to its planned 15% return of just over £4.0m within two years.
Other deals – We understand from discussions with management that no other deals are planned in the immediate future. However, as indicated in our sector comment, we believe that the number of opportunities could well increase in the coming months. Lookers still has some £35/40m of the planned Parts division proceeds available, let alone its substantial unused banking facilities. We would not be surprised to see further acquisition announcements later in the current year or in 2017.
Impact on group profits
As indicated in the Trading Outlook section of this report, the impact on the current year outcome should not be material; Parts will presumably be consolidated for 10 months, with the barely profitable month of December one of the two months left out. There will be some contribution from the acquisitions, while the current year underlying trading performance is ahead of our earlier estimates. We have decided to leave our adjusted PBT estimate unchanged.
The group will have to forego the full estimated £13.0m Parts contribution in 2017, while our combined £9.5m estimates for the acquisitions will leave a £3.5m gap to be filled. Interest savings on the uninvested part of the proceeds will narrow this gap by up to £0.5m, while trading seems to running ahead of our earlier projections and could make up some of the shortfall. At this juncture we have decided, as indicated above, to reduce our adjusted PBT target for 2017 by £3m from £83m to £80m.
Sensitivities
Performing in a mature market – Management has acted to preserve and win share in a mature and competitive market. While the very severe market conditions encountered in 2008 and 2009 affected all motor dealers, Lookers' management has since invested in increasing the sizes of its franchise territories, enabling the group to employ local management more effectively. At the same time Lookers has extended its used car and aftermarket operations across the network, adding considerable gross profit, without a commensurate rise in establishment costs.
Macroeconomic factors – Like other dealership groups, Lookers cannot be immune from either a major downturn in demand or an unexpected downturn in used car values (as happened in 2008). However, because vehicles deteriorate with age, there is a built-in replacement cycle (usually up to three years), to which most motorists seem to subscribe. Registration plates showing the age of a particular vehicle seem to encourage this trend to continue, while the company car is still seen as one of the most important business perks. The UK automotive market is mature, having peaked previously at around current levels in 2003. High levels of immigration in recent years suggest that the market will stabilise at around the current 2.5m vehicles.
Performance of individual marques – Specific company performance is likely to be affected by the variable performances of individual marques, related to the timing of new model introductions, temporary reliability problems and the effectiveness of sales incentive schemes for dealers. However, there is a greater degree of immunity in larger dealership groups such as Lookers because of their spread of business, so that any adverse impact with one OEM will be balanced by the stronger performances elsewhere. Another factor will be the trend in consumer preference in respect of prestige models. The two years to 2014 saw a shift towards upmarket models, partially prompted by strong finance offers. There was a brief reversal of this trend last year, but the shift toward higher specification vehicles looks set to continue. Lookers’ portfolio of franchises is well balanced between volume and prestige vehicles.
Pension deficit – Lookers operates two defined benefit pension schemes, both of which are closed to new entrants. The combined actuarial value of liabilities and the fair value assessment of the scheme assets decreased modestly over the year to December 2015. At that date, there was a net deficit, after deferred tax, of £44.2m; the deficit rose modestly in the period to June 2016.
Valuation
Share prices across the UK motor retail subsector have fallen away in recent months. On average, the shares currently stand at a 28% discount to their 12-month high, while they have slipped back by an average10% since publication of the result of the Brexit referendum. At a 27% discount to its high, the Lookers’ share price has performed much in line, although the recovery since the announcement of the Parts business disposal leaves the shares just 2% below their pre-Brexit level. By contrast, the FTSE All-Share General Retailers Index currently stands at a 16% discount to its 12-month high and has only fallen by 3% since the declaration of the referendum result.
Exhibit 4: Peer group comparison
Price |
Market cap |
Revenue |
P/E (x) |
P/E (x) |
|
Cambria Auto |
67.0 |
67 |
523 |
7.7 |
7.0 |
Inchcape |
708.0 |
3,024 |
6,836 |
12.8 |
11.9 |
Lookers |
135.5 |
539 |
3,649 |
8.3 |
8.3 |
Marshall Motor |
166.0 |
128 |
1,233 |
7.7 |
5.7 |
Pendragon |
33.5 |
485 |
4,454 |
8.7 |
8.3 |
Vertu Motors |
49.0 |
195 |
2,423 |
8.0 |
7.3 |
Simple average (excluding Inchcape) |
8.1 |
7.3 |
|||
FTSE All-Share General Retailers Index |
14.2 |
13.5 |
Source: Thomson DataStream; Edison Investment Research estimates. Note: Priced at 30 August 2016, based on calendar year normalised earnings, before amortisation and non-recurring items.
The market seems to believe that motor retailers will be adversely affected by the impact of Brexit, relative to other retailers. We find this hard to believe: if there is a recession, the typical well-managed motor dealership, with c 35% of gross profit generated from new vehicle sales, would appear far less vulnerable than many other types of retailer. Moreover, the c 45% of profit generated in the aftermarket looks relatively secure, because virtually every car will continue to have an annual service, with numerous parts subject to regular replacement, based on the number of miles covered. In addition, as mentioned above, industry dynamics favour the large groups, several of which have strong balance sheets enabling them to make earnings enhancing acquisitions. With motor retailers valued at little more than half the P/E rating for the retail sector (8.1x vs 14.2x based on calendar 2016 estimates) the sector offers real value.
Lookers has delivered a 9.2% CAGR in diluted adjusted EPS since the new car market high point back in 2003 and has produced record pre-tax profits in each of the past seven years. In spite of market concerns about the likely impact of Brexit, management has demonstrated an ability to respond quickly and effectively to changes in the trading climate. Lookers’ record justifies a somewhat higher rating, especially with the current disposal proceeds of its Parts division likely to be reinvested in assets earning better return on capital..
Financials
Cash generative trading
Lookers is a net generator of cash in most years, largely because of strong central controls, principally related to working capital. Over the half year to June 2016, the group reversed a higher than expected working capital increase evident at the previous year-end and was helped also by a change in vehicle financing strategies of certain OEMs. Benefiting from a £40.1m reduction in working capital, funds generated from operations, after the net investment in the vehicle rental fleet, more than doubled, from £40.0m, to £105.3m. Tax, dividend and interest payments absorbed a total of £23.1m, while capital investment of £22.8m was exceeded by £27.5m disposal proceeds. After other minor adjustments, there was a net inflow of £86.8m, reducing group net borrowings from £161.7m to £74.9m.
Our cash projections for the full year assume continued heavy capital expenditure, while we are hopeful that the improvements in working capital ratios can be sustained. On the other hand, there will presumably be receipts of £120m from the sale of the Parts division, less the £83m payable for the acquisitions. Our revised estimates suggest year-end net borrowings of just over £40m.
Ready for acquisitions
Gearing at June 2016 was 24%, compared with 54% six months earlier. The net debt/EBITDA ratio has come down from 1.3x to 0.7x, towards the lower end of the target range of 0.5-1.5x.
Facilities, negotiated at the time of the Benfield acquisition in late 2015, comprise a term loan of £90m, plus a revolving credit facility of £150m. In addition, there is an additional facility to raise a further £30m to finance acquisitions. Lookers has significant headroom to cover both ongoing trading fluctuations and a more aggressive acquisition strategy, especially in the context of the £194m book valuation of freehold and long leasehold properties. This enables the group to move quickly, if necessary, to respond to acquisition opportunities that meet management criteria.
Exhibit 5: Financial summary
Year end 31 December |
£m |
2010 |
2011 |
2012 |
2013 |
2014 |
2015 |
2016e |
2017e |
Accounting basis |
IFRS |
IFRS |
IFRS |
IFRS |
IFRS |
IFRS |
IFRS |
IFRS |
|
PROFIT & LOSS |
|||||||||
Revenue |
|
1,884 |
1,899 |
2,057 |
2,465 |
3,043 |
3,649 |
4,250 |
4,650 |
Cost of Sales |
(1,623.2) |
(1,645.9) |
(1,753.3) |
(2,128.7) |
(2,646.8) |
(3,196.9) |
(3,750.0) |
(4,100.0) |
|
Gross Profit |
260.6 |
252.6 |
303.3 |
335.8 |
396.1 |
452.2 |
500.0 |
550.0 |
|
EBITDA |
|
54.7 |
54.5 |
60.0 |
67.7 |
87.0 |
99.6 |
115.0 |
115.5 |
Operating Profit (pre amortisation and except.) |
|
46.9 |
45.2 |
49.2 |
58.4 |
76.6 |
85.9 |
98.0 |
96.5 |
Intangible Amortisation |
(1.3) |
(1.3) |
(1.1) |
(1.1) |
(1.2) |
(1.6) |
(2.0) |
(2.1) |
|
Exceptionals |
0.0 |
0.0 |
0.0 |
0.0 |
0.0 |
(1.9) |
30.0 |
0.0 |
|
Other |
(1.2) |
(1.1) |
(2.6) |
(3.1) |
(3.5) |
(4.3) |
(3.0) |
(3.0) |
|
Operating Profit |
44.4 |
42.8 |
45.5 |
54.2 |
71.9 |
78.1 |
123.0 |
91.4 |
|
Net Interest |
(13.3) |
(11.4) |
(11.2) |
(10.3) |
(11.6) |
(13.8) |
(18.0) |
(16.5) |
|
Profit Before Tax (norm) |
|
33.6 |
33.8 |
38.0 |
48.1 |
65.0 |
72.1 |
80.0 |
80.0 |
Profit Before Tax (FRS 3) |
|
31.1 |
31.4 |
34.3 |
43.9 |
60.3 |
64.3 |
105.0 |
74.9 |
Tax |
(8.2) |
(6.2) |
(8.0) |
(7.7) |
(12.4) |
(12.0) |
(14.0) |
(14.0) |
|
Profit After Tax (norm) |
|
25.4 |
27.6 |
30.0 |
40.4 |
52.6 |
60.1 |
66.0 |
66.0 |
Profit After Tax (FRS 3) |
|
22.9 |
25.2 |
26.3 |
36.2 |
47.9 |
52.3 |
91.0 |
60.9 |
Average Number of Shares Outstanding (m) |
383.5 |
383.8 |
387.1 |
388.1 |
389.2 |
394.4 |
396.2 |
396.2 |
|
EPS - normalised (p) |
|
6.62 |
7.19 |
7.72 |
10.36 |
13.52 |
15.24 |
16.66 |
16.66 |
EPS - normalised fully diluted (p) |
|
6.49 |
7.02 |
7.56 |
10.16 |
13.21 |
14.88 |
16.27 |
16.27 |
EPS - FRS 3 (p) |
|
5.97 |
6.57 |
6.77 |
9.28 |
12.31 |
13.26 |
22.97 |
15.37 |
Dividend per share (p) |
1.80 |
2.18 |
2.35 |
2.58 |
2.84 |
3.12 |
3.50 |
3.70 |
|
Gross Margin (%) |
13.8% |
13.3% |
14.7% |
13.6% |
13.0% |
12.4% |
11.8% |
11.8% |
|
EBITDA Margin (%) |
2.9% |
2.9% |
2.9% |
2.7% |
2.9% |
2.7% |
2.7% |
2.5% |
|
Operating Margin (before GW and except.) (%) |
2.5% |
2.4% |
2.4% |
2.4% |
2.5% |
2.4% |
2.3% |
2.1% |
|
BALANCE SHEET |
|||||||||
Fixed Assets |
|
255.1 |
253.3 |
273.3 |
292.1 |
329.8 |
441.2 |
474.8 |
475.8 |
Intangible Assets |
60.5 |
62.2 |
76.2 |
87.5 |
114.2 |
158.3 |
212.9 |
210.9 |
|
Tangible Assets |
194.6 |
191.1 |
197.1 |
204.6 |
215.6 |
282.9 |
261.9 |
264.9 |
|
Investment in associates |
0.0 |
0.0 |
0.0 |
0.0 |
0.0 |
0.0 |
0.0 |
0.0 |
|
Other |
0.0 |
0.0 |
0.0 |
0.0 |
0.0 |
0.0 |
0.0 |
0.0 |
|
Current Assets |
|
428.6 |
480.1 |
559.2 |
659.3 |
791.2 |
1,143.9 |
1,408.3 |
1,514.8 |
Stocks |
292.3 |
349.6 |
423.5 |
499.6 |
605.9 |
883.0 |
970.0 |
1,028.5 |
|
Debtors |
104.2 |
109.1 |
123.8 |
154.0 |
179.4 |
252.6 |
360.0 |
383.0 |
|
Cash |
24.3 |
17.9 |
8.7 |
5.2 |
5.9 |
8.3 |
78.3 |
103.3 |
|
Other |
7.8 |
3.5 |
3.2 |
0.5 |
0.0 |
0.0 |
0.0 |
0.0 |
|
Current Liabilities |
|
(387.0) |
(433.5) |
(513.0) |
(610.3) |
(725.2) |
(1,085.4) |
(1,295.8) |
(1,368.3) |
Creditors/Other |
(372.9) |
(424.9) |
(497.3) |
(595.8) |
(705.0) |
(1,002.0) |
(1,252.3) |
(1,314.2) |
|
Short term borrowings |
(14.1) |
(8.6) |
(15.7) |
(14.5) |
(20.2) |
(83.4) |
(43.5) |
(54.1) |
|
Long Term Liabilities |
|
(115.1) |
(102.8) |
(115.7) |
(113.1) |
(138.9) |
(201.9) |
(179.6) |
(171.6) |
Long term borrowings |
(66.8) |
(48.8) |
(41.2) |
(33.8) |
(37.6) |
(86.6) |
(76.6) |
(68.6) |
|
Other long term liabilities |
(48.3) |
(54.0) |
(74.5) |
(79.3) |
(101.3) |
(115.3) |
(103.0) |
(103.0) |
|
Net Assets |
|
181.6 |
197.1 |
203.8 |
228.0 |
256.9 |
297.8 |
407.7 |
450.7 |
CASH FLOW |
|||||||||
Operating Cash Flow |
|
49.3 |
40.8 |
48.4 |
55.9 |
55.1 |
58.0 |
118.5 |
92.0 |
Net Interest |
(13.2) |
(11.4) |
(12.4) |
(10.3) |
(11.6) |
(13.8) |
(18.0) |
(16.5) |
|
Tax |
(5.9) |
(6.7) |
(7.8) |
(8.1) |
(8.9) |
(11.3) |
(13.5) |
(14.0) |
|
Net Capex |
(5.3) |
1.5 |
(11.6) |
(3.8) |
(10.0) |
(28.0) |
(10.0) |
(25.0) |
|
Acquisitions/disposals |
0.0 |
0.2 |
(17.4) |
(19.3) |
(24.5) |
(104.4) |
55.8 |
0.0 |
|
Financing |
0.0 |
1.5 |
0.4 |
0.3 |
1.6 |
0.9 |
0.0 |
0.0 |
|
Other |
0.0 |
(1.1) |
0.1 |
(0.1) |
(0.1) |
0.4 |
0.0 |
0.0 |
|
Dividends |
(2.3) |
(7.7) |
(8.4) |
(9.5) |
(10.4) |
(11.6) |
(12.9) |
(14.1) |
|
Net Cash Flow |
|
22.6 |
17.1 |
(8.7) |
5.1 |
(8.8) |
(109.8) |
119.9 |
22.4 |
Opening net debt/(cash) |
|
79.2 |
56.6 |
39.5 |
48.2 |
43.1 |
51.9 |
161.7 |
41.8 |
HP finance leases initiated |
0.0 |
0.0 |
0.0 |
0.0 |
0.0 |
0.0 |
0.0 |
0.0 |
|
Other |
0.0 |
(0.0) |
(0.0) |
0.0 |
0.0 |
0.0 |
0.0 |
0.0 |
|
Closing net debt/(cash) |
|
56.6 |
39.5 |
48.2 |
43.1 |
51.9 |
161.7 |
41.8 |
19.4 |
Source: Lookers accounts, Edison Investment Research
|
|||||||||||||||||||||||||||||||||||||||||||||||
|
|