Liquefied Natural Gas
Written by
Liquefied Natural Gas Ltd |
Ready to pull the trigger on Magnolia |
Project overview |
Oil & gas |
28 October 2016 |
ADR research
ADR share price performance
Business description
Next events
Analysts
Liquefied Natural Gas Ltd is a research client of Edison Investment Research Limited |
|||||||||||||||||||||||||||||||||||||
Liquefied Natural Gas Ltd (LNGL) is a developer of LNG liquefaction facilities and holds patent-protected technology that promises lower-cost, highly efficient LNG across many global markets. The company is finalizing offtake and awaiting a final DoE non-FTA export order to proceed before it can reach financial close at the Magnolia project. Binding EPC contracts mean that costs of development should be contained, while production (if sanctioned soon) could start up in 2022 as the global LNG markets tighten from the current glut. We believe uncertainty over the projects is a major reason behind the current share price, which has the potential to re-rate strongly if and when the project(s) are sanctioned. Our current risked DCF approach values LNGL at A1.3$/share (US$3.9/ADR), but this could grow very materially.
Year |
Revenue (US$m) |
PTP |
Operating cash |
Net (debt)/ |
Capex |
12/15 |
0.0 |
(65.3) |
(53.0) |
35.6 |
(8.8) |
12/16 |
0.0 |
(87.2) |
(88.7) |
50.9 |
(0.1) |
12/17e |
0.0 |
(32.9) |
(25.1) |
25.8 |
0.0 |
12/18e |
77.8 |
44.8 |
52.5 |
66.8 |
(11.5) |
Note: Converted at A$1.32/US$1 Dividend yield excludes withholding tax. Investors should consult their tax advisor regarding the application of any domestic and foreign tax laws.
LNG markets in surplus, rebalancing by 2021-23
Investment decisions for LNG developments need to look beyond the current surplus to the picture in 2021-23 when markets should tighten. New LNG supplies will need to be available and LNGL’s two projects and technology can, if sanctioned in next the 12 months, provide additional low-cost, low-risk supply. Only a limited number of other projects can be ready in this timeframe, according to the company.
Magnolia financial close/sanction expected in 2017
MLNG is a shovel-ready 8mtpa (or greater) project in Louisiana accessing the massive US natural gas network. It is awaiting the FERC Notice to Proceed (NTP), the finalization of offtake agreements for the final 6mtpa (it already has agreement for up to 2mtpa) and confirmation of project financing. These are major hurdles, but ones that we believe are achievable. The Bear Head project can provide an additional 12mtpa, which should be particularly attractive to European markets.
Valuation: Project sanction should drive re-rating
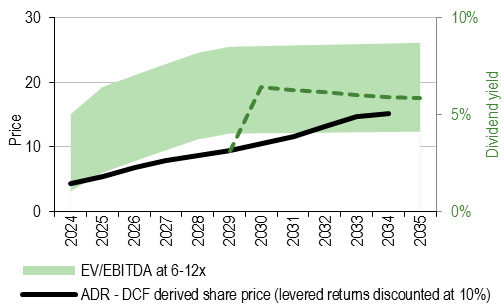
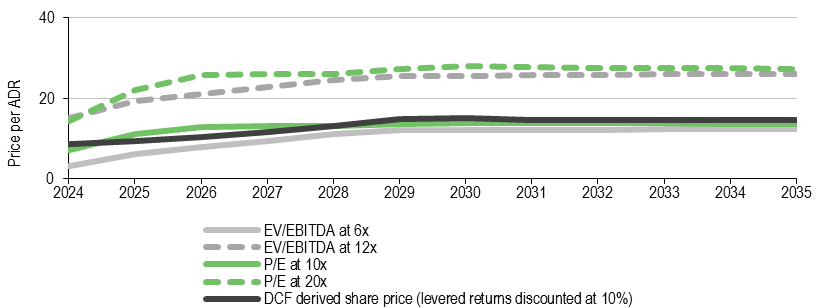
If/when MLNG starts up, it should produce material cash flows that could push the shares to levels approaching or exceeding A$5/share (US$15/ADR), based on DCF and peer multiples analysis. Our current valuation revolves around an estimation of the risks to project sanction, which the current share price implies are substantial. We risk our DCF-derived valuation to arrive at a current valuation estimate of A$1.3/share (US$3.9/ADR), but if milestones towards project sanction are reached, it could drive shares much higher. We note that a FERC NTP could be issued before year-end, enabling the company to more aggressively pursue the other milestones (financing, tolling agreements).
Investment summary
Company description: LNG project development
LNGL is developing LNG export terminals in the US, Canada and Australia. Magnolia LNG is an 8mtpa or greater project in Lake Charles, Bear Head LNG is an 8-12mtpa development in Nova Scotia, while Fisherman’s Landing is 3.5mtpa project in Gladstone, Australia. It holds 100% ownership of Bear Paw Pipeline, a company set up to construct a pipeline connecting Bear Head with North American gas infrastructure. It holds patents over its proprietary OSMR (optimized single mixed refrigerant) mid-scale liquefaction technology, which promises lower capital and operating costs in modular LNG projects. The company is currently working hard to get the Magnolia LNG project to financial close/sanction, which we currently model to be in CY17, with start-up in CY22.
Financials: Magnolia should be funded
LNGL has an agreement with KBR (leading a joint venture with SK E&C) for a lump sum turnkey approach to construction, which is formally contacted at US$4.354bn for the 8mtpa. This should be primarily debt funded, with the remaining 30% or so coming from its equity partner, Stonepeak Infrastructure Partners. The equity funding and structure of the Bear Head project is less certain, although we expect similar debt structuring capacity. The ability of LNGL (and partners) to attract debt funding at attractive rates is also key to the value the projects will generate for shareholders.
Valuation: Current A1.3$/share (US$3.9/ADR) should grow
We primarily value the company on a risked DCF basis, although we refer to other pricing metrics. Once running, the projects should produce reliable free cash flows that should fuel material dividend distribution. This cash flow profile should also allow the company to debt finance a large portion of the capital costs of the projects – it has previously guided to debt financing of around 70%. Valuation is contingent on various factors, not least LNGL’s ability to reach financial close for its projects and, around four years later, start and operate them successfully.
We currently value LNGL at A$1.3/share (US$3.9/ADR), using a 60% risk to Magnolia, 20% to Bear Head and 0% to Fisherman’s Landing. Assuming just Magnolia starts up, this may increase to over A$3/share (US$9/ADR) once the projects start (on our DCF). Using P/E, EV/EBITDA and dividend yield metrics imply that Magnolia LNG could fuel a company valuation of up to A$4-5/share (US$12-15/ADR) once cash flows start up. Adding Bear Head cash flows could move the valuation to A$10-15/share (US$30-45/ADR).
Sensitivities: Predictable cash flows once started
The overriding consideration for investment in LNGL is its ability to get the projects to sanction – the share price implies a cautious stance by the markets on this in the near term. However, we believe economic realities demand further LNG investment for future supply and that LNGL’s low-cost technology and modular approach gives it a good chance of progressing.
The nature of the tolling fees means that project cash flows should be reliable and hence similar to a utility. As such, much of the project uncertainty revolves around the speed at which the projects can be sanctioned, the structuring of the financing and the fees to be received. Final capex costs and the prices negotiated for the tolling fees (or SPAs) will also have a material impact. The larger the debt facility (and lower the costs), the higher the equity returns for the partners. Our modelling indicates an unlevered project IRR in 2018 of 16% and, given Stonepeak’s fixed return condition, relatively small movements in many of the inputs may have a material effect on LNGL equity value.
Company description: Innovative LNG liquefaction
Liquefied Natural Gas Ltd (LNGL) is devoted to the development of more efficient natural gas liquefaction plants, which are expected to have significantly lower capital and operating costs than existing technologies. The company is currently developing two LNG liquefaction plants in North America, the 8mtpa capacity (or greater) Magnolia LNG plant (Louisiana) and 8-12mtpa Bear Head project (Nova Scotia). The company has shares listed on the ASX and ADRs in New York.
Technology overview
OSMR: New technology, but with prospect of lower capex/opex
LNGL has patent protection for its OSMR liquefaction technology, which should require notably lower capital investments, as well as lower operating costs, than comparative technologies. The OSMR technology is a novel combination of a number of existing solutions. Investors may be concerned that this may be higher risk than alternatives, but we point to a number of factors that should help frame the uncertainty.
The technology is a new combination of existing proven technologies and, as such, each has been shown to work independently. It is the integration of three proven technologies/processes: single mixed refrigerant process (the oldest LNG liquefaction technology), combined heat and power (which is used extensively in the power industry) and ammonia refrigeration (which is one of the most used refrigeration technologies in industrial applications). Furthermore, a number of studies have been executed by third parties, including by CH-IV (2008), Foster Wheeler (developer of multiple LNG systems globally), Arrow-WorleyParsons (2009 and 2010), and HQC and Consultants (2010). A report was also issued by SK E&C in June 2009, and updated in 2013. This concluded that OSMR should be highly reliable and provide good utilization.
It is perhaps more usefully illustrative to see that the service companies are willing to put their own cash at risk (via use of the technology). Both SK E&C and KBR will be responsible for the execution of the turnkey projects at Magnolia and Bear Head and will be responsible for not just delivery on time/budget (and open to liquidated damages), but also for guaranteeing a minimum production level (performance liquidated damages).
Patent protection
Patent protection could lead to valuable future licensing fees for the company. For Magnolia LNG, LNGL is scheduled to receive a fee of c 3% of capex costs (capped at $66m) at financial close and a technology licence fee (through a royalty payment scheme) for each of Phase 1 and 2. This is a material value to LNGL, but modest compared to the value of developing the project as a full equity partner. Patents have now been granted in 16 countries including the US, Canada and Australia.
Lower capex and opex
Through the OSMR technology, LNGL plans to reduce capex and opex costs compared to existing options. According to the company, capex costs for conventional technologies (which we interpret as single, double and propane-precooled mixed refrigerant systems) are around US$1,000/tpa, while the OSMR for trains 1 and 2 is significantly lower (US$549-628/tpa). Plant efficiency should compare well with other technologies, with lower fuel usage, leading to a material improvement over a single mix refrigerant process – the company indicates a US$28m pa saving on natural gas consumption on an 8mtpa plant, for example. The smaller train sizes (vs those typically used by Shell/BG for example) also allow a modular development and enable a small company such as LNGL to be a credible developer. More information can be found on LNGL website.
Abundant sources of gas due to US shale boom
Magnolia and Bear Head are placed to take advantage of the shale gas boom in the US and Canada. Massive existing infrastructure, increasing technological progress and available capital has seen a huge surge of gas production, substantially reducing and stabilizing prices.
In this environment, the US has the potential to provide gas to LNG export schemes without risking major price increases. We anticipate that Magnolia could be fed by the Haynesville and Eagle Ford shale gas plays via Kinder Morgan’s Louisiana pipeline (with which LNGL has executed a binding capacity precedent agreement), with areas further afield also possible. Bear Head could be supplied from the US and/or Canada. Negotiations continue on three paths for the Bear Head gas: (i) the US; (ii) Nova Scotia; and (iii) western and central Canada. We note that the low oil/gas prices in the US have curtailed drilling in the massive Marcellus and Utica shales, which may limit gas supply from these areas. Equally, the low oil price has meant oil companies have cut back on exploration in offshore Nova Scotia, reducing the possibility that gas could be sourced from the region in the near/mid-term.
LNG supply, demand and pricing
We do not forecast LNG supply/demand, but note that many independent sources point to a rebalancing of supply/demand by 2021-23, after which time new supply will be needed. This leaves around five years for additional capacity to be built to avoid a supply shortage. It is this time period that LNGL believes it can serve for LNG supply. If this is true, LNG pricing has to rebalance to motivate development LNG liquefaction facilities. Given LNGL’s low-cost approach, it should be well placed to have economic returns from development.
Looking at it another way, the charts below indicate possible LNG differentials that could be achieved if LNG prices were to track oil prices in the mid-term (with gas prices dictated by the current forward curve). Clearly, the forward oil curve is relatively flat and would lead to much lower differentials than our assumed $70/bbl real long-term price.
|
Exhibit 1: LNG differentials assuming tracking of LNG prices to forward curve |
Exhibit 2: LNG differentials assuming tracking of LNG prices to forward curve at an assumed $70/bbl |
|
|
|
Source: Edison Investment Research, Bloomberg |
|
Exhibit 1: LNG differentials assuming tracking of LNG prices to forward curve |
|
|
Source: Edison Investment Research, Bloomberg |
|
Exhibit 2: LNG differentials assuming tracking of LNG prices to forward curve at an assumed $70/bbl |
|
|
Source: Edison Investment Research, Bloomberg |
Given the cost to an LNG trader of LNG from Magnolia would be the cost of gas (US$3.2/mcf in 2022 according to the forward curve) plus the tolling fee (around US$2.5/mcf) and transport costs (US$1-2/mcf), we expect that prices will not have to increase markedly from current traded contracts for profits to be made.
Advantageous project costs
LNGL’s technology is believed to be very competitive with other techniques. Given this, and the continued low prices that we believe will continue in the US due to shale gas, we expect LNG’s projects to be very attractive to offtakers.
|
Exhibit 3: Break-even cost for LNG liquefaction is very competitive vs peers (excludes shipping costs) |
Exhibit 4: Project costs vs historical projects |
|
|
|
Source: Adapted from Ophir presentation (2015). Note: LNGL costs assumes Henry Hub price of US$3.2/mmcf, as suggested by forward curve. |
Source: EconStor. Note: The Magnolia LNG mark is our modelling assumption. Costs may inflate over time. |
|
Exhibit 3: Break-even cost for LNG liquefaction is very competitive vs peers (excludes shipping costs) |
|
|
Source: Adapted from Ophir presentation (2015). Note: LNGL costs assumes Henry Hub price of US$3.2/mmcf, as suggested by forward curve. |
|
Exhibit 4: Project costs vs historical projects |
|
|
Source: EconStor. Note: The Magnolia LNG mark is our modelling assumption. Costs may inflate over time. |
Project summaries
LNGL continues to progress its marketing efforts, as can be seen in Exhibit 5.
Exhibit 5: Key information on projects
|
Magnolia |
Bear Head |
Fisherman's Landing |
Current equity interest |
c 35%, Stonepeak Infrastructure Partners c 65% (dependent on IRR expected at FID) |
100% (we model 60%) |
100% |
Location |
Lake Charles, US |
Nova Scotia |
East Coast, Australia |
Size of land |
115 acres |
327 acres |
60 acres, site lease extended until March 2017 |
Capacity |
8mtpa (four trains @ 2mtpa) , possible extension |
8-12mtpa (two 4mtpa phases planned, third 4mtpa possible) |
1.5mtpa |
Capex |
Company guidance – US$4.354bn gross for 8mtpa (excludes other costs of 15.5% and debt interest repayments at 7.5%) |
As per Magnolia |
As per Magnolia |
FID/sanction |
Mid- to late 2017 |
2019 |
On hold |
Equity partner (funding provided) |
Stonepeak to carry equity funding of trains 1-2. Discussions ongoing re extending this for full 8mtpa project |
Unknown partner. Assumed to be a partner seeking similar returns as Stonepeak |
None |
First gas |
We assume 2022 |
We assume 2024 |
On hold |
Gas source |
US gas network |
US gas network/Canadian gas network/Nova Scotia |
MOI with Tri-Star Petroleum, discussions with PetroChina over securing gas supply |
EPC partners |
KBR, SK E&C |
KBR, SK E&C |
On hold |
Tolling partners |
Magnolia LNG and Meridian LNG signed a binding agreement for firm capacity rights for up to 2mtpa in July 2015 – valid until December 2016. |
||
According to the 2015 Annual report, “Marketing of MLNG capacity continues with a number of investment-grade, as well as some non-investment grade counterparties. Substantially all of the offtake negotiations are for initial 20-year terms under LNG tolling agreements (LTA) or sales and purchase agreements (SPA)”. |
Source: LNGL
Magnolia’s 8mtpa project assumed to start in 2022
The Magnolia project is a four-train, 8mtpa (or greater) LNG plant planned to be built on a 115 acre plot in the Port of Lake Charles, Louisiana (adjacent to the existing LNG channel). The plant will use LNGL’s proprietary OSMR process liquefaction technology. A binding 20-year pipeline capacity precedent agreement was signed in 2014 with Kinder Morgan Louisiana Pipeline (KMLP). The site itself has a lease for 30 years (potentially extendable to 70 years) and the project is construction ready.
LNGL is partnering with Stonepeak Infrastructure Partners on Magnolia. Stonepeak will be providing the equity required (30%) to develop the first train (4mtpa) of the project, although there are discussions to fund the larger 8mtpa project. The agreement is structured so that Stonepeak will be assigned an equity ownership such that it achieves a specified IRR, with LNGL retaining the rest (we model 35% of the project). The company has an agreement with BNP Paribas over the debt provision.
The project development timing has slipped. We now expect financial close – originally scheduled for mid-2015 – in mid-2017, although this will be dependent on tolling agreements being executed.
A binding lump sum turnkey (LSTK) with KBR (& SK E&C) has been executed, fixing capex at $4.354bn for the first four fully operational trains (excluding other costs of 13.5-15.5%).
The next steps are:
■
FERC Notice to Proceed and DoE non-FTA export approval to be issued.
■
Binding offtake agreements – LNGL has signed binding agreements for 2mtpa (only currently valid until December 2016). Negotiations are ongoing for the remaining 6mtpa.
■
Binding term sheet for debt – BNP advisor is the debt arranger.
Bear Head project (Nova Scotia) 8-12mtpa start 2024
In August 2014, LNGL finalized its acquisition (for US$11m) of the Bear Head project in Nova Scotia from Anadarko and consequently owns 100% of the project. The site was formerly planned to be an LNG import terminal that had been mothballed in 2007, due to the shale revolution in the US. The site has the advantage that much of the permitting and approvals have already been granted and civil works had already got to an advanced stage (see below). Roads, utilities and foundations for two 180,000m3 LNG tanks are complete.
The site is large (327 acres vs 115 at Magnolia) and the company has ample space for 8mtpa (two phases). Indeed, it has filed applications with the Canadian authorities for up to 12mtpa of capacity.
|
Exhibit 6: Bear Head site |
|
|
Source: LNGL |
We assume that first gas for 8mtpa is in January 2024, with a third 4mtpa train a year later (if at all).
LNGL currently owns 100% of the project. We expect the capex requirements to be broadly similar to Magnolia for the first 8mtpa. While much of the civil works are complete, the project may cost more, given the harsher climate in Nova Scotia. This would leave the company needing to source well over US$1,000m even if it is able to raise 75% of funding with debt.
It is possible that cash flows from Magnolia could be directed towards Bear Head development, allowing LNGL to keep a large portion of the project. However, for the moment, we assume that it is funded in a similar way to Magnolia, with a third party funding to gain a minority stake. This leaves LNG open to equity costs, but it should retain a larger part of the project. This equity funding could be raised through corporate debt or possibly an equity issue, although we anticipate that this will be cleared up as and when the project is progressed towards sanction. Under these revised assumptions, we model LNGL to retain 60% of the project (down from 80% previously).
Other projects
Fisherman’s Landing
We see Fisherman’s Landing as an option. The company has a site lease until March 2017 (with an option to extend to March 2018), but until further progress is made, it is not a material part of the LNGL investment case. We believe the company will not progress with the project until a gas source can be assured. We do not expect the company to buy upstream assets.
Threats and sensitivities
LNGL is exposed to a number of risks. However, its exposure to commodity price changes is minimal. The company should have no direct exposure to commodity risk, while operating costs movements should be largely mitigated by tolling fees.
Regulation and market risk: the Gladstone project progressed well until the March 2010 acquisition of Arrow Energy by Shell removed the gas source for the project, despite the project being at a late stage. No such obstacle is anticipated for the current projects, although postponement/cancellation is possible for any project.
Financing risks: LNGL needs to secure the funding for the development of the projects. For the 8mtpa Magnolia project, this is US$4.4bn (gross excluding other costs, $5bn including other costs). Of this, we assume 30% should be funded by equity (from Stonepeak), with the rest funded through debt. Without this funding, the Magnolia project’s (and hence LNGL’s) value could be uneconomic or severely compromised. The Magnolia project’s expansion towards 8mtpa means that more equity financing will be required. If it does not come from Stonepeak, financing will have to be found elsewhere. However, the involvement of BNP Paribas as debt co-ordinator encourages us regarding the potential funding at this stage.
Technological risk: the OSMR process has received the technological approval of KBR and SK E&C and has the tacit confidence of a range of companies. The contract with contractors should provide performance liquidated damages for capacity should the technology not deliver the modelled efficiencies. The tolling term sheets also require that Magnolia provides minimum production – if this is not done, the plant could suffer financial penalties.
Cost escalation risk: cost escalation risk is well mitigated. LNGL is seeking turnkey contracts for the construction of the plants, leading to a fixed cost. Should the final quoted cost (at FID) be higher than our current estimates, the equity committed from Stonepeak could increase, while we expect that the debt facility could also expand proportionately. This could lead to LNGL retaining a lower stake, but should not present an existential risk to the project.
Protection risk: LNGL has gained patent protection for its combination of technologies in 16 countries including the US, Canada and Australia (countries where its projects are currently located).
Partner risk: the success of the LNGL projects is reliant on many parties, whether that is (for Magnolia) providing equity finance (Stonepeak), arranging debt finance (BNP Paribas), signing binding tolling agreements (Meridian so far), constructing the plants (KBR and SK E&C) and transporting the gas (Kinder Morgan).The agreement with Meridian (a liquefaction tolling agreement over 20 years with firm annual capacity of at least 1.7mtpa) is valid until December 2016; we hope that this is extended again.
Tax risks: Magnolia is subject to federal and state taxes of 38%, with a 2% land tax (2% of asset value, with a five-year tax break extendable for a second five-year period). For Bear Head, we apply the 38% corporate tax rate and a 16% Nova Scotia state tax. We have not modelled any other taxes or tax breaks. See the valuation sensitivities section for the effect of additional taxes, which cannot be ruled out.
LNG pricing risks: our base case assumption is that all LNG is sold to FTA-approved countries. However, Magnolia is widely expected to gain approval to sell to non-FTA countries, in which case it may be entitled to additional tolling fees above and beyond the current arrangements. We note the DoE has determined that exports of up to 20bcf/d are in the public interest. Current export quantities are 15bcf/d and MLNG (of 1.1bcf/d) could well be the next project to receive non-FTA approval, so should be well within the threshold.
Management
Given the two projects at LNGL, we believe it is important to consider not just the management of LNGL, but also the senior roles within each project. We think the summary CVs are strong. We particularly highlight the experience of the new CEO (Greg Vesey), chairman (Paul Cavicchi) and new non-executive director (Phil Moeller).
LNGL key personnel
Chairman (retiring in November 2016): Richard Jonathan Beresford has over 30 years’ experience in the international energy industry. Richard spent 12 years with British Gas. He joined Woodside in 1996 where he became general manager, business development, then managing director of Metasource, Woodside's green energy subsidiary. Richard was head of gas strategy and development of CLP Power Hong Kong from 2005-07. He is currently the executive chairman of ASX-listed Green Rock Energy and has been a non-executive director of ASX-listed Eden Energy since May 2007.
Incoming chairman (November 2016, previously a NED): Paul Cavicchi has over 25 years’ experience across a range of gas and power projects, including development and construction of LNG infrastructure. Paul’s most recent executive position was as executive VP of GDF SUEZ Energy North America where he supervised and directed all business development efforts for the company in North America. Previous roles include president and CEO of SUEZ Renewable Energy.
CEO: Greg Vesey joined as MD and CEO in April 2016, based in Houston. Greg has held senior executive roles in the international energy sector through a distinguished career of 35 years with Chevron and Texaco. Most recently he was president of Chevron Natural Gas and VP, gas supply and trading, from 2011 to 2015. In this role he was responsible for Chevron’s global LNG, natural gas, and natural gas liquid marketing and trading activity and was based in Houston. Other roles include president of Chevron Global Power and at Chevron Technology Ventures. Greg holds a Bachelor of Business degree from Northwestern State University of Louisiana.
CFO: Mike Mott joined the company in September 2014. Before joining LNG, Mike held a number of senior finance, strategy and operations roles at BG. He held progressively senior accounting and risk management roles at Dynegy from 1995 and was previously at PwC.
CDO: Anthony Gelotti joined as chief development officer in November 2015, based in Houston. He has over 40 years’ experience in the energy and LNG industry and has proven ability to structure and build organizations and lead major project development and commercial teams within the LNG market. He has held positions as president (Woodfibre LNG), VP - Global LNG (Chevron) from 2006 to 2013.
CTO: John Baguley joined LNGL in May 2014 as the Magnolia LNG COO based in Houston, moving to CTO in November 2015. John brings over 30 years’ experience in the successful delivery of front-end engineering design and EPC services for major LNG plants and projects worldwide, including serving as a project director, project manager and engineering manager for some of the world’s most challenging facility locations (primarily at KBR for 33 years).
Recent additions to the board
Non-executive director: Phil Moeller is a former Commissioner of the Federal Energy Regulatory Commission (FERC). He was the second-longest serving member in the history of FERC and the only person in the federal government in a Senate-confirmed position who was nominated by both President George W. Bush and President Barack Obama. He focused on policies that encouraged the construction of additional electric transmission and interstate natural gas infrastructure and policies promoting well-functioning wholesale markets.
Financials
Project financing cost
Key to the returns to the project, the amount of equity LNGL can retain and the company value will be the amount of debt that can be allocated to the project and its cost. For simplicity, we model that all debt is provided by a bank facility that is paid off as quickly as possible with project free cash flows. This will almost certainly not be the case – Cheniere has raised c 80% of its debt through bonds, with the remaining 20% as a bank facility. As a result, our modelling (with dividends paid only after all bank debt is paid off on a project basis) will likely lead to a later (and higher) dividend stream than will probably take place.
We assume that 70% of the project financing will be achieved through debt (equity from Stonepeak to provide the rest) and at an effective rate of 7.5%. This is higher than peers are trading on (on a yield-to-maturity basis), but lower than the yields seen by near-term Cheniere bonds (a company with its own issues). As a result, as long as LNGL delivers the projects as promised, we think 7.5% is a fair/conservative assumption for the moment.
|
Exhibit 7: Cheniere bond yield to maturity vs pipeline/infrastructure peers |
Exhibit 8: Cheniere bond yield to maturity |
|
|
|
Source: Bloomberg, Edison Investment Research |
|
Exhibit 7: Cheniere bond yield to maturity vs pipeline/infrastructure peers |
|
|
Source: Bloomberg, Edison Investment Research |
|
Exhibit 8: Cheniere bond yield to maturity |
|
|
Source: Bloomberg, Edison Investment Research |
Company financials
At June 2016, LNG had cash resources of A$67m (US$51m), and annual administration expenses of c A$20m (US$15m). In FY16 (June 2015 to June2016), LNGL incurred project development costs of A$89m (US$67m).
In the next 12 months, we expect cash burn to be materially lower than this as project FEED and development has been reduced. We model a project development cost of A$20m and admin costs of A$12m, which leads to an estimated June 2017 cash balance of A$34m. In the event that no project sanction is taken in the next 24 months, we would expect the company to be able to maintain cash resources given a lower annual cash burn. These cash resources should therefore be enough to see the company through to a project sanction in the 2017-18 period.
We model project sanction at Magnolia in FY18 (July 2017 to June 2018), with a success fee from Stonepeak providing additional cash resources. The project should then be largely funded by Stonepeak and by debt facilities, meaning that Magnolia LNG should be fully funded for trains 1 to 4. However, the company may need to raise further equity to provide enough cash for corporate costs before first LNG is delivered in 2024.
|
Exhibit 9: Project capacity under long-term contract vs debt ratio achieved for global LNG projects |
Exhibit 10: Gross unlevered cash flows and net levered cash flows from Magnolia 1&2 (Phase 1) |
|
|
|
Source: EconStor. Note: The Magnolia LNG mark is our modelling assumption. |
Source: Edison Investment Research |
|
Exhibit 9: Project capacity under long-term contract vs debt ratio achieved for global LNG projects |
|
|
Source: EconStor. Note: The Magnolia LNG mark is our modelling assumption. |
|
Exhibit 10: Gross unlevered cash flows and net levered cash flows from Magnolia 1&2 (Phase 1) |
|
|
Source: Edison Investment Research |
Valuation
Our DCF approach is one used across our oils coverage and, given the steady predictable expected EBITDA across the LNG projects, should be applicable for the valuation of LNGL. We then apply a risking to account for various factors before the projects’ start-up (such as uncertainty over possible delays and uncertainty over reaching FID/sanction).
Major assumptions
■
We assume a tolling fee of US$2.5/mcf (or equivalent margin achieved in an SPA) inflating at 0.5% per year from start-up in 2022, 96% utilization EBITDA of c US$430m pa per 4mtpa phase at Magnolia (and/or Bear Head).
■
A corporate tax rate of 38% and land tax rate of 2% at Magnolia.
■
Debt funding of 70% of the project with an interest rate of 7.5%. The debt is modelled as bank debt, although we expect the project to raise the majority of the capital through bonds (as Cheniere has done).
■
Equity funding to account for 25% of the capex bill. For Magnolia, this should come from Stonepeak Infrastructure Fund in return for an equity stake that generates a fixed return (for the purposes of our model we assume 14%). We assume that LNGL contributes no capital at Magnolia but some equity in Bear Head (although we assume an unknown partner will provide capital, requiring the same terms as Stonepeak). Overall, this will leave LNGL needing to raise some capital from 2019/20 onwards. We expect this to be raised at a material premium to today’s price, but at a discount to our fair value at the time, which would result in a dilution to NAV/share. We tentatively assume that this capital therefore accrues a 30% cost.
Exhibit 11: NAV summary
Asset |
|
Equity interest |
|
Net risked value |
|||
Country |
CoS |
|
|
|
|||
|
% |
% |
US$m |
A$/share |
US$/ADR |
||
Net (debt)/cash (June 2016) |
51 |
0.13 |
0.40 |
||||
G&A |
(55) |
(0.14) |
(0.44) |
||||
Project development costs Jun 2016 - July 2017 |
(15) |
(0.04) |
(0.12) |
||||
Magnolia Trains 1&2 |
United States |
35% |
60% |
218 |
0.57 |
1.74 |
|
Magnolia Trains 3&4 |
United States |
35% |
60% |
166 |
0.43 |
1.32 |
|
Bear Head Trains 1&2 |
Canada |
60% |
20% |
68 |
0.18 |
0.54 |
|
Bear Head Trains 3&4 |
Canada |
60% |
20% |
68 |
0.18 |
0.54 |
|
Risked NPV of cost of raising equity at Bear Head (assumed NAV/share dilutive effect 30%) |
20% |
(16) |
(0.04) |
(0.13) |
|||
NAV |
|
|
0% |
485 |
1.27 |
3.86 |
|
Source: Edison Investment Research. Note: We assume all financing for Magnolia is provided by debt and Stonepeak and that LNG only has to provide for corporate costs. At Bear Head, we assume LNGL provides equity capital and is thus able to retain more of the project.
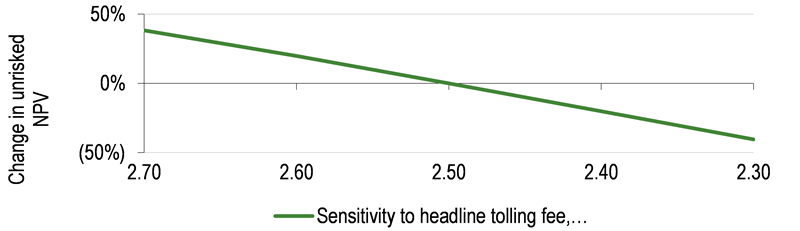
Our modelling assumptions produce an unlevered IRR for Magnolia (gross) of 16% in 2018, so the returns/value due to LNGL depend to a great extent on the inputs we use. Increase in debt facility/lowering of debt rates/increasing tolling fees achieved/decreases in final capex bills and other factors all have a very material effect on this valuation. We also caution that our risking is very subjective and we would urge investors to be comfortable with their own view on project progress.
Implied valuations from pricing multiples
If and when the Magnolia and Bear Head projects start up, they should be producing reliable, long-term cash flows that will be similar to many utilities and infrastructure firms. As a result, we believe LNGL will be valued/priced in a similar way. A great deal can change in the next few years before a plant comes online, so we are cautious in applying current metrics to future valuations. Instead, we refer to historical ranges to get an idea of good/poor valuation scenarios for LNGL. This work indicates that the company may be expected to trade on:
■
EV/EBITDA: 6-12x.
■
P/E: 10-20x.
■
Price/cash flow: 6-15x.
■
Dividend yield: 3-5%.
A full set of charts showing historical data for comparable peers and indices starts with Exhibit 16 below.
|
Exhibit 12: EV/EBITDA ranges for LNGL with Magnolia only (value per ADR) |
Exhibit 13: P/E ranges for LNGL with Magnolia only |
|
|
|
|
|
Source: Edison Investment Research, Bloomberg |
|
|
Exhibit 14: EV/EBITDA ranges for LNGL with Magnolia and Bear Head |
Exhibit 15: P/E ranges for LNGL with Magnolia and Bear Head |
|
|
|
|
|
|
Source: Edison Investment Research, Bloomberg |
|
Historical pricing multiples for peers
Companies that we consider to be peers of LNGL have traded on a wide range of multiples in the last 25 years, depending on interest rates and overall investment sentiment. As a result, investors should be aware that current peer multiples are not consistent over time and are towards the top of historical norms.
|
Exhibit 16: Long-term multiples for peers – New York Industrial Average Index |
Exhibit 17: Utilities index multiples over time |
|
|
|
Source: Bloomberg, Edison Investment Research |
|
Exhibit 16: Long-term multiples for peers – New York Industrial Average Index |
|
|
Source: Bloomberg, Edison Investment Research |
|
Exhibit 17: Utilities index multiples over time |
|
|
Source: Bloomberg, Edison Investment Research |
|
Exhibit 18: Price to earnings multiples for comparable companies |
Exhibit 19:EV/EBITDA multiples for comparable companies |
|
|
|
Source: Bloomberg, Edison Investment Research |
|
Exhibit 18: Price to earnings multiples for comparable companies |
|
|
Source: Bloomberg, Edison Investment Research |
|
Exhibit 19:EV/EBITDA multiples for comparable companies |
|
|
Source: Bloomberg, Edison Investment Research |
|
Exhibit 20: Price to cash flow multiples for comparable companies |
Exhibit 21: Dividend yields for comparable companies |
|
|
|
Source: Bloomberg, Edison Investment Research |
|
Exhibit 20: Price to cash flow multiples for comparable companies |
|
|
Source: Bloomberg, Edison Investment Research |
|
Exhibit 21: Dividend yields for comparable companies |
|
|
Source: Bloomberg, Edison Investment Research |
Valuation sensitivities
Given the material uncertainties to the Magnolia and Bear Head projects, it is worth seeing how sensitive the value would be to flexing various assumptions. To be explicit, all cases below show the effect of the movement of the named variable alone, although in reality at the same time a number will likely vary from our base assumptions. The effect is seen in the current unrisked, DCF-derived value for Magnolia trains 1-4 only. Delays, capacity changes, the debt that can be taken on to fund the project, Stonepeak’s contribution (and required IRR), as well as other factors, will also have a material effect on LNGL’s value.
|
Exhibit 22: Scenarios |
Exhibit 23: Effect on project ownership and net value, US$m |
Exhibit 24: Effect on net value |
Discount rate applied to levered cash flows. Default is 10%. |
|
|
Capex – base case is the upper end of the current guidance (US$4.354bn with a further 15.5% of “other costs”, or a total of $5bn). Low end of guidance would correspond to $3.8bn + other costs leading to US$4.4bn. |
|
|
Interest rate on debt – assumed as 7.5% as base case where debt provides 70% of funding requirement. |
|
|
Debt available to finance project (assume any amount below 70% is provided by LNGL). If more than 75% debt is provided, Stonepeak reduces its contribution. |
|
|
Tolling fee (or average rate achieved through SPAs if used). Default is US$2.5/mcf. |
|
|
|
Source: Edison Investment Research |
||
Exhibit 25: Peer group valuations
Company |
Market cap ($m) |
EV ($m) |
EV/EBITDA (x) |
P/E (x) |
Price/cash flow (x) |
Dividend yield (%) |
||||||||
|
|
|
2017 |
2018 |
2019 |
2017 |
2018 |
2019 |
2017 |
2018 |
2019 |
2017 |
2018 |
2019 |
Cheniere Energy Inc |
9,932 |
25,535 |
86.9 |
14.7 |
9.4 |
N/A |
107.8 |
23.4 |
0.0 |
0.0 |
0.0 |
|||
National Grid |
48,802 |
79,212 |
11.3 |
11.3 |
11.1 |
16.7 |
16.2 |
15.8 |
9.8 |
9.4 |
8.8 |
4.2 |
4.3 |
4.5 |
United Utilities Group |
7,691 |
16,006 |
12.9 |
12.5 |
11.8 |
20.2 |
19.5 |
17.7 |
8.6 |
8.5 |
8.0 |
4.2 |
4.4 |
4.5 |
Severn Trent |
6,664 |
12,628 |
12.3 |
12.0 |
11.7 |
22.1 |
21.5 |
19.9 |
9.3 |
9.5 |
8.7 |
3.5 |
3.6 |
3.7 |
Pennon Group |
4,207 |
7,261 |
13.0 |
12.4 |
11.4 |
20.4 |
19.3 |
16.7 |
9.4 |
9.1 |
8.1 |
4.3 |
4.6 |
4.9 |
Snam SpA |
18,278 |
33,582 |
11.6 |
11.4 |
11.2 |
15.7 |
14.8 |
14.3 |
8.6 |
8.2 |
8.0 |
5.3 |
5.4 |
5.5 |
Federal Grid Co Unified Energy System PJSC |
3,497 |
7,071 |
4.0 |
3.3 |
2.2 |
4.2 |
4.5 |
4.4 |
1.1 |
1.1 |
1.0 |
1.8 |
4.1 |
7.6 |
Red Electrica Corp SA |
11,273 |
17,661 |
10.2 |
9.9 |
9.6 |
15.7 |
15.1 |
14.2 |
9.4 |
9.0 |
8.7 |
4.5 |
4.9 |
5.2 |
Fluxys Belgium SA |
2,082 |
1,935 |
6.3 |
6.0 |
39.5 |
31.8 |
-- |
10.0 |
10.3 |
4.3 |
4.2 |
0.0 |
||
REN - Redes Energeticas Nacionais SGPS SA |
1,495 |
4,246 |
8.0 |
8.0 |
8.0 |
13.3 |
12.6 |
12.1 |
4.1 |
4.2 |
4.1 |
6.7 |
6.7 |
6.6 |
Enagas SA |
6,789 |
11,519 |
11.8 |
11.8 |
11.9 |
14.6 |
14.3 |
14.2 |
9.8 |
8.9 |
8.7 |
5.4 |
5.7 |
6.0 |
Terna Rete Elettrica Nazionale SpA |
9,758 |
19,472 |
11.2 |
10.7 |
10.4 |
15.2 |
14.1 |
14.0 |
8.1 |
7.6 |
7.3 |
4.8 |
4.8 |
5.0 |
Centrica |
14,485 |
21,218 |
6.9 |
6.4 |
6.0 |
14.1 |
13.3 |
12.2 |
6.3 |
6.6 |
6.5 |
5.7 |
5.8 |
6.0 |
Consolidated Edison Inc |
21,979 |
35,309 |
9.9 |
9.3 |
9.1 |
18.2 |
17.5 |
16.7 |
8.3 |
7.6 |
7.0 |
3.7 |
3.8 |
3.9 |
Fortum OYJ |
14,320 |
11,832 |
11.4 |
11.9 |
11.5 |
22.6 |
22.2 |
20.6 |
14.8 |
15.5 |
14.0 |
5.1 |
4.6 |
4.8 |
RWE AG |
8,958 |
18,398 |
4.4 |
4.4 |
4.1 |
13.5 |
12.4 |
12.9 |
2.9 |
2.7 |
2.7 |
1.8 |
2.1 |
2.4 |
PG&E Corp |
29,974 |
46,826 |
8.2 |
7.7 |
7.3 |
16.0 |
16.2 |
15.4 |
6.9 |
6.1 |
5.9 |
3.3 |
3.5 |
3.8 |
Sempra Energy |
26,057 |
40,270 |
12.2 |
10.7 |
9.4 |
21.8 |
20.4 |
17.1 |
11.0 |
9.9 |
8.6 |
2.9 |
3.1 |
3.4 |
National Fuel Gas Co |
4,589 |
6,559 |
18.2 |
17.8 |
15.2 |
7.6 |
8.2 |
6.1 |
3.0 |
3.0 |
3.1 |
|||
South Jersey Industries Inc |
2,232 |
3,647 |
21.8 |
21.1 |
17.4 |
3.8 |
3.9 |
4.0 |
||||||
CenterPoint Energy Inc |
9,553 |
17,298 |
8.9 |
8.6 |
8.5 |
19.3 |
18.3 |
17.2 |
5.4 |
4.8 |
4.7 |
4.7 |
4.9 |
5.1 |
NiSource Inc |
7,381 |
14,286 |
10.1 |
9.9 |
9.7 |
21.3 |
19.7 |
18.9 |
8.2 |
7.9 |
7.6 |
2.8 |
3.0 |
3.1 |
UGI Corp |
7,640 |
11,091 |
21.2 |
18.8 |
19.0 |
5.0 |
7.0 |
2.1 |
2.2 |
2.3 |
||||
Vectren Corp |
3,967 |
5,703 |
19.4 |
18.0 |
17.0 |
6.7 |
7.2 |
3.4 |
3.6 |
3.7 |
||||
Southwest Gas Corp |
3,131 |
4,684 |
20.9 |
19.2 |
18.1 |
5.0 |
6.8 |
2.7 |
3.0 |
3.4 |
||||
New Jersey Resources Corp |
2,765 |
3,669 |
20.1 |
18.7 |
17.9 |
25.9 |
12.7 |
3.0 |
3.2 |
3.3 |
||||
MDU Resources Group Inc |
4,929 |
6,762 |
22.3 |
19.2 |
16.8 |
3.0 |
3.0 |
3.2 |
||||||
Atmos Energy Corp |
7,342 |
10,227 |
11.1 |
10.6 |
10.1 |
21.3 |
20.1 |
18.9 |
10.0 |
9.1 |
2.4 |
2.5 |
2.7 |
|
Kinder Morgan Inc/DE |
47,816 |
89,040 |
12.3 |
12.0 |
11.4 |
31.5 |
28.1 |
24.6 |
11.0 |
10.3 |
9.7 |
2.3 |
2.3 |
3.3 |
Williams Cos Inc/The |
22,948 |
47,335 |
11.1 |
10.8 |
9.7 |
39.7 |
30.3 |
25.9 |
12.8 |
9.3 |
7.4 |
5.5 |
2.8 |
5.7 |
Energy Transfer Partners LP |
19,250 |
47,635 |
8.2 |
7.3 |
6.4 |
61.6 |
17.8 |
14.6 |
5.4 |
4.0 |
3.5 |
11.5 |
11.5 |
11.7 |
Spectra Energy Partners LP |
13,246 |
19,417 |
10.7 |
9.7 |
8.9 |
13.6 |
12.1 |
11.9 |
8.6 |
7.7 |
7.5 |
6.2 |
6.7 |
7.1 |
Boardwalk Pipeline Partners LP |
4,223 |
7,679 |
10.0 |
9.5 |
8.6 |
14.7 |
13.5 |
12.1 |
7.0 |
6.5 |
6.1 |
2.4 |
2.6 |
5.3 |
Spectra Energy Corp |
29,551 |
43,994 |
16.2 |
14.4 |
13.2 |
36.0 |
29.7 |
27.7 |
17.7 |
16.6 |
12.9 |
3.9 |
4.2 |
4.5 |
Praxair Inc |
33,877 |
42,961 |
12.4 |
11.6 |
11.0 |
21.5 |
19.7 |
18.0 |
12.8 |
12.1 |
11.3 |
2.5 |
2.7 |
2.7 |
Air Products & Chemicals Inc |
29,321 |
34,993 |
10.3 |
9.9 |
10.1 |
18.1 |
18.4 |
17.4 |
12.0 |
11.9 |
11.3 |
2.5 |
2.6 |
2.6 |
Dominion Resources Inc/VA |
45,193 |
73,537 |
13.2 |
12.2 |
11.1 |
19.1 |
18.8 |
17.2 |
10.6 |
10.2 |
9.4 |
3.9 |
4.2 |
4.5 |
Iberdrola SA |
41,798 |
72,697 |
8.5 |
8.4 |
8.0 |
14.5 |
14.1 |
13.3 |
7.2 |
7.0 |
6.5 |
5.0 |
5.1 |
5.3 |
Gamesa Corp Tecnologica SA |
6,313 |
5,929 |
8.0 |
7.7 |
7.4 |
21.0 |
18.7 |
17.6 |
14.1 |
11.9 |
12.0 |
1.2 |
1.6 |
1.7 |
Nordex SE |
2,760 |
2,401 |
8.7 |
6.6 |
5.7 |
20.5 |
16.0 |
13.8 |
14.0 |
12.0 |
11.4 |
0.1 |
0.1 |
1.0 |
Vestas Wind Systems A/S |
18,009 |
131,475 |
8.4 |
8.5 |
8.0 |
18.1 |
17.7 |
16.9 |
11.7 |
12.4 |
11.9 |
1.5 |
1.5 |
1.6 |
Source: Bloomberg, Edison Investment Research
Exhibit 26: Financial summary
|
|
US$m |
2014 |
2015 |
2016 |
2017e |
2018e |
June |
|
|
IFRS |
IFRS |
IFRS |
IFRS |
IFRS |
PROFIT & LOSS |
|||||||
Revenue |
|
|
0 |
0 |
0 |
0 |
78 |
Cost of Sales |
0 |
1 |
0 |
0 |
0 |
||
Gross Profit |
0 |
1 |
0 |
0 |
78 |
||
EBITDA |
|
|
(18) |
(66) |
(87) |
(33) |
45 |
Operating Profit (before amort. and except.) |
(18) |
(66) |
(88) |
(33) |
45 |
||
Intangible Amortization |
0 |
0 |
0 |
0 |
0 |
||
Exceptionals |
0 |
0 |
0 |
0 |
0 |
||
Other |
0 |
0 |
0 |
0 |
0 |
||
Operating Profit |
(18) |
(66) |
(88) |
(33) |
45 |
||
Net Interest |
(1) |
0 |
0 |
0 |
0 |
||
Profit Before Tax (norm) |
(19) |
(65) |
(87) |
(33) |
45 |
||
Profit Before Tax (FRS 3) |
(19) |
(65) |
(87) |
(33) |
45 |
||
Tax |
0 |
(0) |
0 |
0 |
0 |
||
Profit After Tax (norm) |
(19) |
(65) |
(87) |
(33) |
45 |
||
Profit After Tax (FRS 3) |
(19) |
(65) |
(87) |
(33) |
45 |
||
Average Number of ADRs |
115.5 |
125.8 |
126.0 |
126.0 |
126.0 |
||
EPS - normalized |
|
(0.0) |
(0.0) |
(0.0) |
(0.0) |
0.0 |
|
EPS - normalized and fully diluted |
(0.0) |
(0.0) |
(0.0) |
(0.0) |
0.0 |
||
EPS - (IFRS) |
|
(0.0) |
(0.0) |
(0.0) |
(0.0) |
0.0 |
|
Dividend per share |
0.0 |
0.0 |
0.0 |
0.0 |
0.0 |
||
Gross Margin (%) |
N/A |
N/A |
N/A |
N/A |
N/A |
||
EBITDA Margin (%) |
N/A |
N/A |
N/A |
N/A |
N/A |
||
Operating Margin (before GW and except.) (%) |
N/A |
N/A |
N/A |
N/A |
N/A |
||
BALANCE SHEET |
|||||||
Fixed Assets |
|
0 |
9 |
9 |
9 |
20 |
|
Intangible Assets |
0 |
0 |
0 |
0 |
1 |
||
Tangible Assets |
0 |
9 |
9 |
9 |
20 |
||
Investments |
0 |
0 |
0 |
0 |
0 |
||
Current Assets |
|
39 |
140 |
55 |
30 |
82 |
|
Stocks |
0 |
0 |
0 |
0 |
0 |
||
Debtors |
0 |
2 |
1 |
1 |
1 |
||
Cash |
36 |
36 |
51 |
26 |
78 |
||
Other |
3 |
102 |
3 |
3 |
3 |
||
Current Liabilities |
|
(3) |
(11) |
(3) |
(3) |
(3) |
|
Creditors |
(3) |
(11) |
(3) |
(3) |
(3) |
||
Short term borrowings |
(0) |
(0) |
(0) |
(0) |
(0) |
||
Long Term Liabilities |
|
(0) |
(0) |
(0) |
(0) |
(0) |
|
Long term borrowings |
(0) |
(0) |
(0) |
(0) |
0 |
||
Other long term liabilities |
(0) |
(0) |
(0) |
(0) |
(0) |
||
Net Assets |
|
|
36 |
138 |
61 |
36 |
100 |
CASH FLOW |
|||||||
Operating Cash Flow |
|
(16) |
(53) |
(89) |
(25) |
53 |
|
Net Interest |
(0) |
(0) |
(0) |
(0) |
(0) |
||
Tax |
0 |
0 |
0 |
0 |
0 |
||
Capex |
(0) |
(9) |
(0) |
0 |
(11) |
||
Acquisitions/disposals |
0 |
0 |
0 |
0 |
0 |
||
Financing |
53 |
155 |
0 |
0 |
0 |
||
Dividends |
0 |
0 |
0 |
0 |
0 |
||
Other |
|||||||
Net Cash Flow |
35 |
(1) |
15 |
(25) |
41 |
||
Opening net debt/(cash) |
(1) |
(36) |
(36) |
(51) |
(26) |
||
HP finance leases initiated |
0 |
0 |
0 |
0 |
0 |
||
Other |
(0) |
0 |
(0) |
0 |
0 |
||
Closing net debt/(cash) |
(36) |
(36) |
(51) |
(26) |
(67) |
||
Source: Edison Investment Research, company accounts
|
|||||||||||||||||||||||||||||||||||||||||||||||
|
|