Leigh Creek Energy
Written by
Leigh Creek Energy |
South Australian energy prospect |
Initiation of coverage |
Oil & gas |
2 February 2017 |
Share price performance
Business description
Next events
Analysts
Leigh Creek Energy is a research client of Edison Investment Research Limited |
|||||||||||||||||||||||||||||||||||||||||||||||
Leigh Creek Energy (LCK) offers investors an option over the in-situ gasification (ISG) of an underground coal resource in the state of South Australia (SA). Recent power blackouts in SA have highlighted the need for more baseload power generation capacity, while high electricity prices incentivise the monetisation of 2,964PJ of 2C ISG gas resource at the Leigh Creek Energy Project (LCEP). The development of LCEP is not without risk and uncertainty at this stage; however, if LCK is able to attract development funding and mid-stream/power infrastructure partners, LCK could be worth materially more than its A$40m market cap. Our 2C risked valuation after farm-down is A$83m (A$0.31/share) based on a subjective 20% chance of success.
Year |
Revenue |
PBT* |
Capex |
Net cash |
Free cash flow |
06/15 |
0.0 |
(17.7) |
(1.2) |
1.4 |
(2.1) |
06/16 |
0.0 |
(5.4) |
(1.8) |
8.7 |
(5.8) |
06/17e |
0.0 |
(2.9) |
(16.0) |
(9.4) |
(18.0) |
06/18e |
0.0 |
(3.7) |
0.0 |
(5.8) |
3.5 |
Note: *PBT is normalised, excluding amortisation of acquired intangibles, exceptional items and share-based payments.
South Australia power market dynamics
SA is the highest priced domestic gas and power market and state-wide blackouts as recent as 28 September 2016 have highlighted a need for greater within-state baseload power generation. This would augment renewable sources (largely wind and solar) as well as underpin supply when the inter-state grid connection is offline. The government of SA has regulations in place to specifically permit ISG operations and is supportive of the monetisation of deep coal-resources.
2017 demonstration to partly de-risk ISG deployment
In 2017, LCK plans to drill its first LCEP ISG well pair and operate a gasifier for 30 to 60 days, optimising ISG operational parameters and confirming satisfactory management of environmental and safety risks. In the success case, scale-up risk would be minimal as the gasifier in this demonstration will produce syngas using commercial-scale equipment. The A$16m (FY17 capex) demonstration project is expected to be funded through a combination of short-term debt and cash/equity.
Valuation and sensitivities: Partners’ alignment
We value the LCEP on the basis of monetisation of 2C ISG gas resource via a combination of local power generation (450MW) and piped methane sales. This assumes a utility installs gas power generation capacity close to site and a pipeline company builds and operates a 230km pipeline to the Moomba Adelaide Pipeline System. We also assume LCK is able to farm-out the upstream element of LCEP for a development carry delivering first gas in 2020 (farminee 17.5% IRR). Our base case net LCK valuation is A$0.31/share based on a subjective 20% chance of success. This would rise to A$443m (A$1.66/share) were LCEP to be completely de-risked. Key valuation sensitivities include realised gas pricing, the required returns of partners, project timing and costs. The market is currently implying a 10% commercial chance of success on our estimates.
Investment summary
Company description: South Australia in-situ coal gasification
Leigh Creek Energy is planning to monetise 2,964PJ (2C) of gas resource in South Australia (SA). SA is the highest priced gas and power market in Australia and recent changes in the supply mix away from coal to intermittent renewable sources has opened up an opportunity to provide baseload gas power generation. State-wide blackouts as recent as 28 September 2016 serve to remind us of vulnerabilities in the SA power network and the political importance of the Leigh Creek Energy Project (LCEP). Technical, permitting and funding risks remain; however, with a market capitalisation of just A$40m, LCK offers investors an option on what appears to be a technically feasible gas power generation project.
Valuation: An option on gas monetisation
Our valuation is underpinned by a phased Leigh Creek Energy Project (LCEP) consisting of: a 16PJ (150MW) Stage 1 power project; a second-stage power expansion taking output to 32PJ (450MW) including additional generation capacity and combined cycle; and natural gas export of 80PJ. We value the company on a gross unfunded, unrisked basis, after LCK overheads, at A$688m or A$2.59/share. This is based on LCK monetising its 2C gas resource, with molecules sold to both a power generator and to the Australian wholesale gas market. Our analysis suggests that the LCEP project generates a positive NPV12.5 at a realised methane price of A$6/GJ and power price of A$50/MWh, and a price deck of A$7.5/GJ and A$80/MWh is required to generate a 25% return. At our base case A$8/GJ methane and A$80/MWh power, LCEP generates peak free cash flow (FCF) of c A$515m in 2030 at plateau production of 120PJ/a. We apply a risking and funding overlay to our gross project valuation as LCEP is contingent on LCK obtaining funding for the upstream and attracting mid-stream partners to invest in necessary power and pipeline infrastructure. We assume the upstream is funded through farm-out, with the farminee carrying LCK’s share of upstream costs and generating an upstream IRR of 17.5% (post-carry). To achieve this, we estimate that LCK will have to farm out 67% of its working interest in LCEP. Post farm-down, we value LCK at A$443m or A$1.66/share; after applying a subjective 20% risk to reflect technical, partner and funding risks, this falls to A$83m or A$0.31/share.
Financials: Farm-out and project finance required
Significant investment is required to progress LCEP to first syngas; key capital components include the upstream ISG operation at c A$1,830m (capital spend on compression, gas treatment for methane export); ISG well pairs (A$2m each); power plant at c A$985m at an assumed 450MW installed capacity; and c A$300m for a gas pipeline to the Moomba to Adelaide Pipeline System (MAPS). We assume in our base case that the upstream component of LCEP is funded through farm-out; the power component is funded by a utility under a syngas for power agreement; and the pipeline is financed by a third-party under a tariff agreement.
Sensitivities: LCEP to be de-risked through gas demonstration
The LCEP remains relatively early stage and as such we see technical risks around project delivery and uncertainty on key assumptions such as ISG recovery rates and development cost. As it stands, our base case valuation of A$0.31/share could vary significantly to the upside or downside depending on assumptions for realised gas pricing, operational costs and the timing/cost of project delivery. We provide sensitivities to key inputs within this note.
Leigh Creek Energy Project (LCEP)
In 2015, LCK reached a number of key milestones at the Leigh Creek Energy Project (LCEP). The project is now underpinned by a JORC-certified coal resource of 377Mt (inferred) and a PRMS gas resource of 2,964PJ (2C). A demonstration in 2017 is expected to add to the company’s knowledge base, providing further definition of the company’s recoverable resource base and economics of extraction, while demonstrating that ISG operations can be run safely and within state environmental regulations – a key de-risking event.
Resource base: 2,964PJ certified
LCEP is located 240km north-northeast of Port Augusta in South Australia at the Leigh Creek coalfield in the Telford Basin. LCEP is contained within petroleum exploration licence PEL650, and is 100% owned by LCK. Coal resource being targeted by LCEP is well defined with over 6,400 drill holes, nine 2D seismic lines and an extensive mine survey. The Leigh Creek coal deposit has been exploited via open-cut mining by a number of companies (most recently Alinta Energy) from 1950 to November 2015 and the bulk of the remaining coal resource is conducive to in-situ gasification (ISG). Geoconsult estimates an inferred, JORC-compliant coal resource of 377Mt and laboratory coal gasification tests have shown that Leigh Creek coal is capable of producing ISG syngas at a rate of 15.2GJ/tonne. MHA Petroleum Consultants (MHA) has independently certified an initial ISG contingent syngas resource of 1C 2,748PJ, 2C 2,964PJ and 3C 3,303PJ, and states that contingent resource will likely be moved to reserves on completion of planned pilot testing in 2017.
ISG technology: Technological progress
LCK plans to monetise its underground coal resource base through the use of in-situ coal gasification (ISG) technology, otherwise known as underground coal gasification (UCG). ISG is a gasification process applied to the coal seam in-situ; the chemical process of gasification produces a syngas, which can then be used for power generation or as a chemical feedstock.
Considerable research has gone into the process of ISG with experimentation carried out as early as the 1800s. Initial technology deployment was in Europe and Asia in the 1930s. Most early stage ISG projects targeted relatively shallow coals (<200m depth). However, modern projects use state-of-the-art drilling technology in order to target deeper coal seams; this has resulted in significantly improved economics and minimised environmental impact. Nevertheless, to date there have been few commercial, large-scale ISG operations. A recent increase in pilot-stage ISG projects suggests an industry-wide desire to progress recent technological improvements to commercial operation (pilot locations include Australia, New Zealand, the US, India, China and Canada).
The basic ISG process is illustrated in Exhibit 1. An ISG well pair (horizontal and vertical) is drilled into the coal seam in order to initiate the gasification process. Oxygen or air is then injected into the gasifier chamber in order to activate the process, generating steam from water present within the system. As coal is gasified at the coal face, char and ash fall to the bottom of the gasifier exposing fresh coal to the process. As the process progresses the gasifier chamber elongates into a ‘teardrop’ shape as a pressure draw pulls the syngas towards the production well.
The ISG gasification process is carefully controlled in order to ensure maximum gas recovery, optimisation of gas quality and prevention of overpressure. A number of endothermic and exothermic reactions occur within the gasifier; at the end of the reaction a syngas is produced and delivered to surface consisting mainly of CO, CO2, H2 and CH4. Surface processing cleans up the syngas for use in power generation. In subsequent phases, further clean-up then produces standard pipeline methane for use in power and generation or industry.
The ISG process is energy intensive – energy is required as an input into the gasification process prior to product gas being extracted. LCK estimates that a 100-150MW power plant would be needed to support the project to supply its energy requirements of c 1MW of energy input per 1PJ of syngas produced.
Key members of the 35-strong LCK organisation have extensive ISG experience gained at organisations such as Linc Energy and Carbon Energy in Australia. Management believes that current process design minimises gasification risks, however specification of materials for use in the high temperature, and potentially corrosive, gasifier will be important in order to mitigate mechanical failure.
|
Exhibit 1: Parallel Crip ISG Configuration |
|
|
Source: Leigh Creek Energy |
Environmental considerations
Modern ISG/UCG extraction techniques combined with CO2 capture and storage help minimise the environmental footprint. By-products of the ISG process can pose environmental risks in the event of poor site selection and/or process control. A number of early-stage ISG pilot tests in the US and Australia have indicated that ISG carried out at shallow depths can pose a risk to groundwater leading to negative public perception. More recent pilot tests (eg Carbon Energy in Queensland) have been carried out in full compliance with state environmental legislation. Furthermore, there were no concerns raised by Queensland regulators in relation to the Carbon Energy demonstration programme. Nevertheless, perceived environmental risks have led to some Australian states restricting ISG activity. In April 2016, the state of Queensland took steps to prohibit all ISG activities, stating that the potential impacts and risks associated with future commercial-scale ISG operations currently outweigh the benefits.
As it stands, South Australia has developed clear legal and regulatory frameworks to guide ISG operations. ISG is a defined act within the Petroleum and Geothermal Energy Act of South Australia. South Australia is well regarded as a jurisdiction for mining and petroleum. This is reflected in the 2015 Fraser Institute world mining survey, which rated South Australia as one of the top 10 jurisdictions globally for investment based on the Investment Attractiveness Index. This has been in line with LCK’s own experience, which has found South Australia’s government entities to be highly professional and able to provide the necessary clarity on process. Our understanding is that the government of South Australia is broadly supportive of extractive resource industries including ISG; however, it is difficult to predict how state legislature may change over time.
Combining ISG with CO2 sequestration
By-products of the ISG process include CO2 emissions, which can either be managed within site emission permits or combined with CO2 capture and storage (LCK has a gas storage permit over the current production licence) to minimise the carbon footprint. We note that the state of South Australia has committed to halving its CO2 emissions by 2030; we expect a large part of this reduction to be met through recent coal power plant closures (eg Port Augusta in 2016), but it is possible that CO2 restrictions may be imposed on ISG emissions. There is a risk that emission reduction initiatives add cost to a commercial-scale ISG project.
Other environmental considerations
The LCEP project is located at the historical Leigh Creek coal mine, so surface disturbance is unlikely to be an issue given that the site has historically been used for intensive mining operations. In-situ gasification has similarities to in-situ oil extraction/combustion processes used in oil shale retorting or heavy oil extraction. Careful consideration needs to be placed on subsurface parameters such as roof/floor stability to avoid ground level subsidence; LCK expects to mitigate this by retaining coal ‘pillars’ between gasifiers. Operational parameters such as pressure and temperature need to be controlled carefully in order to contain process fluids and to prevent ground water influx.
LCEP site location – carefully selected to mitigate risks
LCEP appears to be well located for a number of reasons:
■
South Australia has been identified as the state most supportive of natural resource operations. The state has developed clear legal and regulatory frameworks to guide ISG operations.
■
The LCEP coal resource is well-defined and extensive – suitable for commercial ISG operations.
■
The site is c 230km from major domestic gas pipelines.
■
Water at depth is saline rather than fresh water so there is no perceived risk of fresh water contamination.
■
Management believes there is a minimal risk of aquifer breach or water contamination as the coal deposit is in a self-contained basin and has very low water permeability.
■
The project is based on an existing mine site and has had prior permits for mineral extraction.
■
LCEP has potential to provide fertilisers (ammonium nitrate based) to local farmers.
■
High subsurface pressures favour the generation of methane and CO2 over hydrogen and CO formation.
■
Coal depth is favourable at c 600m subsurface.
■
The thick coal seam of c 20m should allow for a strong gasifier roof.
Gas monetisation timeline and options
LCK is evaluating several options for the monetisation of the LCEP gas resource. The first step of this process is to de-risk the project through a pilot programme in 2017. This would be followed by full field or commercial development with the potential for first gas in 2019 or 2020. In addition to the economic, geo-technical and environmental de-risking, we expect over the course of 2017 LCK will need to attract capital to fund both the 2017 pilot programme and full field development.
Exhibit 2: Gas monetisation timeline
|
|
Source: Leigh Creek Energy |
Pre-commercial demonstration in 2017
LCK acquired 18.3 line kilometres of new 2D seismic in early 2016 in order to aid specific site selection for the ISG pre-commercial gas demonstration facility. Drilling has begun for the pilot and three to four months of baseline studies remain. Key objectives include receiving required permitting approvals, successful and safe commissioning and operation within agreed environmental parameters. From an operational perspective, further analysis of ISG gasifier geo-technical parameters, product consistency and quality will aid in the definition of above-ground gas processing requirements. Successful gas demonstration should enable LCK to upgrade an element of its contingent gas resource to reserves according to reserve auditor MHA. LCK expects that this will constitute the majority of its 2C resource.
Demonstration key parameters include:
■
A single well pair and the single ignition of one gasifier.
■
The duration of the test is expected to be between 30 days and 60 days with around 30 days of ‘full capacity’ gasification.
■
LCK expects the cost of the pilot programme to be c A$16m gross, including A$2m for site investigation, A$10m for production wells and surface facilities and A$2m for monitoring wells plus c A$2m for operating costs.
Funding for the upcoming pilot test is yet to be formalised; however, LCK has the option of raising equity capital, farming-down or the use of a short-term debt instrument.
|
Exhibit 3: Leigh Creek appraisal site location |
|
|
Source: Edison Investment Research |
Full field development: Current concepts
From a technical perspective, full field development will be a replication of the demonstration programme described above on a much larger scale (up to 30 well pairs at the outset) and with required process facilities in order to provide pipeline specification gas for either power generation (syngas) or wholesale gas (methane).
For the purposes of our modelling, we use the parameters below for the valuation of LCEP full field development. These parameters are based on industry benchmarks and company guidance.
Exhibit 4: Full field development – key assumptions
Cost well pair (A$m) – 368 wells over field life |
2 |
Life of well pair oxygen blown (years) |
4 |
Life of well pair air blown (years) |
7 |
Gas production air blown (PJ/a) |
1.1 |
Gas production oxygen blown (PJ/a) |
2.2 |
Gas to power conversion (MW/PJ) |
11 |
Opex – Total cost of syngas, air blown (A$/GJ) |
1.0 |
Opex – Total cost of methane, oxygen blown (A$/GJ) |
3.0 |
Source: Edison Investment Research, Leigh Creek Energy
As discussed in the gas offtake options section of this note, LCK has the option of monetising syngas through sale for power generation or with additional upstream facilities as pipeline methane. In our base case, we assume gas is sold for both power generation (450MW plant) and piped export.
Exhibit 5: Utility and pipeline – key assumptions
Power plant cost (A$/kW nominal capacity) |
1,970 |
Power plant O&M costs (US$/kWh-year)* |
13 |
Pipeline cost (A$m/km)* |
1.3 |
Power plant owner IRR (%) |
8.0 |
Pipeline owner IRR (%) |
8.0 |
Syngas sales price (A$/GJ) |
4.48 |
Methane sales price (A$/GJ) |
9 |
LCEP power purchase price (A$/MWh) |
23 |
Power plant cost (A$/kW nominal capacity) |
Power plant O&M costs (US$/kWh-year)* |
Pipeline cost (A$m/km)* |
Power plant owner IRR (%) |
Pipeline owner IRR (%) |
Syngas sales price (A$/GJ) |
Methane sales price (A$/GJ) |
LCEP power purchase price (A$/MWh) |
1,970 |
13 |
1.3 |
8.0 |
8.0 |
4.48 |
9 |
23 |
Source: Edison Investment Research. Note: *Based on US norms (EIA).
Capital costs assumed for the upstream and power component of LCEP are provided below. These are based on industry norms and LCK company guidance.
Exhibit 6: Project capital costs
Gas monetisation routes |
|
|
Power peak (PJ/a) |
32 |
|
Gas export peak (PJ/a) |
80 |
|
Power costs |
|
|
Stage 1: 150MW power plant (A$m) |
335 |
|
Stage 2/3: 300MW + CC (A$m) |
650 |
|
Stage 1 compressors, treatment (A$m) |
60 |
|
Stage 1 other (A$m) |
15 |
|
Stage 2 compressors, treatment (A$m) |
40 |
|
Stage 2 other (A$m) |
15 |
|
Methane gas export capital cost |
|
|
Air separation unit (A$m) |
500 |
|
Gas treatment (A$m) |
800 |
|
Methanator (A$m) |
300 |
|
Other (A$m) |
100 |
|
Conversion efficiency (syngas to methane), % |
|
90% |
Source: Edison Investment Research, Leigh Creek Energy
Development risks and uncertainties
While geological risk is viewed as low given the well-defined LCEP coal resource, we see technical/commercial risks around permitting and the ability to extract gas commercially. These risks are hard to quantify due to the limited number of commercial ISG analogues. In our valuation we have assigned a 20% commercial chance of success for the project in order to quantify risk, however we flag that this is subjective and that a materially higher or lower risk would have a material impact on company valuation. Other than technical risk, we see commercial/partner risk around the provision of a power generation utility and gas pipeline by third parties. Power generation is essential for the operation of LCEP. We also include environmental risk in our assessment of risk as we have seen bans on UCG activity in the State of Queensland and a ban on fracking (not required for UCG) in Victoria and a ban being discussed in the Northern Territory.
In addition to risk, we see several technical uncertainties that could have a material impact on project economics. We highlight key uncertainties below:
■
We see uncertainty relating to the quantity and quality of gas that can be commercially recovered from LCEP. We note MHA has a tight range on P10-P90 gas resource, which is positive; however, we expect to have a better handle on resource range on completion of pilot test work in 2017.
■
The optimal development concept is still to be determined. Options exist for monetising resource through power or pipeline methane.
■
The cost of development of LCEP remains uncertain with estimates currently at the scoping stage.
■
The gas offtake route is still to be determined.
■
Realisable gas prices and electricity prices remain uncertain.
■
The timing of project delivery and first syngas (planned for 2020) is uncertain.
■
There is uncertainty about project uptime and ability to control operational costs and key considerations.
In our base case valuation, we use best estimates for these key parameters based on company guidance and publicly available data.
Timing of first syngas
As described above, we model full field development to deliver first gas in 2020. We flag that this is contingent on LCK accessing finance for the construction of the LCEP as well as third-party construction of a gas power plant/pipeline to provide LCEP with the mid-stream and power components required to monetise the project’s gas resource. Key project components required for delivery of LCEP include:
■
construction and commissioning of syngas-fired power plant and associated pipeline,
■
permitting and drilling of required ISG well inventory and processing facilities, and
■
construction of a methane export pipeline for connection to MAPS.
We note that both mid-stream and power components are likely to be reliant on LCK’s ability to attract project partners or third parties. In this regard, LCK has a signed a heads of agreement with Shanghai Electric Power Generation Group for the establishment of a joint venture power company in South Australia. In order to address the mid-stream, LCK signed a two-year heads of agreement with APA Pipelines in December 2015, to look at the development of conceptual plans for the interconnection of the LCEP with East Coast methane gas markets.
Full field development is likely to consist of three components, in our view, and this is the basis for our LCEP valuation.
1.
Stage 1 power: 16 PJ 150MW power project with first power in 2020, subject to power partner and upstream funding. LCK estimates that the power project will take 24 months to construct.
2.
Stage 2 power: Expansion to 32PJ and 450MW power. Combined cycle generation significantly increases generation efficiency.
3.
Methane export: 80PJ of methane export. Requires syngas to methane conversion facilities and gas pipeline infrastructure.
|
Exhibit 7: Full field development – assumed gas production and well count to 2035* |
|
|
Source: Edison Investment Research. Note: *Valuation based on exploitation of 2P resource base to 2045. |
Gas offtake/monetisation options
Syngas to power – incentivised by SA power prices
High power prices in South Australia (see next section) support the economics of gas to power projects within the state, and the management of LCK see power generation as a key component of the LCEP. In addition, power will be required to support the energy-intensive ISG process.
There are several routes by which gas to power may become part of the wider LCEP. As mentioned above, a heads of agreement with the Shanghai Electric Power Generation Group is considering joint development of a power station in South Australia through a JV company. The structure of this JV is unclear at this point in time, as is the scale of plant to be installed and LCK’s equity in the power generation component of the project. Given these uncertainties, and until we have further clarity on the JV structure, we assume LCK does not have direct equity in the power component of the project but instead benefits from a gas for power agreement whereby LCEP sells gas to the utility and purchases electricity at a discount to market price. We understand that LCK is looking to negotiate an equity position in the associated power project; conclusion of any such negotiations would lead us to update our assumptions.
For the purpose of our analysis, we assume the power provider generates an 8% IRR buying gas from and selling electricity to LCEP as well as into the grid. Typical utility returns in Australia range from 7-10%; however, we include perceived gas supply risks (an investor in the gas powered plant would have to have certainty of the quality and availability of gas supply over the life of plant in order to make the initial capital investment) in our overall project risking of 20%. We assume that a local power project (450MW – staged in 150MW increments) will support the energy needs of LCEP as well as sale of excess generation capacity into the regional grid. Under this scenario, LCEP benefits from power access as well as electricity prices below wholesale.
|
Exhibit 8: Utility power output and pricing assumptions |
|
|
Source: Edison Investment Research |
Methane to pipe – high-margin methane offtake
A further gas monetisation option for LCEP involves processing syngas to pipeline specification methane such that it can be sold in to the Moomba-Adelaide Pipeline (MAPS) 230km away or, alternatively, directly at the Moomba pipeline interconnection, 350km away. This option is likely to require higher upstream processing costs, both opex and capex, as an oxygen plant would be required to achieve pipeline specification methane. We currently assume that produced ISG methane is piped 230km and tied into MAPS.
|
Exhibit 9: LCEP power and gas monetisation options |
|
|
Source: Edison Investment Research, d-maps.com |
As can be seen in the graph below, in our base case we assume the bulk of gas produced is sold into the piped gas market, the remainder of gas produced being used for power generation providing power for the LCEP and for sale into the SA electricity grid. It is possible that LCK pursues a less capital-intensive, modular approach to full field development to reflect funding constraints. Under this scenario we would expect a slight deterioration in project economics relative to our base case, due to the deferral of gas production.
|
Exhibit 10: Gas monetisation by destination |
|
|
Source: Edison Investment Research |
South Australia power and gas markets
Gas markets and pricing
Australia is fortunate enough to hold some of the largest gas deposits in the world. Over the past decade this has led to significant investment in gas liquefaction capacity underpinned by long-term gas offtake contracts. The domestic market is split into two distinct markets: East Coast and West Coast. In recent years, the East Coast gas market has undergone significant change, driven by a tripling of gas demand from the start-up of LNG plants, a decline in low-cost conventional gas sources, and increased volumes sold under short-term contract. This has ultimately meant that domestic East Coast gas prices have converged towards LNG net-back. Gas prices have more than doubled in recent years from A$3.5/GJ to in excess of c A$7.0/GJ.
We expect demand from LNG facilities to support domestic gas prices along the East Coast, while regional short-term price fluctuations continue to be driven by state supply/demand dynamics. At a regional level, Moomba wholesale gas prices have experienced a rapid increase compared to those in Victoria due to its proximity to the Gladstone LNG projects and due to additional transportation costs and pipeline constraints on exporters being able to transport Victoria gas to Gladstone.
We expect South Australian gas prices to trend towards East Coast LNG net-back over time, and currently assume a wholesale price of A$8/GJ real (inflated by 2.5%) equal to A$8.8/GJ at LCEP first gas in 2020; this is marginally higher than the historical correlations between spot LNG and Brent (Edison’s long-term Brent crude price assumption is US$70/bbl real). This slight premium reflects transportation costs to Moomba. We note that the Australian Energy Market Operator (AEMO) forecasts wholesale prices to rise to A$7-8/GJ in its December 2016 national gas forecasting report.
|
Exhibit 11: Australian gas prices remain volatile |
Exhibit 12: Historical spot LNG correlation to Brent |
|
|
|
Source: Edison Investment Research, AER (Commonwealth of Australia) |
Source: Edison Investment Research, Bloomberg |
|
Exhibit 11: Australian gas prices remain volatile |
|
|
Source: Edison Investment Research, AER (Commonwealth of Australia) |
|
Exhibit 12: Historical spot LNG correlation to Brent |
|
|
Source: Edison Investment Research, Bloomberg |
Power markets and pricing
South Australian power prices have been increasingly volatile since 2007 due to concentrated generator ownership, coal plant closures, limited import capability and higher than national average dominance of renewables within the generation mix. In recent months this was compounded with maintenance work on one of two of the Victoria gas interconnectors, the closure of the Port Augusta coal power plant and closure of the Leigh Creek coal mine leading to localised gas and electricity price spikes. The South Australian government has been under pressure to increase gas and electricity connectivity, diversify the energy supply mix and add storage capacity in order to reduce price volatility and restore reliability. In 2014-15, wholesale prices in South Australia were on average A$10/MWh higher than in neighbouring Victoria and the state recorded 82 price events above A$200/MWh. A combination of plant shut-downs (Pelican Point and Alinta’s Playford B plant) and a trip at the Heywood interconnector led to multiple blackouts at the end of 2015 and on one occasion a price spike to in excess of A$9,000/MWh.
|
Exhibit 13: Q1 daily contract prices 2014-17 |
Exhibit 14: Average electricity price futures |
|
|
|
Source: Edison Investment Research, AER (Commonwealth of Australia) |
Source: Leigh Creek Energy |
|
Exhibit 13: Q1 daily contract prices 2014-17 |
|
|
Source: Edison Investment Research, AER (Commonwealth of Australia) |
|
Exhibit 14: Average electricity price futures |
|
|
Source: Leigh Creek Energy |
The Australian Energy Market Operator (AEMO) projects that in the absence of new investment, plant withdrawals may result in supply shortfalls that breach the reliability standard by 2019-20 in South Australia. LCK recognises the opportunity to fill this supply gap with a new gas-fired power plant close to LCEP; we assume a 450MW plant in our base case valuation. It is worth noting that there are several potential supply developments in South Australia, with the focus largely on wind farm proposals including Ceres (670MW), Woakwine (400MW), Palmer (309MW) and Kongorong (240MW).
|
Exhibit 15: Surplus generation capacity – moving to deficit in SA |
|
|
Source: AER (Commonwealth of Australia) |
Despite a concerted effort to move towards clean energy sources such as wind and solar, gas is likely to remain a key component of the energy supply mix in South Australia. Gas offers generators the ability to react to supply and demand volatility. On the supply side, wind and solar power supply remain intermittent (non-base load) and interconnector outages have a significant and immediate impact on supply. A blackout that affected over 1.6 million people in South Australia on 28 September 2016 serves as a continual reminder of the vulnerability of the state’s power network. An improved supply mix is likely to be required in order to increase security of supply and reduce price volatility.
|
Exhibit 16: Wind as % of regional output |
|
|
Source: AER (Commonwealth of Australia) |
LCEP targeting both gas and power
LCK sees a significant opportunity in the SA gas powered generation market to provide baseload and peaking power to industrial customers and the electricity grid. In our base estimates, we have assumed that gas prices remain at a discount to LNG netbacks and trend upwards in line with Edison oil price forecasts. We assume average wholesale electricity prices just below current spot levels (A$80/MWh) inflated by 2.5% per annum. As there is some uncertainty over realised gas and electricity prices over the LCEP asset life, we provide sensitivities to these assumptions in the valuation section of this note.
Management
Justyn Peters – executive chairman
Justyn joined Leigh Creek Energy as non-executive director on 28 November 2014 and was appointed executive chairman on 27 May 2015. Justyn is a qualified lawyer and has many years’ experience in the ISG industry and in senior management positions. He has had over a decade of experience with investing entities based offshore, and in particular in China, investing directly into Australian mining, energy and infrastructure projects, and brings with him extensive experience in deal structuring and long dated contacts. Justyn has worked in the mining industry for industry representative bodies and for various state and federal environment departments and authorities. Justyn is a director and shareholder of Allied Resource Partners Pty (ARP), which is a substantial shareholder of Leigh Creek Energy.
Phil Staveley – CEO
Phil is a qualified accountant with 30 years’ experience working in the resources sector. He started his career in the oil and gas sector working for Schlumberger in London, followed by a number of years with SAGASCO and SAOG (a South Australian oil and gas company). After a number of years in that sector he moved to the mining sector, spending almost 10 years with Normandy Mining. While with Normandy he fulfilled a number of planning, finance, M&A and commercial roles, including the establishment of a group supply function and three years based in Rio de Janeiro as the CFO of TVX Normandy Americas.
Justin Haines – COO
Justin has postgraduate qualifications in geology and mining engineering, and broad experience across engineering and geological services for multiple commodities including coal, iron ore and uranium. Most recently, he worked as technical manager for Carbon Energy, an ISG technology developer that successfully operated its demonstration facility in Queensland under the direction of the Queensland Government’s UCG trial policy. In the COO role, he will be responsible for all technical and operational aspects of the development of the Leigh Creek Energy Project through to commercial production.
Mark Terry – chief finance officer
Mark is a CPA with more than 20 years’ experience in the management of financial and project matters in the mineral exploration and mining industry. He commenced his career with KPMG before holding a range of senior finance positions with Normandy Mining, Newmont Australia and Xstrata Zinc, where he was finance and commercial manager for Australian operations. More recently, Mr Terry held the role of CFO of Terramin Australia (an operating junior miner) before providing consulting services in senior finance and project roles with Havilah Resources and Rex Minerals. Mark has broad experience in corporate treasury, mergers and acquisitions, resource project evaluation and project management, accounting, tax and general management roles. In the CFO role, Mark is responsible for all finance, IT and commercial facets of the business.
Valuation
To value LCK, we first value the LCEP on a gross unfunded basis, following which we apply a corporate overlay to take into account head office costs, the balance sheet position and immediate capital needs. Next we take into consideration funding requirements. Clearly, LCK requires funding to progress its working interest in LCEP through to first syngas; we assume LCK farms down its project equity in return for a cost carry, essentially releasing project equity in return for funding. In line with our wider oil and gas coverage, the final step of our valuation process involves applying a project risking to reflect technical risks (potential for project to be sub-commercial), partner risks and funding risks. Here we apply a 20% chance of success (COS), although we recognise that this is subjective and provide sensitivities to this risking later in this section.
|
Exhibit 17: Valuation overview |
|
|
Source: Edison Investment Research |

Step 1: Gross unfunded, unrisked LCEP valuation
Our valuation is based on LCK selling syngas to a local power generator and methane for pipeline export, as shown in Exhibit 18. Under this development scenario, we assume syngas is sold under long-term contract to a utility, which in turn generates electricity for sale back to LCK; and the utility also sells electricity into the SA power grid. Our base assumption is that the power utility generates an 8% IRR, buying gas and selling electricity to LCEP and to the wholesale market. We recognise that our assumed return of 8% is in line with that typically expected of an Australian utility (typically 7-10%); however, a premium may be required as there are currently no commercial ISG analogues to LCEP in Australia, or in fact globally. We reflect the risk of LCK not being able to attract a power partner in our overall project chance of success of 20%.
|
Exhibit 18: LCEP gas sales/electricity purchase flow diagram |
|
|
Source: Edison Investment Research |
Gross project valuation sensitivities
Gross project economics remain sensitive to realised gas prices for power and piped gas. We assume prices of A$4.48/GJ for syngas and A$8.0/GJ for methane sales inflated by 2.5% in our base case, as discussed earlier in this note. The sensitivity analysis in Exhibit 19 shows that realised methane and power price assumptions have a material impact on project IRR (base case IRR 26%).
|
Exhibit 19: Project IRR sensitivity |
|
|
Source: Edison Investment Research |
Equally, gross project NPV is sensitive to realised price assumptions for methane and power, as shown below.
|
Exhibit 20: LCK gross project NPV sensitivity |
|
|
Source: Edison Investment Research |
Our analysis suggests that LCEP is NPV12.5 positive if power prices are above A$50/MWh and methane prices above A$6/GJ. As can be seen by the gross project NPVs in the table below, LCEP is highly levered to realised power and methane prices.
Exhibit 21: Gross project NPV sensitivity to SA power prices and realised methane price
Power A$/MWh |
Methane price A$/GJ |
|||||
5.0 |
6.0 |
7.0 |
8.0 |
9.0 |
10.0 |
|
60 |
-193 |
58 |
310 |
561 |
812 |
1064 |
70 |
-126 |
126 |
377 |
628 |
880 |
1131 |
80 |
-58 |
193 |
444 |
696 |
947 |
1198 |
90 |
9 |
260 |
512 |
763 |
1014 |
1266 |
100 |
76 |
328 |
579 |
830 |
1082 |
1333 |
110 |
144 |
395 |
646 |
898 |
1149 |
1400 |
Source: Edison Investment Research
Gross project sensitivity to assumed LCK WACC and realised methane price is provided in the table below.
Exhibit 22: Gross project NPV sensitivity to WACC % and realised methane price A$/GJ
WACC (%) |
Methane price A$/GJ |
|||||
5.0 |
6.0 |
7.0 |
8.0 |
9.0 |
10.0 |
|
10 |
79 |
440 |
801 |
1161 |
1522 |
1883 |
11 |
13 |
324 |
635 |
946 |
1257 |
1568 |
12 |
-38 |
232 |
501 |
771 |
1040 |
1310 |
13 |
-76 |
158 |
393 |
628 |
862 |
1097 |
14 |
-105 |
100 |
305 |
510 |
715 |
920 |
15 |
-126 |
54 |
233 |
413 |
593 |
772 |
Source: Edison Investment Research
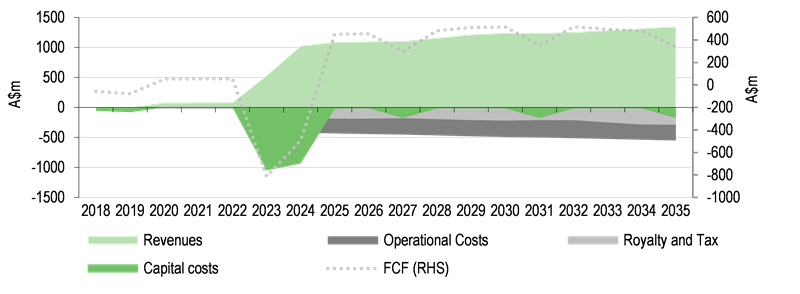
Looking at projected cash flows over the project life, we see positive FCF from first syngas in 2020 rising to a peak of c A$515m pa once methane is being exported at full capacity in 2030.
|
Exhibit 23: Gross project cash flows (absolute values) and FCF over time (A$m) |
|
|
Source: Edison Investment Research |
Step 2: LCEP funding requirements
If LCK were to fund total upstream costs of an estimated A$2,568m (life of field), we expect the company to look at raising capital through a combination of debt, equity and farm-down. State funding, for what can be viewed as a strategic project in the context of SA, is a possibility. In our view, the most likely source of funding is through a strategic partner backwards-integrating into the upstream project, providing funding in exchange for project equity.
We assume the upstream component of LCEP is farmed out to an incoming company requiring a 17.5% return on investment. In this scenario, LCK receives a development carry through to first gas in return for a working interest in the project, which drops from 100% to a net 33%.
|
Exhibit 24: Farm-out of LCEP upstream (farminee 17.5% IRR) |
|
|
Source: Edison Investment Research |
Post farm-down, our LCK valuation is diluted from A$2.59/share to A$1.66/share. We note that this does not account for technical, partner or funding risks, which we discuss in step three below.
Step 3: Edison base case – fully funded and risked valuation
Edison’s base case valuation is on the basis of a fully funded project and encompasses the risk of the project not progressing. Our assumption of risk encompasses technical risk (potential for sub-commercial operation as no in-country commercial analogues exist); the risk of not being able to find a power plant partner; the risk of not being able to find a pipeline partner; and the risk of not getting environmental permits. We do not include geological risk in this evaluation as the LCEP coal resource is well-defined. Our view on risk is subjective and investors may have their own view on the risks associated with LCEP; we therefore provide a valuation sensitivity to COS below. The market is currently implying a c 10% COS.
Our post farm-down or ‘diluted’ risked valuation is provided in the table below, which we feel best reflects our view of the current value of LCK ahead of gas demonstration and full field development funding.
Exhibit 25: LCK valuation – farm-out of upstream – base case
Asset |
Country |
Diluted WI |
CoS |
Recoverable reserves |
NPV/GJ |
Net risked |
Value per share |
Discount rate |
|||
Gross |
Net |
value |
Risked |
10% |
15% |
||||||
% |
% |
PJ |
PJ |
A$/GJ |
A$m |
A$/share |
A$/share |
A$/share |
|||
Net cash at end June 2016 |
100% |
100% |
9 |
0.03 |
0.03 |
0.03 |
|||||
SG&A – NPV10 of two years |
100% |
100% |
(7) |
(0.03) |
(0.02) |
(0.02) |
|||||
2017 gas demo (after tax rebate) |
100% |
100% |
(9) |
(0.03) |
(0.03) |
(0.03) |
|||||
Development |
|||||||||||
LCEP |
Australia |
33% |
20% |
2,978.6 |
1,072.3 |
0.46* |
90 |
0.34 |
0.49 |
0.24 |
|
Core NAV |
|
|
|
|
|
|
83 |
0.31 |
0.46 |
0.21 |
|
RENAV |
|
|
|
|
|
|
83 |
0.31 |
0.46 |
0.21 |
|
Source: Edison Investment Research. Note: *Derived from LCEP DCF valuation including positive value impact of cost carry.
As discussed above, we provide a sensitivity to commercial chance of success below.
|
Exhibit 26: RENAV sensitivity to commercial chance of success % (post farm-down) |
|
|
Source: Edison Investment Research |
In addition, we recognise that there will be several phases of de-risking as the LCEP project progresses through successful pilot, full appraisal, environmental permitting, full field development funding and partner alignment. We attempt to demonstrate this de-risking and the potential impact on valuation in the diagram below.
|
Exhibit 27: Potential de-risking impacts on RENAV (post farm-down) |
|
|
Source: Edison Investment Research |
At the current share price, LCK offers investors option value on ISG in South Australia. LCEP has what appears to be an optimal site for an ISG project in a state with a need for additional baseload power capacity. The project does not come without technical and commercial risks; however, we expect technical and environmental aspects to be materially de-risked through the company’s upcoming pilot programme in 2017. We expect this pilot programme to be funded through a combination of short-term debt (possibly secured on R&D tax credits) and equity.
Key investment risks and sensitivities
Key investment risks are highlighted below:
■
Valuation is contingent on third parties investing in power and/or pipeline infrastructure.
■
LCK requires funding for the completion of a pilot project in 2017 and for full field development (we assume a cost carry for full field development in our base case, but this cannot be guaranteed).
■
Commodity prices of both gas and electricity could vary materially from our base case forecasts; please see sensitivities in the valuation section of this note.
■
ISG remains a relatively unproven commercial technology, and the only global commercial-scale ISG operation is in Uzbekistan. Little in the way of data is available on the economics of this operation.
■
Environmental risks will have to be mitigated through technology and meeting regulatory requirements set by the state of SA.
■
Fiscal terms may vary from our base case forecasts. However, material changes to petroleum sector fiscal terms in SA are rare.
Financials
In the short term, funding for LCK’s upcoming pilot work programme remains key. The net cost including operational spend is estimated at c A$16m and is expected to be funded through a combination of debt and equity (for the purpose of our model we assume debt). LCK will likely be able to attract debt from factoring providers secured on the company’s R&D tax credit receivable. In addition to this, LCK has the potential to leverage project partners with which it has existing relationships in order to provide short-term funding.
Our LCK financial forecasts do not reflect LCEP first gas until our modelled start-up date of early 2020. In our base case forecasts below we assume LCK is cost-carried for its portion of LCEP capex costs prior to first gas, hence there is minimal capex beyond 2018 in our financial forecasts.
Exhibit 7: Financial summary
|
|
A$m |
2014 |
2015 |
2016 |
2017e |
2018e |
2019e |
2020e |
2021e |
2022e |
June |
|
|
IFRS |
IFRS |
IFRS |
IFRS |
IFRS |
IFRS |
IFRS |
IFRS |
IFRS |
PROFIT & LOSS |
|||||||||||
Revenue |
|
|
0.0 |
0.0 |
0.0 |
0.0 |
0.0 |
0.0 |
25.0 |
25.7 |
26.3 |
Cost of Sales |
0.0 |
0.0 |
0.0 |
0.0 |
0.0 |
0.0 |
(2.3) |
(2.3) |
(2.4) |
||
Gross Profit |
0.0 |
0.0 |
0.0 |
0.0 |
0.0 |
0.0 |
22.8 |
23.3 |
23.9 |
||
EBITDA |
|
|
0.0 |
(17.6) |
(5.4) |
(3.0) |
(3.0) |
(3.0) |
19.8 |
20.3 |
20.9 |
Operating Profit (before amort. and except.) |
0.0 |
(17.7) |
(5.4) |
(3.0) |
(3.0) |
(3.0) |
19.8 |
20.3 |
20.9 |
||
Intangible Amortisation |
0.0 |
0.0 |
0.0 |
0.0 |
0.0 |
0.0 |
0.0 |
0.0 |
0.0 |
||
Exceptionals |
0.0 |
0.0 |
0.0 |
0.0 |
0.0 |
0.0 |
0.0 |
0.0 |
0.0 |
||
Other |
0.0 |
0.0 |
0.0 |
0.0 |
0.0 |
0.0 |
0.0 |
0.0 |
0.0 |
||
Operating Profit |
0.0 |
(17.7) |
(5.4) |
(3.0) |
(3.0) |
(3.0) |
19.8 |
20.3 |
20.9 |
||
Net Interest |
0.0 |
(0.0) |
(0.0) |
0.1 |
(0.7) |
(0.5) |
(0.7) |
0.0 |
0.2 |
||
Profit Before Tax (norm) |
0.0 |
(17.7) |
(5.4) |
(2.9) |
(3.7) |
(3.5) |
19.0 |
20.4 |
21.1 |
||
Profit Before Tax (FRS 3) |
0.0 |
(17.7) |
(5.4) |
(2.9) |
(3.7) |
(3.5) |
19.0 |
20.4 |
21.1 |
||
Tax |
0.0 |
0.0 |
0.0 |
0.8 |
7.2**** |
0.0 |
(5.5) |
(5.7) |
(5.8) |
||
Profit After Tax (norm) |
0.0 |
(17.7) |
(5.4) |
(2.1) |
3.5 |
(3.5) |
13.5 |
14.7 |
15.3 |
||
Profit After Tax (FRS 3) |
0.0 |
(17.7) |
(5.4) |
(2.1) |
3.5 |
(3.5) |
13.5 |
14.7 |
15.3 |
||
Average Number of Shares Outstanding (m) |
0.0 |
0.0 |
266.0 |
266.0 |
266.0 |
266.0 |
266.0 |
266.0 |
266.0 |
||
Dividend per share (p) |
0.0 |
0.0 |
0.0 |
0.0 |
0.0 |
0.0 |
0.0 |
0.0 |
0.0 |
||
BALANCE SHEET |
|||||||||||
Fixed Assets |
|
0.0 |
0.8 |
2.6 |
18.6 |
18.6 |
18.6 |
18.6 |
18.6 |
18.6 |
|
Intangible Assets |
0.0 |
0.7 |
2.5 |
2.5 |
2.5 |
2.5 |
2.5 |
2.5 |
2.5 |
||
Tangible Assets |
0.0 |
0.1 |
0.1 |
16.1 |
16.1 |
16.1 |
16.1 |
16.1 |
16.1 |
||
Investments |
0.0 |
0.0 |
0.0 |
0.0 |
0.0 |
0.0 |
0.0 |
0.0 |
0.0 |
||
Current Assets |
|
0.0 |
1.6 |
9.0 |
0.4 |
0.4 |
0.4 |
4.8 |
19.6 |
35.0 |
|
Stocks |
0.0 |
0.0 |
0.0 |
0.0 |
0.0 |
0.0 |
0.0 |
0.0 |
0.0 |
||
Debtors |
0.0 |
0.1 |
0.3 |
0.3 |
0.3 |
0.3 |
0.3 |
0.3 |
0.3 |
||
Cash |
0.0 |
1.5 |
8.7 |
0.0 |
0.0 |
0.0 |
4.4 |
19.2 |
34.6 |
||
Other |
0.0 |
0.0 |
0.0 |
0.0 |
0.0 |
0.0 |
0.0 |
0.0 |
0.0 |
||
Current Liabilities |
|
0.0 |
(0.5) |
(0.8) |
(0.8) |
(0.8) |
(0.8) |
(0.8) |
(0.8) |
(0.8) |
|
Creditors |
0.0 |
(0.4) |
(0.8) |
(0.8) |
(0.8) |
(0.8) |
(0.8) |
(0.8) |
(0.8) |
||
Short term borrowings |
0.0 |
(0.1) |
0.0 |
0.0 |
0.0 |
0.0 |
0.0 |
0.0 |
0.0 |
||
Long Term Liabilities |
|
0.0 |
0.0 |
0.0 |
(9.4) |
(5.8) |
(9.2) |
0.0 |
0.0 |
0.0 |
|
Long term borrowings |
0.0 |
0.0 |
0.0 |
(9.4)** |
(5.8) |
(9.2) |
0.0 |
0.0 |
0.0 |
||
Other long term liabilities |
0.0 |
0.0 |
0.0 |
0.0 |
0.0 |
0.0 |
0.0 |
0.0 |
0.0 |
||
Net Assets |
|
|
0.0 |
1.9 |
10.8 |
8.8 |
12.3 |
8.9 |
22.6 |
37.4 |
52.7 |
CASH FLOW |
|||||||||||
Operating Cash Flow |
|
0.0 |
(0.9) |
(4.0) |
(2.0) |
3.5 |
(3.4) |
13.6 |
14.8 |
15.4 |
|
Net Interest |
0.0 |
0.0 |
0.0 |
0.0 |
0.0 |
0.0 |
0.0 |
0.0 |
0.0 |
||
Tax |
0.0 |
0.0 |
0.0 |
0.0 |
0.0 |
0.0 |
0.0 |
0.0 |
0.0 |
||
Capex |
0.0 |
(1.2) |
(1.8) |
(16.0)* |
0.0*** |
0.0 |
0.0 |
0.0 |
0.0 |
||
Acquisitions/disposals |
0.0 |
0.0 |
0.0 |
0.0 |
0.0 |
0.0 |
0.0 |
0.0 |
0.0 |
||
Financing |
0.0 |
3.5 |
13.1 |
0.0 |
0.0 |
0.0 |
0.0 |
0.0 |
0.0 |
||
Dividends |
0.0 |
0.0 |
0.0 |
0.0 |
0.0 |
0.0 |
0.0 |
0.0 |
0.0 |
||
Net Cash Flow |
0.0 |
1.4 |
7.3 |
(18.0) |
3.5 |
(3.4) |
13.6 |
14.8 |
15.4 |
||
Opening net debt/(cash) |
0.0 |
0.0 |
(1.4) |
(8.7) |
9.4 |
5.8 |
9.2 |
(4.4) |
(19.2) |
||
HP finance leases initiated |
0.0 |
0.0 |
0.0 |
0.0 |
0.0 |
0.0 |
0.0 |
0.0 |
0.0 |
||
Other |
0.0 |
0.0 |
0.0 |
0.0 |
0.0 |
0.0 |
0.0 |
(0.0) |
0.0 |
||
Closing net debt/(cash) |
|
0.0 |
(1.4) |
(8.7) |
9.4 |
5.8 |
9.2 |
(4.4) |
(19.2) |
(34.6) |
|
Source: Edison Investment Research, Leigh Creek Energy. Note: *Likely funded through short-term debt and/or equity. **Assumes debt funding. ***Capex beyond 2018 funded through assumed farm-down. ****R&D tax rebate.
|
|||||||||||||||||||||||||||||||||||||||||||||||
|
|