Jupiter US Smaller Companies
Written by
Jupiter US Smaller Companies |
Small-cap growth with value discipline |
Investment trusts |
6 June 2016 |
Initiation of coverage |
Share price/discount performance
Three-year cumulative perf. graph
Gearing
Analysts
|
|||||||||||||||||||||||||||||||||||||||||||||||||||||||||||||||||||||||||||||
Jupiter US Smaller Companies (JUS) is a specialist small- and mid-cap fund focused on the US market. It has been managed since 2001 by Robert Siddles (as F&C US Smaller Companies until both manager and trust transferred to Jupiter Asset Management in early 2014). The manager has a strong valuation focus and seeks to invest in companies that have a good franchise, significant inside ownership, high free cash flow, pricing power and at least 50% share price upside. While US market performance has been led by large-cap and growth stocks in recent years, JUS has a solid long-term track record (annualised returns of c 7-8% over 10 years in both share price and NAV terms) and proven defensive characteristics in volatile markets.
12 months ending |
Share price |
NAV |
Russell 2000 Index (%) |
S&P 500 Index (%) |
FTSE All-Share Index (%) |
30/04/12 |
4.3 |
0.9 |
(3.0) |
7.6 |
(2.0) |
30/04/13 |
36.9 |
27.8 |
21.0 |
22.0 |
17.8 |
30/04/14 |
(2.8) |
12.3 |
9.6 |
11.0 |
10.5 |
30/04/15 |
3.7 |
9.7 |
19.0 |
24.1 |
7.5 |
30/04/16 |
1.2 |
(0.5) |
(2.8) |
6.2 |
(5.7) |
Source: Thomson Datastream. Note: Total returns (capital return for Russell 2000) in sterling.
Investment strategy: Long term and risk aware
JUS manager Robert Siddles follows a three-stage investment process, first screening for price weakness to whittle down the large (c 3,000 stocks) US small- and mid-cap universe. A five-point ‘good company test’ aims to identify stocks with low business risk and where the manager calculates at least 50% share price upside; stocks must pass all five tests for consideration. Siddles then builds detailed models on candidate stocks before making a final investment decision. The portfolio of c 50 stocks features a core of long-term ‘Buffett compounders’ as well as turnaround stocks held with a view to achieving recovery over two to three years.
Market outlook: Cautious optimism on small-cap value
Having underperformed the broad US smaller company market for some time, and particularly over the past two years, signs are beginning to emerge of a recovery in US value stocks, as measured by the Russell 2000 Value Index. With US industrial confidence improving, unemployment falling, a weaker dollar and interest rates still barely above zero, the outlook is relatively favourable, although investor confidence remains fragile against a backdrop of low global growth and geopolitical concerns.
Valuation: Scope for discount to narrow
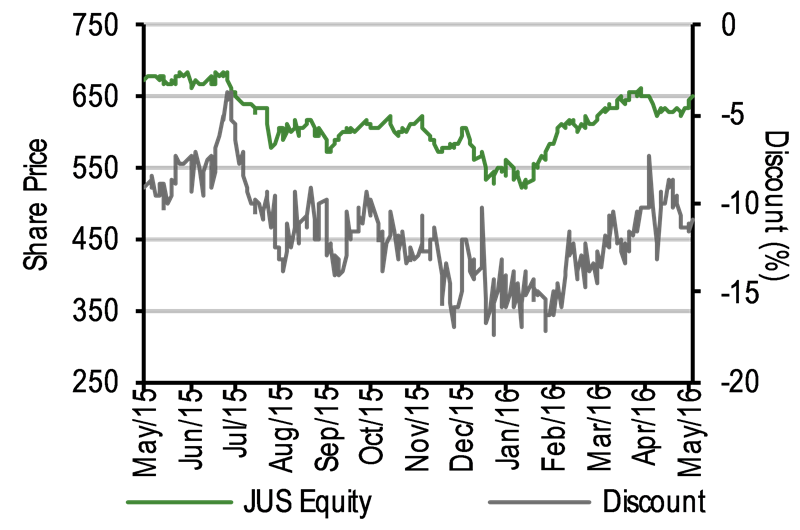
At 2 June, JUS’s shares were trading at a 10.9% discount to cum-income net asset value. While wider than long-term averages, this is a little narrower than the 11.6% average over 12 months, reflecting a period in which value stocks have been less favoured by investors. Share buybacks since the end of 2015 have helped to keep the discount broadly below the target maximum of 10%, and there is scope for it to narrow further (the five-year average is 3.8%) should early signs of style rotation continue.
Exhibit 1: Trust at a glance
Investment objective and fund background |
Recent developments |
||||||||||||||||||||||||||||||||||||||||||||||||||||||||||||||||||||||
Jupiter US Smaller Companies’ objective is to achieve long-term capital growth by investing in a diversified portfolio of quoted US smaller and medium-sized companies. It uses the Russell 2000 Index (capital return, sterling adjusted) as a performance benchmark. |
■ 26 February 2016: Results for the half-year ended 31 December. NAV -4.5% compared with -3.3% for the Russell 2000 Index (sterling adjusted). Share price return -8.2%. ■ 18 November 2015: All AGM resolutions passed. |
||||||||||||||||||||||||||||||||||||||||||||||||||||||||||||||||||||||
Forthcoming |
Capital structure |
Fund details |
|||||||||||||||||||||||||||||||||||||||||||||||||||||||||||||||||||||
AGM |
November 2016 |
Ongoing charges |
1.01% (at 30 June 2015) |
Group |
Jupiter Unit Trust Managers |
||||||||||||||||||||||||||||||||||||||||||||||||||||||||||||||||||
Annual results |
September 2016 |
Net cash |
5.7% |
Manager |
Robert Siddles |
||||||||||||||||||||||||||||||||||||||||||||||||||||||||||||||||||
Year end |
30 June |
Annual mgmt fee |
0.8% |
Address |
The Zig Zag Building, 70 Victoria St, London, SW1E 6SQ |
||||||||||||||||||||||||||||||||||||||||||||||||||||||||||||||||||
Dividend paid |
N/A |
Performance fee |
Yes, see page 11 |
||||||||||||||||||||||||||||||||||||||||||||||||||||||||||||||||||||
Launch date |
10 March 1993 |
Trust life |
Indefinite |
Phone |
020 3817 1000 |
||||||||||||||||||||||||||||||||||||||||||||||||||||||||||||||||||
Continuation vote |
Three-yearly, next 2017 |
Loan facilities |
None |
Website |
www.jupiteram.com/JUS |
||||||||||||||||||||||||||||||||||||||||||||||||||||||||||||||||||
Portfolio exposure by sector (as at 30 April 2016) |
Share buyback policy and history |
||||||||||||||||||||||||||||||||||||||||||||||||||||||||||||||||||||||
|
JUS has the authority to allot up to 10% and buy back up to 14.99% of shares to manage a premium or a discount. Buybacks are employed with the aim of maintaining the discount at a maximum of c 10%.
|
||||||||||||||||||||||||||||||||||||||||||||||||||||||||||||||||||||||
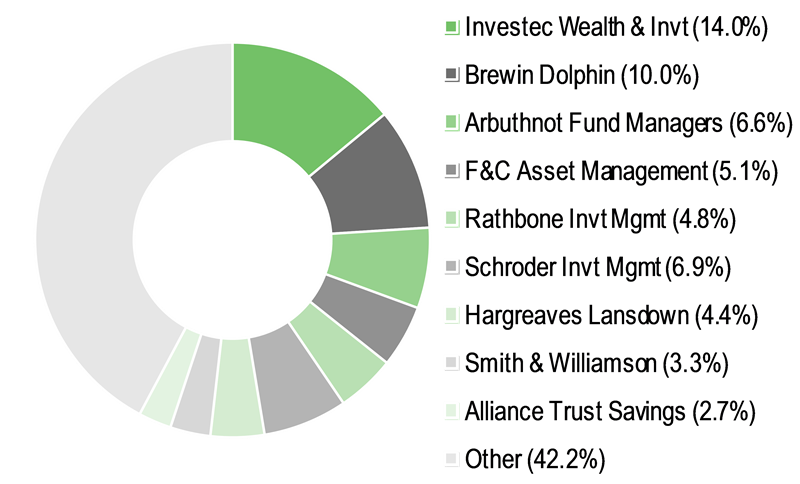
Shareholder base (as at 22 April 2016) |
Portfolio exposure by market cap (31 December 2015) adjusted for cash |
||||||||||||||||||||||||||||||||||||||||||||||||||||||||||||||||||||||
|
|
||||||||||||||||||||||||||||||||||||||||||||||||||||||||||||||||||||||
Top 10 holdings (as at 30 April 2016) |
|||||||||||||||||||||||||||||||||||||||||||||||||||||||||||||||||||||||
|
|||||||||||||||||||||||||||||||||||||||||||||||||||||||||||||||||||||||
Source: Jupiter US Smaller Companies, Edison Investment Research, Morningstar, Thomson, Bloomberg. Note: *N/A where not in the April 2015 top 10.
Market outlook: Time for a value recovery?
Global stock markets had a jittery start to 2016, with fund flows hit by investor concerns over US monetary policy, growth in China and emerging markets and various geopolitical issues. However, more recently an uptick in US industrial confidence and a weaker US dollar have seen some confidence return to markets. In the US smaller company sector, value stocks have underperformed the large-cap market for some time, a trend that has accelerated over the past two years (Exhibit 2, left-hand chart). This has now begun to reverse, and the value index has outperformed over the past one, three, six and 12 months, perhaps suggesting the cycle has begun to turn. Looking at valuations (Exhibit 2, right-hand chart), the Russell 2000 Value Index offers a lower average P/E and price to book value than either the broad small-cap market (as measured by the Russell 2000) or the large-cap S&P 500, with a higher dividend yield. This suggests the potential for higher returns, particularly if the style rotation continues.
|
Exhibit 2: Market valuation and performance |
|
S&P 500 and Russell 2000 Value performance over five years |
Valuation metrics for S&P 500, Russell 2000 and Russell 2000 Value |
|
|
|
Source: Thomson Datastream, Edison Investment Research, FTSE Russell, S&P Dow Jones. Note: *P/E is trailing and excludes negative earnings. Valuation data at 30 April. |
|
Buffett, Graham and value investing
Two of the biggest names in value investing are Benjamin Graham and Warren Buffett. Graham (1894-1976) is considered one of the first investors to adopt a value approach, a system that he developed and refined (with David Dodd) into a book, Security Analysis, published in 1934. Written in the wake of the Wall Street crash of 1929, Graham and Dodd advocated an approach to investing that focused on assessing the underlying value of a business, rather than extrapolating share price and earnings trends into the future. They noted the tendency of the market as a whole to ignore the underlying value of out-of-favour businesses. In this and a later work, The Intelligent Investor, Graham advised investors to view themselves as part-owners of the businesses they invested in, drawing a distinction between ‘investment’ and ‘speculation’. By taking the time to gain a proper understanding of the value of a business, investors should be able to spot when a company’s shares were materially undervalued, affording them a ‘margin of safety’ as eventually the wider market would catch on and the shares would re-rate.
Warren Buffett, the billionaire chairman and CEO of US holding company Berkshire Hathaway, is seen as one of Graham’s leading disciples. He is renowned for his ultra-long-term approach to investing, summarised as ‘buy great stocks and hold them forever’.
The pure value approach of Graham, which could see stocks sold as they reach fair value, and the long-term compounding approach of Buffett are two key planks of JUS manager Robert Siddles’s investment approach.
Fund profile: Risk-aware US small-cap specialist
JUS began life in 1993 as F&C US Smaller Companies, changing its name in 2014 when the board transferred management to Jupiter Asset Management following the move by longstanding portfolio manager Robert Siddles from F&C Asset Management to Jupiter. The trust seeks to achieve long-term capital growth by investing in smaller and mid-sized companies in the US. Because the US economy and stock market are so much larger than those of the UK, the mid-cap segment goes up as far as $25bn; however, the manager’s primary focus is on the smaller end of the market and 58% of the portfolio is in sub-$2bn companies. Following a broadly value-oriented style, Siddles seeks to balance stocks that can grow and compound returns over the long term with shorter-term (two to three years) holdings in turnaround/recovery stocks. The investment approach is risk aware and the manager says his primary focus is on not losing money for investors. JUS focuses on capital growth and does not pay dividends; it also does not use gearing, seeing this as an unnecessary risk given the volatility of the asset class.
The fund manager: Robert Siddles
The manager’s view: Small-cap value recovery on the horizon
While valuation is an important part of the JUS investment process (see below), manager Robert Siddles notes that he is not a ‘down and dirty’ value investor; investors primarily choose the trust as a means of accessing the long-term capital growth potential of US small and mid caps. As such he is focused on finding growth as well as value, and in particular on finding a margin of safety in valuations, to avoid value traps. He says he takes a value approach to try to beat the Russell 2000 Index benchmark, rather than as an article of faith.
The manager says value investing has historically yielded good returns for US investors, but in the past 10 years the Russell 2000 Value Index has consistently lagged the Russell 2000 as a whole. Siddles attributes this to three ‘icebergs of debt’ that have frozen the global economy: first the US housing market collapse that triggered the global financial crisis, then European sovereign debt, and more recently fears over emerging market debt. He notes that investors buy value stocks when they have confidence in recovery, which has recently been in short supply. However, the weaker US dollar has taken some of the pressure off emerging markets with dollar-denominated debt and sentiment is starting to improve, which should benefit the global economy and value investors alike.
Similarly, small caps have underperformed large caps in recent years as fearful investors sought the relative safety of larger stocks. Siddles says the move into large caps since the summer of 2014 has been on a par with the early stages of the great recession, but there are now signs of economic improvement – such as an uptick in the ISM manufacturing index and a fall in US unemployment – that should lead to better performance for the more economically sensitive small-cap sector. Siddles’s risk-aware process means he is most focused on areas of the market where he feels business risk is lowest. This includes areas such as insurance, in particular specialist underwriters. Their disciplined approach to profitable underwriting means they can potentially grow their book value year-on-year; the manager says the key is to buy them when they are trading below book value.
Distribution and transportation are also favoured areas, with Siddles focusing on dominant regional players that can scale up by buying smaller competitors. He also likes good custodians of capital, where the franchise comes from the management’s skill at investing the company’s resources. An example of this is third-largest holding Roper Technologies, which has been in the portfolio since 2001; the manager says his only mistake with regard to Roper “is that I ever sold a single share”.
With regard to the forthcoming US election, the manager says that most of the time politics is confined within the beltway of Washington DC and it is business that actually runs America. But Americans are increasingly worried about downward pressure on wages and upward pressure on house prices (as a result of high demand sparked by ultra-loose monetary policy), which are squeezing the middle class and increasing the appeal of more extreme presidential candidates. However, Siddles sees the impact on equity markets as limited (with the exception of biotech stocks, an area he tends to avoid).
A greater source of frustration is the impact of M&A activity, which has taken out some of the core ‘compounders’ from the portfolio. While takeover bids will usually result in significant price upside, this comes with the attendant loss of future growth potential. In addition to IPC Healthcare (see case study 1), two banks (C1 Financial and Monarch Financial) have also been taken over in the past year, although in one case Siddles plans to retain an investment in the acquirer.
Asset allocation
Investment process: Assess risks to avoid downside
JUS manager Robert Siddles uses a disciplined investment process to sift the universe of c 3,000 US stocks with a market capitalisation between $100m and $5bn. He describes it as a value approach that is bottom-up driven and high conviction with a focused portfolio of c 50 stocks, which is more concentrated than the majority of US small-cap portfolios. The objective is to achieve long-term growth while limiting downside risk.
Broadly there are three stages to the process. The first is the use of quantitative screens to identify stocks that have experienced a period of price weakness, either short or long term. The second and most important stage is risk assessment, looking at style, industry and company-specific factors with the aim of avoiding value traps. The third stage focuses on company analysis; relatively few stocks make it through the first two screens to this stage and Siddles says the trust’s low turnover (average of 38.5% over the past five years, implying a holding period of two years and seven months) means he needs to analyse relatively few new stocks in depth (c 12-20 per year).
When risk assessing the stocks that make it through the initial price screen, the manager admits to certain industry biases. In general he will avoid technology, where there is business risk and valuations are high (although he favours users of technology and software); biotechnology, where few small companies have earnings and outcomes are often binary; fashion, which is hard to predict; and restaurants, where business models are easy to replicate.
The central plank of the risk assessment part of the process is what Siddles calls the ‘good company test’. The manager assesses five factors that he says give rise to the majority of the risk of equity investment: competition, misuse of capital, high management pay, powerful customers and high share valuations. Companies that pass the test must display all of the five following attributes, in order to mitigate the five risks.
■
A winning franchise: companies should be ‘natural winners’ that can counter competitive risks by gaining market share and increasing profitability.
■
Free cash flow: this indicates that capital is being used wisely. Siddles says he prefers firms that use their free cash flow for share buybacks that enhance value for existing investors.
■
Inside ownership: rather than high management salaries, which benefit only those to whom they are paid, the manager looks for significant equity ownership (usually at least $20-25m) by management, arguing that this level of ownership aligns the interests of management with those of external shareholders.
■
Balance of power: while ‘the customer is king’ is a good mantra for service industries, Siddles seeks to avoid companies that lack pricing power because of over-powerful customer bases.
■
Low share valuation risk: The manager seeks companies with at least 50% upside from share price levels at the time of investment.
Siddles notes that the combination of low business risk and low share price risk is what makes the good company test so demanding; almost all of the companies that get through the initial share price screen fail to make it through to the final company analysis stage, as it is easy to get over the first four hurdles but fall at the fifth, or meet the fifth test but fail the first four.
The manager travels frequently to the US and meets companies on their own ground; he also attends industry conferences and talks to analysts, other value investment managers and regional brokers. For the handful of stocks that pass the ‘good company test’, he builds financial models against which holdings are regularly assessed. Siddles says he rarely buys stocks at IPO, as by definition this is a point at which insiders are reducing, rather than increasing their stakes.
The manager characterises this focus on risk assessment as a ‘margin of safety’ approach, aimed at trying to avoid losing money. Key aspects of this approach are that it is long-term and value-oriented, both characteristics that have tended to translate into good long-term performance in US equity markets. Siddles says that the pressure on fund managers to generate short-term performance creates periodic sell-offs when particular stocks or industries fall out of favour. These sell-offs can create long-term opportunities, but it is important to be able to distinguish the genuine opportunities from the value traps.
The final portfolio blends two types of stock: long-term core holdings with valuable assets (which Siddles terms ‘Buffett compounders’) and shorter-term trading opportunities (‘Graham recovery’ stocks). In line with the manager’s long-term approach, the aim is to hold the Buffett stocks ‘forever’ and the Graham stocks for two to three years until a turnaround has been achieved. In both cases Siddles seeks at least 50% price upside. With the Buffett stocks, the margin of safety comes from the fact that they are cheap compared with the underlying value of the business, while with the Graham stocks it comes from the fact they are trading at ‘bombed-out’ valuations, often below book value, or at a low multiple of free cash flow.
In general, the Buffett stocks will tend to outnumber the Graham stocks; at 30 April 2016 there were 36 of the former and 14 of the latter. The portfolio is broadly equal weighted, although the manager may run winners up to c 5% of assets versus the more typical 2.5% for holdings in the top 10.
The sell discipline splits broadly into three areas: fundamental factors, market factors and portfolio factors. The first two account for the majority of sales. Fundamental sales may be driven by a company making a big, non-core acquisition that changes the shape of the business; by a failure to deliver growth or recovery after two to three years; by a change in an industry cycle (in Siddles’s view it will be a long time, for example, until the mining sector recovers); or where the investment thesis either no longer applies (for example in the case of a recovery stock that has recovered) or fails to play out as anticipated. Market sales may be driven by sharp upward price movements in a short period (although this is likely to trigger top-slicing rather than an outright sale), if growth in a ‘compounder’ begins to look extended, or if a stock reaches a self-imposed market cap ceiling (the manager’s strategy of running winners means stocks may be retained when they are no longer strictly ‘small’). Portfolio sales are those that are required to keep stock or industry exposures within broad risk limits (5% and 15% respectively). Fundamental sales are the primary reason for a complete exit from a stock, while market sales generate trading activity as holdings are trimmed.
Siddles points out that in terms of sell discipline there is a distinction between the compounders (which, given the choice, he would hold forever) and the recovery/turnaround stocks, which are sold when they reach price targets.
As shown in Exhibit 3, JUS’s portfolio is significantly cheaper on average than the Russell 2000 Index on a price-to-book basis, and also cheaper in terms of forward P/E, for a comparable level of long-term earnings growth. In terms of market capitalisation (see Exhibit 1), Siddles describes the strategy as a barbell, with overweights to the largest ($5bn+) and the smallest (sub-$500m) stocks, and an underweight versus the central segment of $500m-5bn. Roper Technologies, the third-largest position, has a market cap of nearly $17.5bn but was below $500m when first purchased in 2001.
Exhibit 3: JUS portfolio metrics versus Russell 2000 Index
JUS |
Index |
Relative |
|
Price/book (x) |
2.0 |
3.2 |
-1.2 |
Forward P/E (x) |
16.7 |
19.6 |
-2.9 |
Long-term EPS growth (%) |
13.5 |
13.8 |
-0.3 |
Source: Jupiter US Smaller Companies. Note: Data at 31 December 2015.
As well as JUS, Siddles also runs an open-ended version of the strategy, the Jupiter US Small and Midcap Companies fund, launched in 2014. The two funds are broadly analogous but the unit trust has small holdings in the Russell 2000 that it can use as a source of liquidity to manage inflows and outflows; this is not necessary in the investment trust because of its closed-ended structure.
Case study 1: IPC Healthcare – a ‘Buffett compounder’
IPC Healthcare was purchased in late 2014 (market cap at purchase: c $750m) as a long-term ‘compounder’. It provides physician practice management for ‘hospitalists’, a section of the US healthcare industry focused on controlling hospital costs for health insurers. Hospitalists are the point of contact for inpatients, ensuring that the correct treatment is received, there is no ‘just-in-case’ over-treatment (a costly side-effect of the tendency towards litigation), and that length of stay is kept to a minimum. IPC has been able to grow both organically and by acquisition.
When Siddles bought the stock, the share price had been under pressure on concerns about doctor retention. However, the manager felt the company was tackling the problem of high staff turnover sensibly, spending more on recruitment and retention, which – although it had a short-term impact on margins – would accelerate growth over time, a thesis that began to be proved in 2015.
Stabilisation of growth and margins saw the stock price rise sharply from the $40 purchase price, and in July 2015 Team Health bid for IPC, causing the price to jump to $80. Siddles notes that while a 100% share price return in less than 12 months is an obvious boost to performance, it is a double-edged sword as he had hoped to hold the stock for the long term.
How IPC Healthcare passed the ‘good company test’
■
Franchise: market leadership, focus and high standards
■
Management: still managed by founder; insiders owned $20m in stock
■
Free cash flow: $52m generated in 2014
■
Customers: highly fragmented customer base
■
Valuation: bought at $40; manager valued company at 25x 2016 EPS, or $66.
Case study 2: Penn National Gaming – a ‘Graham recovery’
Penn National Gaming is a leading regional operator of casinos. Siddles describes the gaming sector as a staple for working-class Americans, as well as a source of income and jobs for Native American populations, on whose land many of the casinos are located. Importantly the regional focus means Penn is not troubled by the massive overcapacity in Las Vegas. Penn National has a good reputation as an operator and employer, and is careful with costs. The manager bought the stock in late 2014 at $11 (market cap of c $1bn) after it had traded sideways for some time since the financial crisis. Using EBITDA multiples on recovering cash flow, Siddles valued the shares at $19. At the time of purchase the oil price was plummeting, which boosted consumer spending. As a result shares in Penn National rose sharply, reaching the manager’s price target in mid-2015, at which point it was sold. Subsequently the shares fell back somewhat, and at 24 May stood at c $14.
How Penn National Gaming passed the ‘good company test’
■
Franchise: reputation as a leading regional player; careful cost management
■
Management: highly rated by industry; held over $120m in stock
■
Free cash flow: $170m in 2014, excluding growth capex
■
Customers: company focus on areas where there are few alternative casinos
■
Valuation: bought at $11, manager valued company at 8x 2016 EBITDA, or $19.
Current portfolio positioning
At 30 April 2016, JUS had 50 holdings, well below the 130-stock average for open-ended peers (see page 12) but broadly in line with the closed-ended sector average. The top 10 holdings made up 24.9% of assets, and the lack of overlap with the top 10 of 12 months previously (see Exhibit 1) is indicative of the broadly equal-weighted approach and the impact of share price volatility, rather than a high level of turnover. That said, three of the top 10 holdings (HMS Holdings, American Vanguard and Genesee & Wyoming) have been added to the portfolio in the past 12 months.
The longest-standing holding is in Roper Technologies, owned since 2001. It focuses on buying businesses with low capital intensity but good profitability, improving them operationally and teaching them how to grow more quickly.
There are a few broad themes in the portfolio at present. Themes with recovery potential include stocks with exposure to consumer spending and housebuilding, energy (there are no oil producers but some energy-related stocks that could perform well as the oil price normalises), industrials (which have been in near-recession because of the strong dollar, low oil prices and ‘dumping’ of commodities such as steel by China) and agriculture, which is highly cyclical. Longer-term themes include healthcare savings (a key focus in the US as Obamacare means higher costs for the industry), transport deregulation (transport is a large and fragmented sector because of the sheer size of the US), and database companies. Siddles favours the latter because after the initial investment in data collection, capital intensity is low and so companies are able to generate high recurring revenues.
Exhibit 4: Portfolio sector exposure vs benchmark (% unless stated)
Portfolio |
Portfolio |
Change |
Russell 2000* |
Active weight vs index (% pts) |
Trust weight/ index weight (x) |
|
Producer durables |
19.9 |
13.9 |
6.0 |
12.6 |
7.3 |
1.6 |
Healthcare |
17.7 |
15.1 |
2.6 |
13.7 |
4.0 |
1.3 |
Energy |
5.6 |
5.6 |
0.0 |
2.2 |
3.4 |
2.5 |
Consumer staples |
6.4 |
3.4 |
3.0 |
3.4 |
3.0 |
1.9 |
Utilities |
2.3 |
4.0 |
-1.7 |
5.4 |
-3.1 |
0.4 |
Materials & processing |
2.7 |
8.1 |
-5.4 |
6.2 |
-3.5 |
0.4 |
Financial services |
23.1 |
23.0 |
0.1 |
27.1 |
-4.0 |
0.9 |
Consumer discretionary |
8.9 |
13.3 |
-4.4 |
14.8 |
-5.9 |
0.6 |
Technology |
7.6 |
10.8 |
-3.2 |
14.6 |
-7.0 |
0.5 |
Cash |
5.7 |
2.7 |
3.0 |
0.0 |
5.7 |
N/A |
100.0 |
100.0 |
0.0 |
100.0 |
0.0 |
Source: Jupiter US Smaller Companies, Edison Investment Research. Note: *Russell 2000 weights at 31 March (released quarterly). Ranked by active weight, excluding cash.
The manager tries to ensure he has exposure to all the broad market sectors (Exhibit 4), given the opportunity cost of being out of an area that might suddenly find favour. However, JUS’s sector weightings diverge significantly from the index, with a large overweight in industrials (producer durables) balanced by a similar underweight in technology, where it is harder to find value. Financials is the largest absolute weighting, with core holdings in insurance and an increased position in banks, which are now broadly recapitalised following the housing crisis and are less risky as a result.
Recent additions to the portfolio include Allegiant Travel, a point-to-point airline connecting small cities directly with holiday destinations (historically, most flights have been via large hub airports). Allegiant is a low-cost operator with a fleet of older aircraft, and has a good growth record. Perversely it has fallen out of favour in the low oil price environment, which means on one hand that higher-end operators can offer more competitive fares, and on the other that cheaper gasoline means some potential passengers may choose to drive instead. Siddles notes that any price adjustment by Allegiant could see a big increase in business.
Performance: Solid absolute performance record
|
Exhibit 5: Investment trust performance to 30 April 2016 |
||||||||
Price, NAV and benchmark total return performance, one-year rebased |
Price, NAV and benchmark total return performance (%) |
|||||||
|
|
|||||||
|
Source: Thomson Datastream, Edison Investment Research. Note: Three, five and 10-year performance figures annualised. |
||||||||
|
Exhibit 6: Share price and NAV total return performance, relative to indices (%) |
||||||||
|
One month |
Three months |
Six months |
One year |
Three years |
Five years |
10 years |
|
Price relative to Russell 2000 CR |
5.0 |
10.3 |
5.0 |
4.1 |
(19.5) |
(2.1) |
11.9 |
|
NAV relative to Russell 2000 CR |
2.2 |
3.5 |
5.6 |
2.3 |
(3.4) |
6.2 |
15.3 |
|
Price relative to S&P 500 |
6.2 |
12.5 |
1.8 |
(4.6) |
(30.3) |
(24.1) |
(15.1) |
|
NAV relative to S&P 500 |
3.3 |
5.6 |
2.3 |
(6.3) |
(16.3) |
(17.7) |
(12.6) |
|
Price relative to FTSE All-Share |
3.4 |
12.2 |
7.7 |
7.3 |
(8.9) |
12.6 |
29.6 |
|
NAV relative to FTSE All-Share |
0.6 |
5.4 |
8.4 |
5.5 |
9.4 |
22.1 |
33.6 |
|
|
Source: Thomson Datastream, Edison Investment Research. Note: Data to end-April 2016. Geometric calculation. |
||||||||
JUS’s manager notes that his ultimate aim is to avoid losing money for investors, and in that regard he has been successful over almost all time periods (Exhibit 5). Over five and 10 years the trust has produced annualised NAV and share price total returns of between 5% and 10%. The 12 months ended 30 April have been more challenging, with bouts of market volatility in summer 2015 and at the beginning of 2016, but one-, three- and six-month performance has been strong in both absolute terms and relative to the Russell 2000 benchmark. As shown in Exhibit 6, JUS has also comfortably beaten the large-cap S&P 500 and the UK FTSE All-Share, included for its broad relevance to UK-based investors, over these shorter periods. However, longer-term performance has been less positive in relative terms, particularly versus the S&P 500, because of the recent history of large-cap growth outperformance.
The manager employs a ‘margin of safety’ approach that has broadly led to outperformance of the index in negative market conditions. However, figures from Jupiter suggest this downside protection has also helped to achieve aggregate outperformance over the majority of periods in all market conditions: since inception in 2001 the trust has outperformed the index in 83% of rolling three-year periods and 97% of rolling five-year periods.
To underline the fact that the manager is pragmatic rather than dogmatic in his approach to value investing, Exhibit 7 illustrates long-term performance relative to the Russell 2000 benchmark. During the global financial crisis in 2008 the portfolio held up well relative to the benchmark and also beat the Russell 2000 Value Index (which in turn outperformed the Russell 2000). The following year, as the market recovered, the value index underperformed the broader index, but JUS’s manager was able to find many attractive companies that had sold off in the crisis, and again outperformed both indices. The trust also outperformed in 2011 and 2012 but underperformed the Russell 2000 in 2013, 2014 and 2015 as growth stocks drove the market, exemplified by the strong run-up in biotech. Biotech has sold off heavily since September 2015 and this, combined with a general market rotation in favour of the value style, has helped JUS to outperform the benchmark since late 2015.
|
Exhibit 7: NAV performance relative to benchmark over 10 years |
|
|
Source: Thomson Datastream, Edison Investment Research |
Discount: Narrowing trend, supported by buybacks
At 2 June 2016, JUS’s shares were trading at a 10.9% discount to net asset value. This is a little narrower than the 12-month average of 11.7% but wider than the 3.7% reached in July 2015.
Historically, JUS has traded at a narrower discount (average of 5.7% over three years and 3.7% over five years), and spent much of 2013 trading at a premium. The widening since the beginning of 2014 has coincided with a period during which returns from US value stocks have lagged the broader market (see Exhibit 2, page 3). With evidence beginning to emerge of better performance for the value segment, there is scope for JUS’s discount to continue to narrow; indeed, it has almost halved from the five-year widest point of 17.3% reached in January 2016.
JUS may buy back or allot shares to manage a discount or a premium (see Capital structure and fees, below). Recent buybacks may have been instrumental in narrowing the discount since the start of the year.
|
Exhibit 8: Share price premium/discount to NAV (including income) over three years (%) |
|
|
Source: Thomson Datastream, Edison Investment Research. |
Capital structure and fees
JUS is a conventional investment trust with one class of share. At 2 June it had 22.8m ordinary shares in issue. The board has the authority to buy back up to 14.99% of shares annually and allot up to 10% of shares in order to manage a discount or a premium; over the long term its aim is to keep the discount to NAV on average below 10%. Recent months have seen the first buybacks of the past five years, amounting to 1.15m shares at a cost of £7.2m since late December 2015.
The trust does not employ gearing, as the board and manager feel that it would be inappropriate to magnify the risk of an already potentially volatile asset class.
Jupiter Unit Trust Managers (JUTM) acts as JUS’s Alternative Investment Fund Manager (AIFM) under the AIFM Directive, and delegates investment management to Jupiter Asset Management (JAM). JUTM receives an investment management fee of 0.8% of net assets per year (calculated as 0.2% quarterly), excluding the value of any Jupiter-managed investments, of which there were none at FY15. A performance fee structure is also in place, under which JUTM may be paid 5% of outperformance, defined as NAV performance in a financial year (excluding the impact of any performance fees) in excess of 2% above the Russell 2000 Index performance (both in sterling terms). Performance fees are capped at 0.7% of gross assets and any underperformance in excess of 2% is carried forward and must be made up before a performance fee can be earned. No performance fee was paid in respect of FY15, while in 2014 a fee of £43,000 (0.02% of assets) was paid.
Dividend policy and record
JUS invests for capital growth and has not historically paid a dividend. This reflects the low yield of the US stock market in general, as well as the fact that smaller companies may be at an earlier stage of development and hence more likely to reinvest for future growth than pay out their profits as dividends. Dividend income of £1.5m from the portfolio in respect of FY15 was equivalent to a portfolio yield of 0.9% (based on the closing value of investments). However, with all of the investment management fees and the majority of other expenses charged to the revenue account, net revenue for the year was slightly negative. This has also been the case in previous years, and the trust does not have a revenue reserve.
Peer group comparison
JUS is a member of the Association of Investment Companies’ North America Smaller Companies sector. This is a small peer group with only three funds, so in Exhibit 9 below we have included sterling share classes of open-ended funds (including JUS’s sister unit trust) for a more meaningful comparison. JUS’s manager notes that as the trust does not use gearing, it is possible to compare it directly with open-ended funds. In the AIC peer group, the North Atlantic Smaller Companies trust invests on both sides of the Atlantic, and had more than half its assets in UK companies at its 31 January 2016 year-end. The JPMorgan US Smaller Companies trust follows a growth rather than a value investment style.
JUS’s NAV total returns are behind the weighted averages for both the closed and open-ended funds over one, three and five years, reflecting a period in which value as a style has been out of favour. Risk-adjusted returns as measured by the Sharpe ratio are the lowest in the AIC peer group but are more in line with the weighted average for open-ended funds. In common with all but one of the funds across both peer groups, JUS does not pay dividends. It is also ungeared as a matter of policy. All the closed-ended funds have a performance fee structure in place, but JUS’s ongoing charges are at the lower end for both groups. It also has the lowest discount to NAV of the three investment trusts.
Exhibit 9: North America Smaller Companies investment trusts/funds as at 13 May
% unless stated |
Market cap £m |
TR 1 year |
TR 3 year |
TR 5 year |
Ongoing charge |
Perf. fee |
Discount (ex-par) |
Net gearing |
Dividend yield (%) |
Sharpe 1y (NAV) |
Sharpe |
Jupiter US Smaller Cos |
144.2 |
(2.6) |
14.7 |
54.5 |
1.0 |
Yes |
(10.8) |
100.0 |
0.0 |
(0.4) |
0.4 |
JPMorgan US Smaller Cos |
95.2 |
6.6 |
39.2 |
84.8 |
1.7 |
Yes |
(11.8) |
113.0 |
0.0 |
0.0 |
0.8 |
North Atlantic Smaller Cos |
337.3 |
12.4 |
55.6 |
89.1 |
1.1 |
Yes |
(14.3) |
100.0 |
0.0 |
0.4 |
1.0 |
Sector weighted average |
7.7 |
42.7 |
79.7 |
1.2 |
(13.0) |
102.1 |
0.0 |
0.1 |
0.8 |
||
JUS rank in sector |
2 |
3 |
3 |
3 |
3 |
1 |
2 |
1 |
3 |
3 |
|
Open-ended funds |
|||||||||||
Artemis US Smaller Cos |
58.3 |
5.3 |
-- |
-- |
1.0 |
No |
0.0 |
-0.1 |
0.6 |
||
F&C US Smaller Companies |
61.1 |
4.9 |
27.7 |
67.4 |
1.7 |
No |
0.0 |
0.0 |
0.6 |
||
GS US Sm Cap CORE Eq |
61.9 |
1.2 |
29.5 |
63.5 |
0.9 |
No |
0.2 |
-0.3 |
0.6 |
||
Hermes US Smid Equity |
310.4 |
1.7 |
-- |
-- |
0.9 |
No |
0.0 |
-0.2 |
0.3 |
||
Janus US Venture |
139.7 |
(2.3) |
37.9 |
-- |
1.0 |
No |
0.0 |
-0.4 |
0.8 |
||
JPM US Smaller Companies |
55.9 |
(10.7) |
11.1 |
26.8 |
1.7 |
No |
0.0 |
-0.6 |
0.3 |
||
Jupiter US Small & Midcap Cos |
20.2 |
(4.2) |
-- |
-- |
1.8 |
No |
0.0 |
-0.4 |
-0.1 |
||
Legg Mason IF Royce US Smlr Cos |
173.3 |
(4.3) |
10.7 |
18.9 |
1.2 |
No |
0.0 |
-0.6 |
0.2 |
||
Legg Mason RY US Sm Co Opp |
387.1 |
(6.4) |
10.2 |
37.0 |
2.0 |
No |
0.0 |
-0.5 |
0.3 |
||
Schroder US Smaller Cos |
566.6 |
4.1 |
33.0 |
59.7 |
1.7 |
No |
0.0 |
-0.1 |
0.7 |
||
T. Rowe Price US Smaller Co |
548.6 |
5.6 |
41.0 |
89.1 |
1.1 |
No |
0.0 |
-0.1 |
0.9 |
||
Threadneedle Amer SmCos |
564.6 |
(0.8) |
32.8 |
58.1 |
1.7 |
No |
0.0 |
-0.5 |
0.6 |
||
Weighted average |
0.7 |
29.3 |
59.0 |
1.4 |
0.0 |
(0.3) |
0.6 |
Source: Morningstar, Edison Investment Research. Note: TR=NAV total return. Sharpe ratio is a measure of risk-adjusted return. The ratios shown are calculated by Morningstar for the past 12- and 36-month periods by dividing a fund’s annualised excess returns over the risk-free rate by its annualised standard deviation. Net gearing is total assets less cash and equivalents as a percentage of net assets (100 = ungeared). Open-ended funds use GBP-denominated retail share classes.
The board
JUS has five independent non-executive directors. Chairman Gordon Grender, a veteran US equity fund manager, has been on the board of JUS since its inception in 1993. Peter Barton, chairman of the audit and management engagement committee, is a solicitor and investment banker and became a director in 1998. Norman Bachop, also a former US equity fund manager, is the senior independent director (since 2007) and was appointed to the board in 1999. Clive Parritt has been a director since 2007 and is a chartered accountant. The newest director, Lisa Booth, was appointed in September 2015; she is a solicitor.
|