Turkish financial markets in 2015
ISY’s financial results are dependent on activity levels and the direction of the Turkish financial markets.
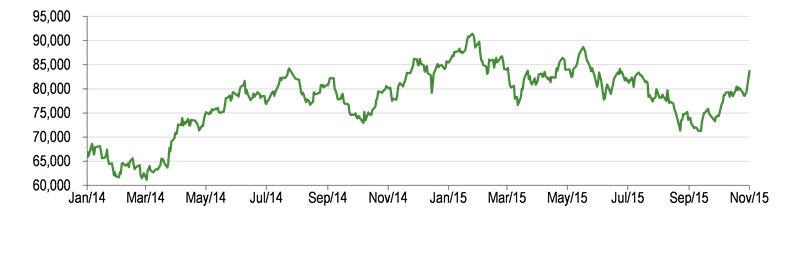
Exhibit 7: Istanbul Stock Exchange
|
|
|
|
Turkish equity markets started 2015 in optimistic mood as falling oil prices were expected to lower inflation, which would allow interest rates to fall and boost economic activity, so the Borsa Istanbul rose to over 91,000 by the end of January, 45% higher than the year before. However, since that date, negative global and local economic and political developments including negative sentiment towards emerging markets, have resulted in a decline in the index. There was a rebound in the index after September, which has continued after the decisive outcome of the general election. However, sentiment remains fragile.
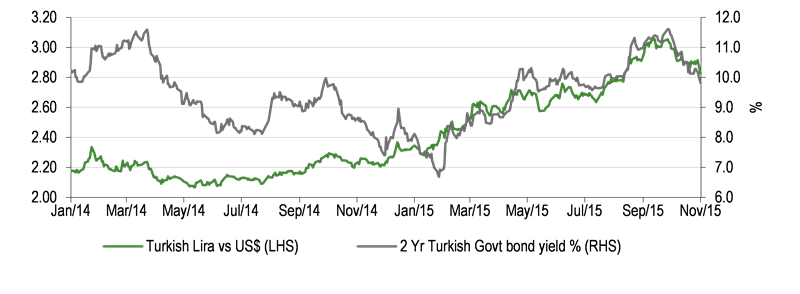
Exhibit 8: Turkish lira vs US$ and two-year Turkish government bonds yields
|
|
|
|
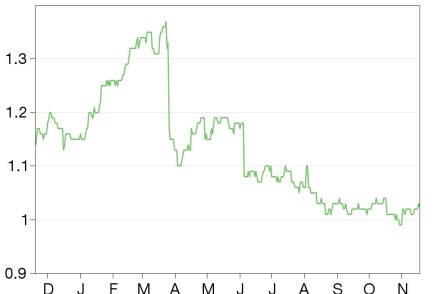
Turkish bond yields have risen for most of 2015 and the Turkish lira has depreciated against the US$ over concerns about Turkey’s economy and geopolitical and local political uncertainties. However, even before the outcome of the Turkish elections was announced in November, there was a recovery the lira and a fall in Turkish bond yields, as investors increased their risk appetite for Turkish assets.
Q315 results for ISY were a continuation of the performance achieved earlier in the year, with the investment bank performing relatively well in its core activities, but a number of one-off negatives, especially in the subsidiaries, resulting in group net profit falling by 30% y-o-y, as shown in Exhibit 9 below.
Exhibit 9: Is Investment group net profits by entity
TRYm |
9M14 |
9M15 |
Change (%) |
IS Investment |
36.6 |
41.0 |
12 |
Foreign-based subsidiaries |
(0.3) |
(4.1) |
|
IS Investment Trust (28.9%) |
4.7 |
0.2 |
(96) |
IS Private Equity (29.1%) |
0.4 |
(3.5) |
|
IS Asset Management (70.0%) |
5.0 |
6.9 |
38 |
Efes NPL Asset Management (74%) |
6.5 |
5.7 |
(12) |
Elimination adjustments* |
(13.4) |
(18.7) |
40 |
Profit attributable to shareholders |
39.5 |
27.5 |
(30) |
Source: ISY. Note:*Dividend and revenue eliminations
Is Investment (parent) posted a 12% y-o-y increase in attributable profits in the nine months to 30 September 2015, as shown in Exhibit 11.
Interest and derivative income fell 26% in the nine months to 30 September 2015 compared with the previous year, as in 2015 the cost of funding its commercial paper programme has now been included in this line; it was previously netted off finance income. This is a more appropriate treatment as the borrowed funds are used in the arbitrage business.
Prop book trading consists of trading in equities, debt instruments, mutual funds and warrants. In aggregate there was a 16% increase y-o-y, with equity warrant trading doing particularly well. In aggregate, brokerage revenues rose 25% y-o-y, primarily because of 28% growth in derivative brokerage and a 36% rise in FX brokerage, as ISY’s investors traded actively in the volatile market conditions. Equity brokerage revenues rose around 9%. ISY has lost some market share in trading equities, derivative and FX as the company has been reluctant to chase market share with discounted prices like some of its rivals.
Exhibit 10: ISY market share and ranking: 9M14 and 9M15
|
Market share 9M14 |
Position 9M14 |
Market share 9M15 |
Position 9M15 |
Equity trading |
7.6% |
1 |
7.1% |
1 |
Derivatives trading |
10.9% |
1 |
8.8% |
2 |
FX brokerage |
11.0% |
1 |
5.6% |
7 |
Exhibit 11: Is Investment (parent)
|
9M14 |
9M15 |
% change |
Interest and derivative income |
51.6 |
38.1 |
-26% |
Prop book trading |
20.8 |
24.1 |
16% |
Brokerage |
59.0 |
73.8 |
25% |
Corporate finance |
8.8 |
13.1 |
49% |
Asset management |
5.3 |
6.8 |
28% |
Other commissions |
0.7 |
0.6 |
-15% |
Total revenue |
146.2 |
156.5 |
7% |
Operating expenses |
-112.2 |
-124.5 |
11% |
Other income/(expenses) |
1.4 |
0.3 |
|
Operating profit |
35.4 |
32.2 |
-9% |
Finance income (net) |
9.0 |
16.3 |
82% |
Pre-tax profit |
44.4 |
48.6 |
9% |
Taxation |
-7.8 |
-7.6 |
-3% |
Profit after tax |
36.6 |
41.0 |
12% |
Cost/income ratio |
77% |
80% |
|
Tax rate |
18% |
16% |
|
ISY’s corporate finance team was active in the first nine months of 2015, with revenue rising 49%
y-o-y. It closed five M&A transactions in the period despite the adverse market headwinds. Asset management revenues increased as a result of the higher AuMs being managed.
Operating expenses at Is Investment (parent) increased by 11% y-o-y in 9M15, more than inflation of around 8%. ISY normally keeps a close control over operating expenses, but in this instance the depreciation of the Turkish lira meant it was unable to do so in 2015.
The rise in net finance income in 9M15 occurred as the cost of funding its commercial paper activities was reclassified to the interest and derivative income line in the profit and loss account.
The foreign-based subsidiaries incurred a loss of TRY4.1m in 9M15, considerably higher than in the comparable period of the previous year. Usually the foreign subsidiaries more or less break even in aggregate, but ISY is in the process of closing its Dubai subsidiary and its London operation, Maxis Investments, has suffered from GBP costs and revenues linked to the depreciating Turkish lira.
The lower profit contribution from Is Investment Trust was due to unrealised losses in its bond portfolio following the rise in Turkish lira interest rates during the year. Is Private Equity losses were the result of operating losses at its investee companies, which were adversely affected by political headwinds in Turkey. It should be remembered that ISY fully consolidates the results of Is Private Equity in its accounts, even though IS Private Equity values its holdings at fair value in its accounts.
The rise in profit contribution of 38% from Is Asset Management was due to the rise in its AuMs as a result of the strength of the Turkish equity compared to 2014. Efes NPL Asset Management profits fell 12% y-o-y in 9M15, which should be considered a good performance given the rise in bond markets during the year and the uncertain economic and political situation.
Forecasts: Downward revision for 2015 and 2016
We have revised down our 2015 and 2016 attributable profit expectations, the former by 29% and the latter by 19% to reflect a cautious economic and financial outlook.
Exhibit 12: Edison ISY forecast revisions
|
Revenue (TRYm) |
Attributable profit (TRYm) |
EPS (Kr) |
DPS (Kr) |
|
Old |
New |
% chg |
Old |
New |
% chg |
Old* |
New |
% chg |
Old* |
New |
% chg |
12/15e |
411.8 |
349.8 |
-15% |
63.2 |
45.0 |
-29% |
17.8 |
12.7 |
-29% |
13.2 |
13.2 |
N/A |
12/16e |
450.0 |
374.0 |
-17% |
77.6 |
62.8 |
-19% |
21.9 |
17.7 |
-19% |
13.2 |
13.2 |
N/A |
Source: Edison Investment Research
We have left our DPS forecasts for 2015 and 2016 unchanged. ISY increased its DPS by over 90% in 2014 as it believes that shareholders are more likely to be rewarded by dividend income than by capital gains from a rising ISY share price. ISY has a comparatively strong balance sheet with tangible equity equal to 15% of total assets, which compares with 9% at Goldman Sachs, so the company could pay out more than its earnings on a temporary basis. We estimate that if ISY maintains its dividend in 2015 at Kr 13.2, the dividend will be slightly uncovered by attributable profits in 2015, but we anticipate that it will be covered again in 2016. The dividend payment is a board matter, which will be decided in spring 2016 when the economic and political outlook may be clearer. Our dividend forecasts remain tentative.
Exhibit 13: Financial summary
TRY'm |
2012 |
2013 |
2014 |
2015e |
2016e |
Year end 31 December |
IFRS |
IFRS |
IFRS |
IFRS |
IFRS |
PROFIT & LOSS |
|
|
|
|
|
Revenue |
311.9 |
344.7 |
400.3 |
349.8 |
374.0 |
Operating expenses |
(193.5) |
(247.2) |
(266.5) |
(295.9) |
(310.0) |
Gross Profit |
118.4 |
97.5 |
133.8 |
53.9 |
64.0 |
Other operating Income |
10.1 |
5.7 |
|
|
|
Other operating Expenses |
(4.8) |
(10.0) |
(2.1) |
(21.3) |
(21.0) |
Operating profit |
123.7 |
93.2 |
131.7 |
32.6 |
43.0 |
Other income |
5.4 |
4.3 |
(31.2) |
(1.4) |
0.0 |
Net financials |
20.5 |
39.7 |
|
|
|
Exceptionals |
4.2 |
0.0 |
0.0 |
0.0 |
0.0 |
Profit Before Tax (norm) |
149.6 |
137.2 |
100.5 |
31.2 |
43.0 |
Profit Before Tax (FRS) |
153.8 |
137.2 |
100.5 |
31.2 |
43.0 |
Tax |
(16.5) |
(11.8) |
(7.9) |
(7.8) |
(5.2) |
Profit After Tax (norm) |
133.2 |
125.3 |
92.6 |
23.4 |
37.8 |
Profit After Tax (FRS) |
137.4 |
125.3 |
92.6 |
23.4 |
37.8 |
Minority interest |
68.6 |
54.5 |
29.7 |
(-21.6) |
(-25.0) |
Net income (norm) |
64.5 |
70.8 |
62.9 |
45.0 |
62.8 |
Net income (FRS) |
68.7 |
70.8 |
62.9 |
45.0 |
62.8 |
Average Number of Shares Outstanding (m) |
355 |
355 |
355 |
355 |
355 |
EPS - normalised fully diluted (kr) |
18.2 |
19.9 |
17.7 |
12.7 |
17.7 |
EPS - IFRS (kr) |
19.4 |
19.9 |
17.7 |
12.7 |
17.7 |
Dividend per share (Kr) |
5.9 |
6.9 |
13.2 |
13.2 |
13.2 |
|
|
|
|
|
|
BALANCE SHEET |
|
|
|
|
|
Fixed Assets |
148.8 |
150.7 |
168.8 |
181.6 |
185.0 |
Intangible Assets |
72.4 |
66.2 |
61.2 |
62.5 |
63.0 |
Tangible Assets |
53.1 |
29.2 |
35.0 |
33.0 |
33.0 |
Investments |
23.3 |
25.9 |
72.6 |
86.1 |
89.0 |
Current Assets |
4,017.7 |
4,784.6 |
5,186.3 |
5,500.0 |
5,500.0 |
Investments |
658.6 |
588.2 |
709.0 |
535.0 |
600.0 |
Trade receivables |
1,004.4 |
1,296.0 |
1,380.0 |
1,625.0 |
1,630.0 |
Cash and equivalents |
2,218.5 |
2,665.6 |
2,906.0 |
3,030.0 |
3,035.0 |
Other |
136.2 |
234.8 |
191.3 |
310.0 |
235.0 |
Total Assets |
4,166.5 |
4,935.3 |
5,355.1 |
5,681.6 |
5,685.0 |
|
|
|
|
|
|
Current Liabilities |
(3,240.5) |
(3,907.8) |
(4,294.9) |
(4,593.4) |
(4,678.5) |
Short term borrowings |
(2,319.6) |
(2,753.8) |
(3,140.1) |
(3,128.0) |
(3,503.5) |
Trade payables |
(829.3) |
(979.4) |
(981.2) |
(1,282.0) |
(1,000.0) |
Other |
(91.6) |
(174.6) |
(173.6) |
(183.4) |
(175.0) |
Long Term Liabilities |
(72.2) |
(110.1) |
(102.2) |
(177.5) |
(105.0) |
Long term borrowings |
(58.3) |
(95.0) |
(90.1) |
(151.8) |
(97.0) |
Other long term liabilities |
(13.9) |
(15.1) |
(12.1) |
(25.7) |
(8.0) |
Total Liabilities |
(3,312.7) |
(4,017.9) |
(4,397.1) |
(4,770.9) |
(4,783.5) |
|
|
|
|
|
|
Equity attributable to ordinary shareholders |
460.0 |
518.5 |
557.4 |
555.4 |
571.2 |
Minority interest |
393.8 |
398.9 |
400.6 |
355.3 |
330.3 |
Total shareholders' equity |
853.8 |
917.4 |
958.0 |
910.7 |
901.5 |
Number of shares at year end (m) |
355 |
355 |
355 |
355 |
355 |
NAV per share |
1.30 |
1.46 |
1.57 |
1.56 |
1.61 |
ROE |
14.0% |
14.5% |
11.7% |
8.1% |
11.2% |
ROA |
1.5% |
1.6% |
1.2% |
0.8% |
1.1% |
Cost/income ratio |
62.0% |
71.7% |
66.6% |
84.6% |
82.9% |
Source: ISY, Edison Investment Research
Contact details |
Revenue by geography |
Is Kuleleri,
Kule-2 Kat 12
34330 4. Levent, Istanbul,
Turkey
+90 212 350 2000
www.isinvestment.com |
N/A |
Contact details |
Is Kuleleri,
Kule-2 Kat 12
34330 4. Levent, Istanbul,
Turkey
+90 212 350 2000
www.isinvestment.com |
Revenue by geography |
N/A |
Management team |
|
Chairman: İlhami Koç |
CEO: Ali Erdal Aral |
Having previously served as the general manager of ISY, Mr Koç was appointed as the chairman of ISY in February 2013. In 1997, he moved from Isbank to Is Investment, where he has been a manager in the Asset Management, Corporate Finance, Research and International Capital Markets, and Private Equity divisions. In 2002, he became the general manager of Is Investment. |
In February 2013, Mr Aral was appointed as the general manager of ISY. Since starting his career at Isbank in 1989, he has served in various units and branches before being appointed head of treasury in 2002. He was later promoted to corporate branch manager of Isbank–Kozyatağı corporate branch in 2008 and deputy chief executive at Isbank in 2011. |
Management team |
Chairman: İlhami Koç |
Having previously served as the general manager of ISY, Mr Koç was appointed as the chairman of ISY in February 2013. In 1997, he moved from Isbank to Is Investment, where he has been a manager in the Asset Management, Corporate Finance, Research and International Capital Markets, and Private Equity divisions. In 2002, he became the general manager of Is Investment. |
CEO: Ali Erdal Aral |
In February 2013, Mr Aral was appointed as the general manager of ISY. Since starting his career at Isbank in 1989, he has served in various units and branches before being appointed head of treasury in 2002. He was later promoted to corporate branch manager of Isbank–Kozyatağı corporate branch in 2008 and deputy chief executive at Isbank in 2011. |
Principal shareholders |
(%) |
Is Bank and IS Bank Group Companies |
71.0 |
|
|
|
|
|
|
|
|
|
|
|
|
|
Companies named in this report |
Is Bank, Is Investment; Is Private Equity; Is Investment Trust; Is Asset Management, Goldman Sachs |
|
Edison, the investment intelligence firm, is the future of investor interaction with corporates. Our team of over 100 analysts and investment professionals work with leading companies, fund managers and investment banks worldwide to support their capital markets activity. We provide services to more than 400 retained corporate and investor clients from our offices in London, New York, Frankfurt, Sydney and Wellington. Edison is authorised and regulated by the Financial Conduct Authority (www.fsa.gov.uk/register/firmBasicDetails.do?sid=181584). Edison Investment Research (NZ) Limited (Edison NZ) is the New Zealand subsidiary of Edison. Edison NZ is registered on the New Zealand Financial Service Providers Register (FSP number 247505) and is registered to provide wholesale and/or generic financial adviser services only. Edison Investment Research Inc (Edison US) is the US subsidiary of Edison and is regulated by the Securities and Exchange Commission. Edison Investment Research Limited (Edison Aus) [46085869] is the Australian subsidiary of Edison and is not regulated by the Australian Securities and Investment Commission. Edison Germany is a branch entity of Edison Investment Research Limited [4794244]. www.edisongroup.com DISCLAIMER
Copyright 2015 Edison Investment Research Limited. All rights reserved. This report has been commissioned by Is Yatirim Menkul Degerler and prepared and issued by Edison for publication globally. All information used in the publication of this report has been compiled from publicly available sources that are believed to be reliable, however we do not guarantee the accuracy or completeness of this report. Opinions contained in this report represent those of the research department of Edison at the time of publication. The securities described in the Investment Research may not be eligible for sale in all jurisdictions or to certain categories of investors. This research is issued in Australia by Edison Aus and any access to it, is intended only for "wholesale clients" within the meaning of the Australian Corporations Act. The Investment Research is distributed in the United States by Edison US to major US institutional investors only. Edison US is registered as an investment adviser with the Securities and Exchange Commission. Edison US relies upon the "publishers' exclusion" from the definition of investment adviser under Section 202(a)(11) of the Investment Advisers Act of 1940 and corresponding state securities laws. As such, Edison does not offer or provide personalised advice. We publish information about companies in which we believe our readers may be interested and this information reflects our sincere opinions. The information that we provide or that is derived from our website is not intended to be, and should not be construed in any manner whatsoever as, personalised advice. Also, our website and the information provided by us should not be construed by any subscriber or prospective subscriber as Edison’s solicitation to effect, or attempt to effect, any transaction in a security. The research in this document is intended for New Zealand resident professional financial advisers or brokers (for use in their roles as financial advisers or brokers) and habitual investors who are “wholesale clients” for the purpose of the Financial Advisers Act 2008 (FAA) (as described in sections 5(c) (1)(a), (b) and (c) of the FAA). This is not a solicitation or inducement to buy, sell, subscribe, or underwrite any securities mentioned or in the topic of this document. This document is provided for information purposes only and should not be construed as an offer or solicitation for investment in any securities mentioned or in the topic of this document. A marketing communication under FCA Rules, this document has not been prepared in accordance with the legal requirements designed to promote the independence of investment research and is not subject to any prohibition on dealing ahead of the dissemination of investment research. Edison has a restrictive policy relating to personal dealing. Edison Group does not conduct any investment business and, accordingly, does not itself hold any positions in the securities mentioned in this report. However, the respective directors, officers, employees and contractors of Edison may have a position in any or related securities mentioned in this report. Edison or its affiliates may perform services or solicit business from any of the companies mentioned in this report. The value of securities mentioned in this report can fall as well as rise and are subject to large and sudden swings. In addition it may be difficult or not possible to buy, sell or obtain accurate information about the value of securities mentioned in this report. Past performance is not necessarily a guide to future performance. Forward-looking information or statements in this report contain information that is based on assumptions, forecasts of future results, estimates of amounts not yet determinable, and therefore involve known and unknown risks, uncertainties and other factors which may cause the actual results, performance or achievements of their subject matter to be materially different from current expectations. For the purpose of the FAA, the content of this report is of a general nature, is intended as a source of general information only and is not intended to constitute a recommendation or opinion in relation to acquiring or disposing (including refraining from acquiring or disposing) of securities. The distribution of this document is not a “personalised service” and, to the extent that it contains any financial advice, is intended only as a “class service” provided by Edison within the meaning of the FAA (ie without taking into account the particular financial situation or goals of any person). As such, it should not be relied upon in making an investment decision. To the maximum extent permitted by law, Edison, its affiliates and contractors, and their respective directors, officers and employees will not be liable for any loss or damage arising as a result of reliance being placed on any of the information contained in this report and do not guarantee the returns on investments in the products discussed in this publication. FTSE International Limited (“FTSE”) © FTSE 2015. “FTSE®” is a trade mark of the London Stock Exchange Group companies and is used by FTSE International Limited under license. All rights in the FTSE indices and/or FTSE ratings vest in FTSE and/or its licensors. Neither FTSE nor its licensors accept any liability for any errors or omissions in the FTSE indices and/or FTSE ratings or underlying data. No further distribution of FTSE Data is permitted without FTSE’s express written consent. |
Frankfurt +49 (0)69 78 8076 960 Schumannstrasse 34b 60325 Frankfurt Germany |
London +44 (0)20 3077 5700 280 High Holborn London, WC1V 7EE United Kingdom |
New York +1 646 653 7026 245 Park Avenue, 39th Floor 10167, New York US |
Sydney +61 (0)2 9258 1161 Level 25, Aurora Place 88 Phillip St, Sydney NSW 2000, Australia |
Wellington +64 (0)48 948 555 Level 15, 171 Featherston St Wellington 6011 New Zealand |
Frankfurt +49 (0)69 78 8076 960 Schumannstrasse 34b 60325 Frankfurt Germany |
London +44 (0)20 3077 5700 280 High Holborn London, WC1V 7EE United Kingdom |
New York +1 646 653 7026 245 Park Avenue, 39th Floor 10167, New York US |
Sydney +61 (0)2 9258 1161 Level 25, Aurora Place 88 Phillip St, Sydney NSW 2000, Australia |
Wellington +64 (0)48 948 555 Level 15, 171 Featherston St Wellington 6011 New Zealand |
|