PHP recently hosted a capital markets visit to the RoI, providing attendees with an opportunity to view a number of the group’s care centres within its growing Irish portfolio. The presentation that accompanied the visit, with details of each of the Irish assets, and a corporate video providing an overview of the portfolio can be found here:
https://www.phpgroup.co.uk/investors/results-centre
https://www.brrmedia.co.uk/broadcasts/5bd04ebbb01efb6b20c2f611/event
PHP began to invest in the RoI, a market driven by similar fundamentals to the UK, in 2016 and now has eight assets. This includes one forward-funded development that is currently under construction and is expected to complete in the autumn of 2019, in Bray.
Exhibit 1: PHP’s portfolio in the RoI
Location |
Asset type |
Date acquired |
Area (sqm) |
WAULT (years) |
Acquisition price (€m) |
Tipperary |
Investment |
October 2016 |
2,400 |
23.1 |
6.7 |
Carrigaline (completed) |
Forward funding |
August 2017 |
3,000 |
24.3 |
7.3 |
Mallow |
Investment |
February 2018 |
6,500 |
20.4 |
20.0 |
Mountmellick |
Investment |
May 2018 |
1,800 |
17.7 |
5.8 |
Celbridge |
Investment |
September 2018 |
3,500 |
23.9 |
13.0 |
Navan Road |
Investment |
September 2018 |
3,100 |
21.9 |
12.2 |
Newbridge |
Investment |
September 2018 |
4,100 |
20.3 |
13.4 |
Bray (under development) |
Forward funding |
Autumn 2019 |
4,800 |
25.0 |
22.3 |
Total |
|
|
29,200 |
|
100.7 |
PHP has spent €101m acquiring its assets in the RoI, which have a value (including Bray at completion) of €106m, representing c 6% of the current portfolio value of more than £1.5bn, with a rent roll of €6.3m (c 7% of the total). The company sees further good growth opportunities in the RoI, with the share of an otherwise growing portfolio rising to around 10%. The impact of growth in the RoI portfolio on the overall group performance is compounded by the higher yields that are available. PHP estimates Irish net initial yields to be currently c 6%, around 100bp above the yields currently available in the UK. The growing portfolio will also be part-funded with euro-denominated debt, where funding rates can currently be locked in for 10 years at a lower cost than in the UK, further increasing the income contribution after costs. The relative net initial yield and marginal funding rates currently suggest a c 3% net margin over costs for new investment in the RoI compared with around 1.2% in the UK (Exhibits 2 and 3).
Exhibit 2: Illustrative net margin over costs – RoI
|
Exhibit 3: Illustrative net margin over costs – UK
|

|

|
Source: PHP presentation, 18 October 2018
|
Source: PHP presentation, 18 October 2018
|
Exhibit 2: Illustrative net margin over costs – RoI
|
|
Source: PHP presentation, 18 October 2018
|
Exhibit 3: Illustrative net margin over costs – UK
|
|
Source: PHP presentation, 18 October 2018
|
There are some differences (discussed below) between lease terms and tenant covenants in the RoI and the UK (which are extremely low risk, with c 90% of rental income backed by the UK government directly or indirectly through GP reimbursement), but we think the difference is minimal. Euro-denominated debt will provide a natural hedge to much of the foreign exchange risk. Further growth in the RoI portfolio should continue to be an important driver of PHP’s growth over the next few years, while we also expect continuing growth in UK assets. Given the tightening in UK yields in recent years, an acceleration in UK open market rental growth (almost three-quarters of the total) would be especially beneficial in increasing income and stimulating new development, having failed to keep pace with the rise in land and building cost inflation. There were positive signs of movement in H118.
The fundamental drivers behind the demand for modern, purpose-built, flexible primary care facilities are similar in the RoI to those in the UK. The rate of population growth in the RoI is one of the fastest growing in the EU and is expected to increase by 20% to c six million by 2051. During this time, the proportion of the population over 65 is expected to increase by 150% by 2051 and the proportion over 80 by 270%. Chronic diseases and complex medical conditions are also increasing, as in the UK.
The mainstay of primary care in Ireland, as in the UK, is the GP, but in Ireland they have been fee charging ‘businesses’ and, as a result, private investment in primary care has been inhibited. To efficiently meet the growing need for healthcare provision, the government has developed various initiatives to modernise delivery, co-locating the provision of a range of care services including physiotherapists, dentists, mental health services, and pharmacies, as well as GPs, at a local level within modern PCCs. The Health Service Executive, the RoI equivalent of the NHS, is seeking to establish around 200 PCCs through the country and while PHP’s analysis indicates that there are currently around half this number, it believes that only a small number of these are modern, purpose-built facilities capable of delivering the planned increasing reliance on community-based primary care.
■
12 PCCs were scheduled to open in the current year and one more in 2019.
■
31 further locations are under construction or development, at an advanced planning stage, or underway for design/planning purposes. A further 44 are at an early planning stage.
Reflecting the multi-use nature of the PCCs, the RoI investments made by PHP to date are relatively large, with an average lot size of almost £12m, more than twice the group average. Using this as guide to the scale of investment that may be required to deliver the 75 assets that are under construction or being planned suggests a market-wide pool of potential investment opportunities that could be somewhere between £750m and £1bn. Access to funding is an essential ingredient in delivering the planned developments and the government takes a positive approach to private sector funding.
When reporting the interim results in July 2018, PHP continued to show a strong group-wide pipeline of potential acquisitions, totalling more than £175m, both in the UK and in the RoI. Specifically in the RoI, this included the three assets acquired for €38.6m in September (Navan Road, Celbridge and Newbridge) and a further €24m of assets in negotiation. PHP also expressed confidence in gaining further access to the pool of potential transactions through the strong relationships it has built with owners and developers.
Differences in lease terms and tenant covenants
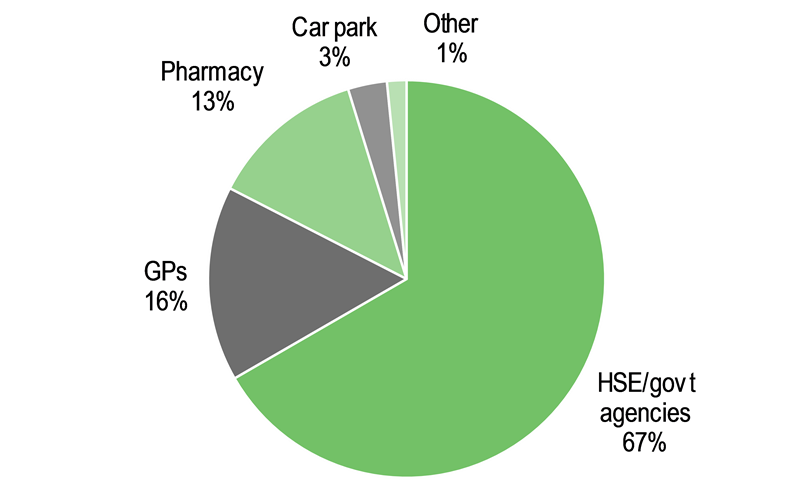
In the UK, around 90% of rent roll is funded directly or indirectly (through cost reimbursement) by the NHS, with much of the rest represented by co-located pharmacies. This is an extremely strong tenant covenant and although the position in the RoI is significantly different, we believe it is still very low risk. In the RoI, the HSE is the anchor tenant and is expected to account for 60–75% of rents. Exhibit 4 shows a breakdown of PHP’s current RoI rent roll, with the HSE representing 67% and the GPs and pharmacies representing much of the balance. Although the GPs are fee charging, lower income households qualify for a medical card, which provides them with free access to GP services, such that around half of all GP fee income is effectively paid by the HSE.
Exhibit 4: PHP’s current RoI rent roll mix
|
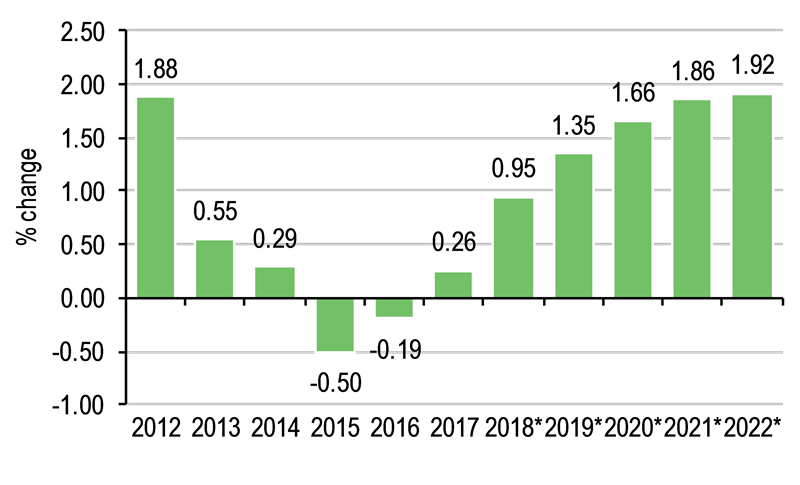
Exhibit 5: Trend in RoI CPI
|
|
|
Source: PHP presentation, 18 October 2018
|
Source: PHP, Central Statistical Office. Note: *Forecast.
|
Exhibit 4: PHP’s current RoI rent roll mix
|
|
Source: PHP presentation, 18 October 2018
|
Exhibit 5: Trend in RoI CPI
|
|
Source: PHP, Central Statistical Office. Note: *Forecast.
|
The other main differences between the RoI and the UK are mainly related to lease terms:
■
UK leases are effectively upwards-only, with the majority set on open market terms (at the option of the landlord) and the balance based on fixed uplifts or RPI inflation-linkage. In the RoI, rents are generally linked to CPI inflation compounded over a five-year period and in theory may go down as well as up. Exhibit 5 shows the trend in CPI forecast by the RoI Central Statistical Office, and we think a return to the short-lived negative CPI of 2015/16 is unlikely.
■
Lease lengths for the HSE and GPs are as long as in the UK, typically 25 years at inception. Given the young age of the RoI assets, we estimate an average lease term, weighted by area of a little over 22 years, compared with the 13.2 years reported for the group portfolio at H118.
■
Unlike the fully repairing and insuring leases that apply in the UK, in the RoI, under typical HSE leases, the landlord is responsible for the maintenance of the properties, but receives a CPI-linked fixed service level agreement contribution from which to pay for this. The GP’s pharmacy and other tenants pay their share of the maintenance and communal expenses through the service charge. Given that most of the buildings are brand new, we would not expect significant near-term maintenance expense.
■
A typical HSE lease also stipulates that the landlord must maintain a minimum number of GPs operating within the PCC and in theory could terminate the lease if the condition is not met. Given the attraction of the new PCCs to GPs compared with their often ill-suited home practices, we think it unlikely that PHP would be unable to maintain adequate GP numbers and in practice it seems highly unlikely that the HSE would hastily act to terminate the lease and incur the disruption of moving that this would entail.
We are not changing our estimates following the capital markets day but take considerable comfort in the prospects for continued accretive growth in the RoI. Our forecast for PHP typically include an expectation of c £100m of acquisitions annually, and for FY19 we have allowed for c 40% of this to be within the RoI.
The recent £22.8m UK acquisition of a modern keyworker accommodation property in Northumbria, let to the Northumbria Healthcare NHS Foundation Trust also falls within our property acquisition assumptions for the current year. It adds a large, good quality asset, with a strong covenant, with fixed rental uplifts and the unexpired lease of 29 years will increase the overall average.
Our forecasts also allow for the full conversion of the outstanding convertible bonds by the end of H119, and the recent adjustment to the conversion price (from 97.5p to 96.16p), a technical adjustment linked to cumulative dividends paid, has only a small impact on share count. There is currently £53.4m nominal of the convertible outstanding.
PHP’s long leases and secure covenant (with c 90% of rents derived directly or indirectly from the UK and RoI governments), based off a growing portfolio of good quality, modern, purpose-built primary healthcare assets, with no material linkage to the economic cycle, provide investors with considerably visibility over a growing stream of contracted rental income. PHP is now in its 22nd year of rising dividends, an unbroken record since listing. Moreover, as a result, healthcare property values have shown much less volatility than the broad commercial sector.
PHP has declared and paid four quarterly dividends in respect of FY18, an aggregate 5.40p per share, and with the recent market setback, the shares now offer a yield of 4.9%, and trade at only a modest (c 4%) premium to NAV. Our forecasts for further growth are underpinned by a full period contribution from recent acquisitions, continued deployment of the proceeds of April’s equity issue into a strong pipeline of opportunities, including those in the RoI, an increasingly positive outlook for rental growth and further opportunities to lower average borrowing costs.
Exhibit 6: Financial summary
£m |
2015 |
2016 |
2017 |
2018e |
2019e |
Year-end 31 December |
IFRS |
IFRS |
IFRS |
IFRS |
IFRS |
PROFIT & LOSS |
|
|
|
|
|
Net rental income |
62.3 |
66.6 |
71.3 |
75.9 |
81.4 |
Administrative expenses |
(6.8) |
(7.3) |
(8.7) |
(9.8) |
(10.2) |
EBITDA |
55.5 |
59.2 |
62.6 |
66.0 |
71.2 |
Other income and expenses |
0.0 |
0.0 |
0.0 |
0.0 |
0.0 |
Non-recurring items |
0.0 |
0.0 |
0.0 |
0.0 |
0.0 |
Net valuation gain on property portfolio |
39.8 |
20.7 |
64.5 |
31.2 |
24.1 |
Operating profit before financing costs |
95.2 |
79.9 |
127.1 |
97.2 |
95.3 |
Net Interest |
(33.7) |
(32.5) |
(31.6) |
(29.2) |
(27.8) |
Non-recurring finance income/expense |
0.0 |
0.0 |
0.0 |
0.0 |
0.0 |
Early loan repayment fees |
0.0 |
(0.0) |
0.0 |
0.0 |
0.0 |
Fair value gain/(loss) on interest rate derivatives and convertible bond, and swap amortisation |
(5.5) |
(3.7) |
(3.6) |
0.3 |
0.0 |
Profit Before Tax |
56.0 |
43.7 |
91.9 |
68.3 |
67.4 |
Tax |
0.0 |
0.0 |
0.0 |
0.0 |
0.0 |
Profit After Tax (FRS 3) |
56.0 |
43.7 |
91.9 |
68.3 |
67.4 |
Adjusted for the following: |
|
|
|
|
|
Net gain/(loss) on revaluation |
(39.8) |
(20.7) |
(64.5) |
(31.2) |
(24.1) |
Fair value gain/(loss) on derivatives & convertible bond |
5.5 |
3.7 |
3.6 |
(0.3) |
0.0 |
Profit on termination of finance lease |
0.0 |
0.0 |
0.0 |
0.0 |
0.0 |
Early loan repayment fees |
0.0 |
0.0 |
0.0 |
0.0 |
0.0 |
Issue costs of convertible bond |
0.0 |
0.0 |
0.0 |
0.0 |
0.0 |
EPRA basic earnings |
21.7 |
26.7 |
31.0 |
36.9 |
43.3 |
Period end number of shares (m) |
446.3 |
598.2 |
619.4 |
763.1 |
795.0 |
Average Number of Shares Outstanding (m) |
445.6 |
560.0 |
600.7 |
706.8 |
781.5 |
Fully diluted average number of shares outstanding (m) |
530.2 |
644.6 |
665.5 |
758.8 |
794.0 |
EPS - fully diluted (p) |
11.2 |
7.3 |
14.7 |
9.3 |
8.6 |
EPRA EPS (p) |
4.9 |
4.8 |
5.2 |
5.2 |
5.5 |
Diluted EPRA EPS (p) |
4.8 |
4.7 |
5.1 |
5.2 |
5.5 |
Dividend per share (p) |
5.000 |
5.125 |
5.250 |
5.400 |
5.500 |
Dividend cover |
97.6% |
100.0% |
98.7% |
101.3% |
104.9% |
BALANCE SHEET |
|
|
|
|
|
Non-current assets |
1,100.6 |
1,220.2 |
1,361.9 |
1,473.5 |
1,600.9 |
Investment properties |
1,100.6 |
1,220.2 |
1,361.9 |
1,472.8 |
1,600.2 |
Other non-current assets |
0.0 |
0.0 |
0.0 |
0.7 |
0.7 |
Current Assets |
7.0 |
8.4 |
10.5 |
6.4 |
10.5 |
Cash & equivalents |
2.9 |
5.1 |
3.8 |
1.6 |
5.3 |
Other current assets |
4.2 |
3.3 |
6.7 |
4.8 |
5.2 |
Current Liabilities |
(34.9) |
(32.3) |
(33.9) |
(67.1) |
(33.9) |
Current borrowing |
(0.9) |
(0.8) |
(0.8) |
(0.9) |
(0.9) |
Other current liabilities |
(34.0) |
(31.5) |
(33.1) |
(66.2) |
(33.0) |
Non-current liabilities |
(727.4) |
(697.1) |
(751.7) |
(636.8) |
(739.0) |
Non-current borrowings |
(696.9) |
(667.6) |
(729.6) |
(620.0) |
(722.2) |
Other non-current liabilities |
(30.6) |
(29.5) |
(22.1) |
(16.8) |
(16.8) |
Net Assets |
345.4 |
499.2 |
586.8 |
775.9 |
838.6 |
Derivative interest rate swaps |
35.3 |
33.3 |
24.5 |
16.1 |
16.1 |
Change in fair value of convertible bond |
10.9 |
12.5 |
12.3 |
12.3 |
12.3 |
EPRA net assets |
391.6 |
545.0 |
623.6 |
804.3 |
867.0 |
IFRS NAV per share (p) |
77.4 |
83.5 |
94.7 |
101.7 |
105.5 |
EPRA NAV per share (p) |
87.7 |
91.1 |
100.7 |
105.4 |
109.1 |
CASH FLOW |
|
|
|
|
|
Operating Cash Flow |
57.1 |
56.8 |
60.1 |
68.1 |
72.0 |
Net Interest & other financing charges |
(35.6) |
(45.9) |
(37.8) |
(32.8) |
(25.6) |
Tax |
0.0 |
(0.1) |
0.0 |
0.0 |
0.0 |
Acquisitions/disposals |
(29.5) |
(97.4) |
(75.4) |
(78.7) |
(103.4) |
Net proceeds from issue of shares |
(0.1) |
145.2 |
(0.1) |
111.1 |
0.0 |
Debt drawn/(repaid) |
20.0 |
(31.8) |
82.3 |
(35.0) |
100.0 |
Equity dividends paid (net of scrip) |
(21.1) |
(24.7) |
(29.8) |
(34.8) |
(39.2) |
Other |
0.0 |
0.0 |
(0.6) |
(0.1) |
0.0 |
Net change in cash |
(9.2) |
2.2 |
(1.3) |
(2.1) |
3.8 |
Opening cash & equivalents |
12.1 |
2.9 |
5.1 |
3.8 |
1.7 |
Closing net cash & equivalents |
2.9 |
5.1 |
3.8 |
1.7 |
5.4 |
Debt as per balance sheet |
(697.7) |
(668.4) |
(730.4) |
(620.9) |
(723.1) |
Unamortised borrowing costs |
(5.8) |
(4.8) |
(5.5) |
(4.2) |
(2.0) |
Net debt |
(700.7) |
(668.2) |
(732.1) |
(623.4) |
(719.6) |
Net LTV |
62.7% |
53.7% |
52.9% |
45.9% |
48.3% |
Source: Company accounts, Edison Investment Research
Edison is an investment research and advisory company, with offices in North America, Europe, the Middle East and AsiaPac. The heart of Edison is our world-renowned equity research platform and deep multi-sector expertise. At Edison Investment Research, our research is widely read by international investors, advisers and stakeholders. Edison Advisors leverages our core research platform to provide differentiated services including investor relations and strategic consulting. Edison is authorised and regulated by the Financial Conduct Authority. Edison Investment Research (NZ) Limited (Edison NZ) is the New Zealand subsidiary of Edison. Edison NZ is registered on the New Zealand Financial Service Providers Register (FSP number 247505) and is registered to provide wholesale and/or generic financial adviser services only. Edison Investment Research Inc (Edison US) is the US subsidiary of Edison and is regulated by the Securities and Exchange Commission. Edison Investment Research Limited (Edison Aus) [46085869] is the Australian subsidiary of Edison. Edison Germany is a branch entity of Edison Investment Research Limited [4794244]. www.edisongroup.com DISCLAIMER
Copyright 2018 Edison Investment Research Limited. All rights reserved. This report has been commissioned by Primary Health Properties and prepared and issued by Edison for publication globally. All information used in the publication of this report has been compiled from publicly available sources that are believed to be reliable, however we do not guarantee the accuracy or completeness of this report. Opinions contained in this report represent those of the research department of Edison at the time of publication. The securities described in the Investment Research may not be eligible for sale in all jurisdictions or to certain categories of investors. This research is issued in Australia by Edison Investment Research Pty Ltd (Corporate Authorised Representative (1252501) of Myonlineadvisers Pty Ltd (AFSL: 427484)) and any access to it, is intended only for "wholesale clients" within the meaning of the Corporations Act 2001 of Australia. The Investment Research is distributed in the United States by Edison US to major US institutional investors only. Edison US is registered as an investment adviser with the Securities and Exchange Commission. Edison US relies upon the "publishers' exclusion" from the definition of investment adviser under Section 202(a)(11) of the Investment Advisers Act of 1940 and corresponding state securities laws. As such, Edison does not offer or provide personalised advice. We publish information about companies in which we believe our readers may be interested and this information reflects our sincere opinions. The information that we provide or that is derived from our website is not intended to be, and should not be construed in any manner whatsoever as, personalised advice. Also, our website and the information provided by us should not be construed by any subscriber or prospective subscriber as Edison’s solicitation to effect, or attempt to effect, any transaction in a security. The research in this document is intended for New Zealand resident professional financial advisers or brokers (for use in their roles as financial advisers or brokers) and habitual investors who are “wholesale clients” for the purpose of the Financial Advisers Act 2008 (FAA) (as described in sections 5(c) (1)(a), (b) and (c) of the FAA). This is not a solicitation or inducement to buy, sell, subscribe, or underwrite any securities mentioned or in the topic of this document. This document is provided for information purposes only and should not be construed as an offer or solicitation for investment in any securities mentioned or in the topic of this document. A marketing communication under FCA Rules, this document has not been prepared in accordance with the legal requirements designed to promote the independence of investment research and is not subject to any prohibition on dealing ahead of the dissemination of investment research. Edison has a restrictive policy relating to personal dealing. Edison Group does not conduct any investment business and, accordingly, does not itself hold any positions in the securities mentioned in this report. However, the respective directors, officers, employees and contractors of Edison may have a position in any or related securities mentioned in this report. Edison or its affiliates may perform services or solicit business from any of the companies mentioned in this report. The value of securities mentioned in this report can fall as well as rise and are subject to large and sudden swings. In addition it may be difficult or not possible to buy, sell or obtain accurate information about the value of securities mentioned in this report. Past performance is not necessarily a guide to future performance. Forward-looking information or statements in this report contain information that is based on assumptions, forecasts of future results, estimates of amounts not yet determinable, and therefore involve known and unknown risks, uncertainties and other factors which may cause the actual results, performance or achievements of their subject matter to be materially different from current expectations. For the purpose of the FAA, the content of this report is of a general nature, is intended as a source of general information only and is not intended to constitute a recommendation or opinion in relation to acquiring or disposing (including refraining from acquiring or disposing) of securities. The distribution of this document is not a “personalised service” and, to the extent that it contains any financial advice, is intended only as a “class service” provided by Edison within the meaning of the FAA (ie without taking into account the particular financial situation or goals of any person). As such, it should not be relied upon in making an investment decision. To the maximum extent permitted by law, Edison, its affiliates and contractors, and their respective directors, officers and employees will not be liable for any loss or damage arising as a result of reliance being placed on any of the information contained in this report and do not guarantee the returns on investments in the products discussed in this publication. FTSE International Limited (“FTSE”) © FTSE 2018. “FTSE®” is a trade mark of the London Stock Exchange Group companies and is used by FTSE International Limited under license. All rights in the FTSE indices and/or FTSE ratings vest in FTSE and/or its licensors. Neither FTSE nor its licensors accept any liability for any errors or omissions in the FTSE indices and/or FTSE ratings or underlying data. No further distribution of FTSE Data is permitted without FTSE’s express written consent. |
Frankfurt +49 (0)69 78 8076 960 Schumannstrasse 34b 60325 Frankfurt Germany |
London +44 (0)20 3077 5700 280 High Holborn London, WC1V 7EE United Kingdom |
New York +1 646 653 7026 295 Madison Avenue, 18th Floor 10017, New York US |
Sydney +61 (0)2 8249 8342 Level 4, Office 1205 95 Pitt Street, Sydney NSW 2000, Australia |
Frankfurt +49 (0)69 78 8076 960 Schumannstrasse 34b 60325 Frankfurt Germany |
London +44 (0)20 3077 5700 280 High Holborn London, WC1V 7EE United Kingdom |
New York +1 646 653 7026 295 Madison Avenue, 18th Floor 10017, New York US |
Sydney +61 (0)2 8249 8342 Level 4, Office 1205 95 Pitt Street, Sydney NSW 2000, Australia |
|
Edison is an investment research and advisory company, with offices in North America, Europe, the Middle East and AsiaPac. The heart of Edison is our world-renowned equity research platform and deep multi-sector expertise. At Edison Investment Research, our research is widely read by international investors, advisers and stakeholders. Edison Advisors leverages our core research platform to provide differentiated services including investor relations and strategic consulting. Edison is authorised and regulated by the Financial Conduct Authority. Edison Investment Research (NZ) Limited (Edison NZ) is the New Zealand subsidiary of Edison. Edison NZ is registered on the New Zealand Financial Service Providers Register (FSP number 247505) and is registered to provide wholesale and/or generic financial adviser services only. Edison Investment Research Inc (Edison US) is the US subsidiary of Edison and is regulated by the Securities and Exchange Commission. Edison Investment Research Limited (Edison Aus) [46085869] is the Australian subsidiary of Edison. Edison Germany is a branch entity of Edison Investment Research Limited [4794244]. www.edisongroup.com DISCLAIMER
Copyright 2018 Edison Investment Research Limited. All rights reserved. This report has been commissioned by Primary Health Properties and prepared and issued by Edison for publication globally. All information used in the publication of this report has been compiled from publicly available sources that are believed to be reliable, however we do not guarantee the accuracy or completeness of this report. Opinions contained in this report represent those of the research department of Edison at the time of publication. The securities described in the Investment Research may not be eligible for sale in all jurisdictions or to certain categories of investors. This research is issued in Australia by Edison Investment Research Pty Ltd (Corporate Authorised Representative (1252501) of Myonlineadvisers Pty Ltd (AFSL: 427484)) and any access to it, is intended only for "wholesale clients" within the meaning of the Corporations Act 2001 of Australia. The Investment Research is distributed in the United States by Edison US to major US institutional investors only. Edison US is registered as an investment adviser with the Securities and Exchange Commission. Edison US relies upon the "publishers' exclusion" from the definition of investment adviser under Section 202(a)(11) of the Investment Advisers Act of 1940 and corresponding state securities laws. As such, Edison does not offer or provide personalised advice. We publish information about companies in which we believe our readers may be interested and this information reflects our sincere opinions. The information that we provide or that is derived from our website is not intended to be, and should not be construed in any manner whatsoever as, personalised advice. Also, our website and the information provided by us should not be construed by any subscriber or prospective subscriber as Edison’s solicitation to effect, or attempt to effect, any transaction in a security. The research in this document is intended for New Zealand resident professional financial advisers or brokers (for use in their roles as financial advisers or brokers) and habitual investors who are “wholesale clients” for the purpose of the Financial Advisers Act 2008 (FAA) (as described in sections 5(c) (1)(a), (b) and (c) of the FAA). This is not a solicitation or inducement to buy, sell, subscribe, or underwrite any securities mentioned or in the topic of this document. This document is provided for information purposes only and should not be construed as an offer or solicitation for investment in any securities mentioned or in the topic of this document. A marketing communication under FCA Rules, this document has not been prepared in accordance with the legal requirements designed to promote the independence of investment research and is not subject to any prohibition on dealing ahead of the dissemination of investment research. Edison has a restrictive policy relating to personal dealing. Edison Group does not conduct any investment business and, accordingly, does not itself hold any positions in the securities mentioned in this report. However, the respective directors, officers, employees and contractors of Edison may have a position in any or related securities mentioned in this report. Edison or its affiliates may perform services or solicit business from any of the companies mentioned in this report. The value of securities mentioned in this report can fall as well as rise and are subject to large and sudden swings. In addition it may be difficult or not possible to buy, sell or obtain accurate information about the value of securities mentioned in this report. Past performance is not necessarily a guide to future performance. Forward-looking information or statements in this report contain information that is based on assumptions, forecasts of future results, estimates of amounts not yet determinable, and therefore involve known and unknown risks, uncertainties and other factors which may cause the actual results, performance or achievements of their subject matter to be materially different from current expectations. For the purpose of the FAA, the content of this report is of a general nature, is intended as a source of general information only and is not intended to constitute a recommendation or opinion in relation to acquiring or disposing (including refraining from acquiring or disposing) of securities. The distribution of this document is not a “personalised service” and, to the extent that it contains any financial advice, is intended only as a “class service” provided by Edison within the meaning of the FAA (ie without taking into account the particular financial situation or goals of any person). As such, it should not be relied upon in making an investment decision. To the maximum extent permitted by law, Edison, its affiliates and contractors, and their respective directors, officers and employees will not be liable for any loss or damage arising as a result of reliance being placed on any of the information contained in this report and do not guarantee the returns on investments in the products discussed in this publication. FTSE International Limited (“FTSE”) © FTSE 2018. “FTSE®” is a trade mark of the London Stock Exchange Group companies and is used by FTSE International Limited under license. All rights in the FTSE indices and/or FTSE ratings vest in FTSE and/or its licensors. Neither FTSE nor its licensors accept any liability for any errors or omissions in the FTSE indices and/or FTSE ratings or underlying data. No further distribution of FTSE Data is permitted without FTSE’s express written consent. |
Frankfurt +49 (0)69 78 8076 960 Schumannstrasse 34b 60325 Frankfurt Germany |
London +44 (0)20 3077 5700 280 High Holborn London, WC1V 7EE United Kingdom |
New York +1 646 653 7026 295 Madison Avenue, 18th Floor 10017, New York US |
Sydney +61 (0)2 8249 8342 Level 4, Office 1205 95 Pitt Street, Sydney NSW 2000, Australia |
Frankfurt +49 (0)69 78 8076 960 Schumannstrasse 34b 60325 Frankfurt Germany |
London +44 (0)20 3077 5700 280 High Holborn London, WC1V 7EE United Kingdom |
New York +1 646 653 7026 295 Madison Avenue, 18th Floor 10017, New York US |
Sydney +61 (0)2 8249 8342 Level 4, Office 1205 95 Pitt Street, Sydney NSW 2000, Australia |
|






