Last close As at 05/08/2026
GBP4.98
▲ −1.00 (−0.20%)
Market capitalisation
GBP990m
Research: Investment Companies
Invesco Asia Trust
Written by
Invesco Asia Trust |
Quality, value and growth across Asia |
Investment trusts |
26 November 2015 |
Share price/discount performance
Three-year cumulative perf. graph
Gearing
Analysts
|
|||||||||||||||||||||||||||||||||||||||||||||||||||||||||||||||||||||||||||||||||||||
Invesco Asia Trust (IAT) has marked the year of its 20th anniversary with the appointment of Ian Hargreaves as sole manager and the adoption of the MSCI AC Asia ex-Japan index as its benchmark. The trust continues to seek capital growth from a portfolio of attractively valued Asian companies, and retains a small weighting in Australia. Long-term performance remains strong in both absolute and relative terms; while the sharp summer sell-off that began in China has had an impact on short-term numbers, the manager is finding growing companies on attractive valuations as a result. IAT has a 2.1% yield and an established record of year-on-year dividend growth.
12 months ending |
Total share price return (%) |
Total NAV return (%) |
Benchmark* (%) |
MSCI World (%) |
FTSE All-Share (%) |
31/10/11 |
(4.3) |
(0.6) |
(7.5) |
1.3 |
0.6 |
31/10/12 |
2.7 |
3.1 |
8.5 |
10.3 |
9.8 |
31/10/13 |
14.8 |
14.7 |
13.3 |
26.8 |
22.8 |
31/10/14 |
15.9 |
15.1 |
3.5 |
9.7 |
1.0 |
31/10/15 |
(3.6) |
(3.7) |
(6.5) |
6.0 |
3.0 |
Note: Twelve-month rolling discrete £-adjusted total return performance. *Benchmark is MSCI AC Asia Pacific ex-Japan index until 30/4/15 and MSCI AC Asia ex-Japan thereafter.
Investment strategy: Focus on undervalued leaders
From 1 January 2015 IAT has been managed solely by Ian Hargreaves, although the manager is still able to draw on the input of former co-manager Stuart Parks, Invesco Perpetual’s head of Asian equities, as well as the wider Asian team. The investment approach combines stock picking with top-down macro views to build a portfolio of c 60 stocks that the manager feels have strong competitive advantages and are undervalued compared with their growth prospects. Regular visits to the region help the manager identify high-conviction investment ideas, and the portfolio is constructed with minimal consideration of benchmark weightings.
Market outlook: Asian valuations favourable
Asia has underperformed Western markets in recent years, accelerating in the late summer on fears over the outlook for growth in China. Uncertainty over the timing, pace and level of US and UK interest rate increases could see investors continuing to favour developed markets in the near term; however, valuations in many Asian markets look favourable in a global context and there may be opportunities for outperformance through careful stock picking.
Valuation: Discount steady within medium-term range
At 23 November, IAT’s shares traded at a 10.7% discount to ex-income net asset value, broadly in line with averages over one, three and five years. Following a widening at the start of 2012, the discount has largely remained in a relatively tight range of 8-10% as investors have tended to favour developed over emerging markets; given IAT’s solid performance record, there is scope for it to narrow should sentiment towards Asia improve. The board targets an average discount of maximum c 10% on an ex-income basis, and is active in pursuing this through buybacks, providing confidence that any material widening from current levels is unlikely.
Invesco Asia Trust is a research client of Edison Investment Research Limited
Exhibit 1: Trust at a glance
Investment objective and fund background |
Recent developments |
||||||||||||||||||||||||||||||||||||||||||||||||||||||||||||||||||||||
IAT’s objective is to provide long-term capital growth by investing in a diversified portfolio of Asian companies. On 1 May 2015 the trust adopted a new benchmark, MSCI AC Asia ex-Japan, in place of the former benchmark, MSCI AC Asia Pacific ex-Japan. While the new benchmark excludes Australasia, the trust may still invest in these markets. |
■ 29 June 2015: Annual report for the 12 months ended 30 April. NAV TR +28.3% versus +22.7% for benchmark. Share price TR +29.4%. ■ 29 June 2015: Dividend of 3.65p per share declared for FY15, a 5.8% increase on the FY14 dividend. ■ 1 May 2015: Adoption of new benchmark. |
||||||||||||||||||||||||||||||||||||||||||||||||||||||||||||||||||||||
Forthcoming |
Capital structure |
Fund details |
|||||||||||||||||||||||||||||||||||||||||||||||||||||||||||||||||||||
AGM |
August 2016 |
Ongoing charges |
1.03% (31 Oct 2015) |
Group |
Invesco Asset Management Ltd |
||||||||||||||||||||||||||||||||||||||||||||||||||||||||||||||||||
Interim results |
December 2015 |
Net cash |
0.1% |
Managers |
Ian Hargreaves |
||||||||||||||||||||||||||||||||||||||||||||||||||||||||||||||||||
Year end |
30 April |
Annual mgmt fee |
0.75% of net assets |
Address |
125 London Wall |
||||||||||||||||||||||||||||||||||||||||||||||||||||||||||||||||||
Dividend paid |
July/August |
Performance fee |
None |
||||||||||||||||||||||||||||||||||||||||||||||||||||||||||||||||||||
Launch date |
July 1995 |
Trust life |
Indefinite |
Phone |
+44 (0) 20 3753 1000 |
||||||||||||||||||||||||||||||||||||||||||||||||||||||||||||||||||
Continuation vote |
Three-yearly, next 2017 |
Loan facilities |
£20m multi-currency |
Website |
|||||||||||||||||||||||||||||||||||||||||||||||||||||||||||||||||||
Dividend policy and history |
Share buyback policy and history |
||||||||||||||||||||||||||||||||||||||||||||||||||||||||||||||||||||||
Dividends are paid annually in July/August. Income is a by-product of stock selection and there is no yield target. |
Renewed annually, the trust has authority to purchase up to 14.99% and allot up to 5% of issued share capital. The chart below includes a tender offer in 2013 and the exercise of subscription shares in 2011 and 2012. |
||||||||||||||||||||||||||||||||||||||||||||||||||||||||||||||||||||||
|
|
||||||||||||||||||||||||||||||||||||||||||||||||||||||||||||||||||||||
Shareholder base (as 31 October 2015) |
Geographical allocation of portfolio (as at 31 October 2015) |
||||||||||||||||||||||||||||||||||||||||||||||||||||||||||||||||||||||
|
|
||||||||||||||||||||||||||||||||||||||||||||||||||||||||||||||||||||||
Top 10 holdings (as at 31 October 2015) |
|||||||||||||||||||||||||||||||||||||||||||||||||||||||||||||||||||||||
|
|||||||||||||||||||||||||||||||||||||||||||||||||||||||||||||||||||||||
Source: Invesco Asia Trust, Edison Investment Research, Morningstar, Bloomberg. Note: *N/A where not in 30 April 2015 top 10.
**Hutchison Whampoa at 30 April.
Asian market outlook: Pockets of value after sell-off
Fears over growth in China and arguably ill-judged government intervention in the country’s stock market caused a global sell-off in the late summer. As can be seen in the chart in Exhibit 2 below, Asian markets fell more sharply than the UK and world indices, although the pace of recovery in recent weeks has been similar. While still ahead of developed markets over 10 years, Asian markets now lag substantially in total return terms over five years, having failed to make up ground lost in the ‘taper tantrum’ of mid-2013. Given that US and UK interest rates have still not begun to normalise, the uncertainty that led to this underperformance may take some time to abate.
While Asian company earnings have also failed to deliver on expectations (see The manager’s view below), economic growth in the region still outstrips forecasts for the rest of the world. The IMF’s expected GDP growth of 6.3% for China in 2016 may or may not prove over-bullish, but a forecast of 6.4% for emerging and developing Asia as a whole, with 7.5% growth expected for India, looks favourable against a 2.2% forecast for advanced economies next year.
|
Exhibit 2: Market valuation and performance |
|||||||||||||||||||||||||||||||||||||||||
Five-year performance of Asia ex-Japan, UK and World indices (all in £) |
Valuation metrics (MSCI indices, as at 30 October 2015) |
||||||||||||||||||||||||||||||||||||||||
|
|
||||||||||||||||||||||||||||||||||||||||
|
Source: Thomson Datastream, MSCI, Edison Investment Research |
|||||||||||||||||||||||||||||||||||||||||
Meanwhile, valuation metrics in major Asian markets (see table above) are in most cases below world averages (India is the notable exception here) and dividend yields for most markets are above the world average, suggesting that even if earnings from Asian companies fall short of expectations again next year, income could provide an attractive element of return in a world where interest rates in developed markets remain at multi-year lows.
Fund profile: Established Asian specialist
Invesco Asia Trust (IAT) was launched in 1995 to seek long-term capital growth by investing in companies in the Asia Pacific region. Until 30 April 2015 its benchmark was the MSCI AC Asia Pacific ex-Japan index, which includes a c 20% exposure to Australia. The new benchmark, MSCI AC Asia ex-Japan, excludes Australasia, although IAT may still invest there (Australian exposure is currently c 4%). The trust is managed by Ian Hargreaves at Invesco Perpetual; Hargreaves has been sole manager since 1 January 2015 and was previously co-manager with Stuart Parks. IAT has a relatively concentrated portfolio of c 60 stocks and is unconstrained by its benchmark, although it does have some broad investment limits: no company may make up more than 10% of total assets, or 15% for companies in the same group; collective investments, warrants/options and unquoted companies are also all limited to 10%. Gearing may be employed in a working range of up to 15% (there is a formal cap at 25%). Continuation votes are held on a three-yearly basis unless shareholders vote to skip them; the last vote, due to be held in 2014, was waived and the next vote is scheduled for the 2017 AGM.
The fund manager: Ian Hargreaves
The manager’s view: Chances to profit from misperceptions
Hargreaves sees a period of below-forecast earnings growth as the principal reason for Asian market underperformance over recent years. This is partly due to a perception gap: Asian company earnings have been better or similar to those in the West, but have fallen short of over-bullish projections, leading to year-on-year downgrades. Historically, Asia has shown markedly superior growth, and earnings growth that is only in line with developed markets means Western investors may demand a higher risk premium or valuation discount to tempt them away from their home shores.
A number of factors underlie the lower recent growth. A sluggish global economy has depressed trade, exports and commodity demand. Rising levels of consumer and corporate debt also act as a brake on growth, although Hargreaves says a repeat of the 1997 Asian debt crisis is unlikely given the lower level of US dollar borrowings; local currency debt gives Asian economies more levers in the event of problems arising. The manager sees scope to make money through careful stock selection in the current market environment, with cyclical opportunities likely as growth ebbs and flows in an environment of generally subdued global economic growth.
Much investor attention is currently focused on China’s slowing economy, though Hargreaves’ view is less negative than those of many. China has a current account surplus, is a net creditor to the rest of the world and has a fairly closed capital account, which means there is limited scope for a crisis caused by capital outflows. Loan-to-deposit ratios for Chinese banks are at less than 100%. While consumption has been hit by the industrial slowdown, consumers are not over-indebted, wage growth is solid and unemployment is broadly stable. Residential property has staged a recovery over the past six months and there is also scope for a stabilisation in construction as the country works through excess inventory.
Hargreaves views 5.5-6% GDP growth for China as realistic; while this is below the current IMF forecast, it is higher than many estimates. “The idea of a Chinese ‘hard landing’ misses the point,” he says, pointing out that while some parts of the Chinese economy are suffering, others are not. Because of the negativity towards the market, there are opportunities to buy growth stocks at cheap valuations. The manager says that areas such as Chinese internet stocks have performed well and should continue to do so. “It’s a big economy and there are areas that are doing well,” he adds.
Asset allocation
Investment process: Contextual approach to stock picking
IAT’s manager blends bottom-up stock picking with an appreciation of the macro factors driving Asian and global markets to construct a relatively concentrated portfolio of c 60 stocks. Hargreaves is based at Invesco Perpetual’s Henley-on-Thames HQ but travels regularly to Asia to meet with holdings and assess potential new stocks. Hargreaves makes use of internal and external research resources to analyse balance sheets and identify business drivers and sources of risk and return for individual companies, as well as taking a view on the attractiveness of valuations relative to peers and to history. Top-down analysis is also undertaken to understand political and economic factors at play in the region, as these can have a significant influence on the competitive landscape.
Positions are taken and sized according to conviction and without reference to benchmark weights: by way of illustration, the second-largest holding, NetEase, makes up c 5% of the portfolio but is absent from the benchmark. The manager may trim or exit holdings where he feels valuations are becoming stretched, or may top up where he feels negative moves have been overdone. Dividends are not a primary focus, but the portfolio’s yield is among the highest in its peer group and largely in line with that of the index.
Current portfolio positioning
At 31 October there were 57 stocks in IAT’s portfolio, fewer than at our last note in February, and below the 66-stock average for the Asia ex-Japan peer group. The largest geographical exposures were to China, Hong Kong and South Korea, which between them made up 62.6% of the portfolio at 31 October. Hong Kong was also the biggest overweight relative to the benchmark.
Hargreaves says aggregate Hong Kong/China exposure has risen over the past six months, partly through an increase in the weighting to China Mobile (now in the top 10), which has good free cash flow growth and is benefiting from the 4G cycle in China, where most people use mobile devices as their primary means of internet access. Other stock picks include Minth and EVA Precision Industrial Holdings; the former is a small-cap auto parts maker with operations in Germany and the latter makes moulds and parts for photocopiers, but is also branching out into car body parts.
India is another small overweight and while the manager has taken some profits from UPL (a former top 10 holding) on valuation grounds, he has bought Bangalore-based Sobha, a small-cap property developer that is well placed for expected falls in interest rates and inflation in India, and Tata Motors, which should benefit from new Land Rover and Jaguar product cycles. Hargreaves says Tata is currently on a 7x P/E with potential to move to a premium to the global auto sector.
Exhibit 3: Portfolio sector exposure vs benchmark (% unless stated)
Portfolio end Oct 2015 |
Portfolio end Apr 2015 |
Change |
MSCI AC Asia ex-Jp weight |
Active weight vs index (% pts) |
Trust weight/ index weight (x) |
|
Info technology |
25.5 |
22.8 |
2.7 |
21.1 |
4.4 |
1.2 |
Consumer disc. |
12.1 |
10.1 |
2.0 |
8.2 |
3.9 |
1.5 |
Industrials |
12.1 |
14.2 |
-2.1 |
9.5 |
2.6 |
1.3 |
Materials |
6.1 |
9.0 |
-2.9 |
4.4 |
1.7 |
1.4 |
Energy |
4.1 |
4.5 |
-0.4 |
4.2 |
-0.1 |
1.0 |
Real estate |
6.5 |
3.8 |
2.7 |
6.8 |
-0.3 |
1.0 |
Financials |
25.6 |
28.8 |
-3.2 |
26.2 |
-0.6 |
1.0 |
Telecoms |
5.8 |
4.9 |
0.9 |
6.9 |
-1.1 |
0.8 |
Utilities |
1.9 |
1.6 |
0.3 |
4.4 |
-2.5 |
0.4 |
Healthcare |
0.0 |
0.0 |
0.0 |
2.7 |
-2.7 |
0.0 |
Consumer staples |
0.3 |
0.3 |
0.0 |
5.7 |
-5.4 |
0.1 |
Cash |
0.1 |
0.0 |
0.1 |
0.0 |
0.1 |
N/A |
100.0 |
100.0 |
100.0 |
Source: Invesco Asia Trust, Edison Investment Research. Note: Ranked by active weight, excluding cash.
IAT has changed its benchmark from MSCI AC Asia Pacific ex-Japan (21% in Australia at 30 October) to MSCI AC Asia ex-Japan, which excludes Australia. The trust retains a small (3.6%) weighting to the country, with some resource stocks and government outsourcer Transfield; Hargreaves has sold his Australian financial holdings and reduced the weight from c 10% at the end of 2014.
Turnover remains low at c 30% for FY15, with more stocks sold than bought. There is currently no gearing, although the manager has run down the 4% net cash he held at the 30 April year end.
Exhibit 4: Portfolio geographical exposure vs benchmark (% unless stated)
Portfolio end Oct 2015 |
Portfolio end Apr 2015 |
Change |
MSCI AC Asia ex-Jp weight |
Active weight vs index (% pts) |
Trust weight/ index weight (x) |
|
Hong Kong |
19.6 |
20.5 |
-0.9 |
12.8 |
6.8 |
1.5 |
Australia |
3.6 |
4.8 |
-1.2 |
0.0 |
3.6 |
N/A |
India |
13.1 |
12.7 |
0.4 |
9.9 |
3.2 |
1.3 |
Indonesia |
3.9 |
3.4 |
0.5 |
2.7 |
1.2 |
1.4 |
Philippines |
2.2 |
1.8 |
0.4 |
1.7 |
0.6 |
1.3 |
South Korea |
19.1 |
22.0 |
-2.9 |
18.9 |
0.2 |
1.0 |
Thailand |
0.9 |
1.0 |
-0.1 |
2.6 |
-1.7 |
0.3 |
Taiwan |
11.4 |
10.0 |
1.4 |
14.5 |
-3.1 |
0.8 |
Singapore |
2.3 |
2.5 |
-0.2 |
5.4 |
-3.1 |
0.4 |
Malaysia |
0.0 |
0.0 |
0.0 |
3.6 |
-3.6 |
0.0 |
China |
23.9 |
21.3 |
2.6 |
28.0 |
-4.1 |
0.9 |
100.0 |
100.0 |
100.0 |
Source: Invesco Asia Trust, Edison Investment Research. Note: Ranked by active weight, excluding cash.
Performance: Strong record versus benchmark
|
Exhibit 5: Investment trust performance to 31 October 2015 |
|||||||||
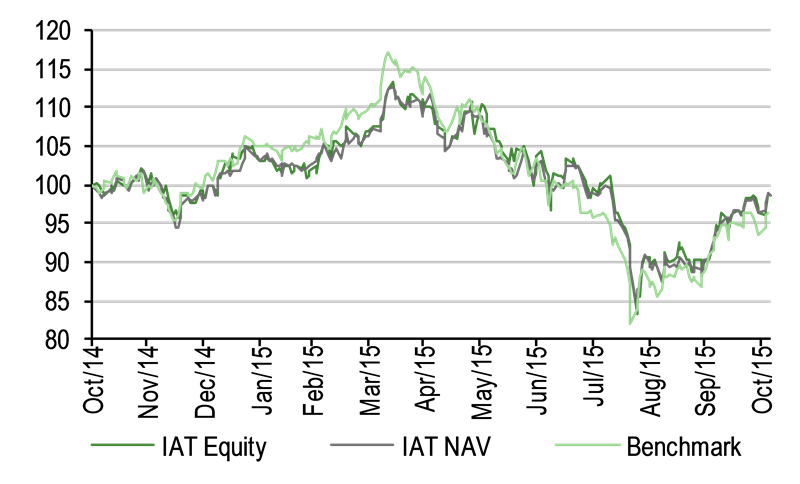
Price, NAV and benchmark total return performance, one-year rebased |
Price, NAV and benchmark total return performance (%) |
||||||||
|
|
||||||||
|
Source: Thomson Datastream, Edison Investment Research. Note: Three-, five- and 10-year performance figures annualised. Benchmark is MSCI AC Asia Pacific ex-Japan until 30 April 2015 and MSCI AC Asia ex-Japan thereafter. |
|||||||||
|
Exhibit 6: Share price and NAV total return performance, versus indices (percentage points) |
|||||||||
|
One month |
Three months |
Six months |
One year |
Three years |
Five years |
10 years |
||
Price relative to benchmark |
1.9 |
(0.8) |
5.2 |
3.2 |
17.1 |
14.7 |
25.2 |
||
NAV relative to benchmark |
1.6 |
(0.3) |
6.7 |
3.0 |
16.0 |
18.6 |
28.3 |
||
Price relative to FTSE All-Share |
2.4 |
0.5 |
(7.8) |
(6.4) |
0.5 |
(10.6) |
58.6 |
||
NAV relative to FTSE All-Share |
2.1 |
1.0 |
(6.5) |
(6.5) |
(0.4) |
(7.6) |
62.5 |
||
|
Source: Thomson Datastream, Edison Investment Research. Note: Data to end October 2015. Geometric calculation. |
|||||||||
In a difficult period for Asian equities, IAT has retained its record of above-benchmark performance over almost all periods under consideration. (Figures in Exhibits 4, 5 and 6 take account of the change in benchmark from MSCI AC Asia Pacific ex-Japan to MSCI AC Asia ex-Japan, which excludes Australia, as of 1 May 2015.) Over 10 years the trust has produced annualised share price and NAV total returns in excess of 10%, although returns are lower in the post-financial crisis era of quantitative easing, which has boosted returns from developed markets, leading to IAT underperforming the MSCI World index over most periods of five years and less (Exhibit 6). The medium-term trend of outperformance versus the benchmark can be seen in Exhibit 7; this accelerated in the first half of 2015 before reversing somewhat over the late summer sell-off, but has begun to re-establish itself in the most recent period. IAT’s manager expects markets to continue to be challenging in the near term, but says that there will continue to be opportunities to make money through stock selection. Exhibit 7: NAV performance relative to benchmark over three years |
|||||||||
|
|||||||||
|
Source: Thomson Datastream, Edison Investment Research |
|||||||||
Discount: Steady within long-term range
At 23 November, IAT’s shares traded at a 10.7% discount to ex-income net asset value. Over the medium term the discount has been largely in a range of 8-10% and the current level is broadly in line with the one-, three- and five-year averages of 9.5%, 9.8% and 9.4% respectively. This is also in line with the average discount for the AIC Asia Pacific ex-Japan sector (excluding specialist income funds), which stood at 10.7% at 16 November.
The board’s objective is to keep the discount below 10%, and a tender offer may be triggered if the average discount over a financial year exceeds this level. The last tender offer was in 2013; in FY15 the average discount was 9.5%. Share buybacks may also be used on an ad hoc basis to manage the discount; so far in calendar 2015 1.6m shares have been bought back at a cost of £3.03m.
|
Exhibit 8: Share price discount to NAV (excluding income) over three years (%) |
|
|
Source: Thomson Datastream, Edison Investment Research. |
Capital structure and fees
A conventional investment trust with one class of share, IAT had 87.01m ordinary shares in issue at 23 November 2015. The trust has a revolving multi-currency credit facility of £20m, with an interest rate of LIBOR plus 0.85%. The board has set a working limit of 15% on gearing, but IAT has been largely ungeared recently; net cash stood at 4% in April, but had fallen to 0.1% at 31 October.
Invesco Fund Managers provides investment management and administration services to IAT and receives an annual management fee of 0.75% of the value of total assets (excluding any funds managed by Invesco) less current liabilities, calculated and paid quarterly. Fees are charged 25% to income and 75% to capital. There is no performance fee. At 31 October 2015 ongoing charges were 1.03%.
Dividend policy and record
IAT’s objective is to achieve long-term capital growth, with no specific income requirement. As a result, income received is a product of stock selection. However, IAT has raised or maintained its own dividend every year since 2001, with a compound annual growth rate of 5.0% over the past five years, well ahead of the rate of UK inflation. Dividends are paid annually in June or early July. The FY15 dividend of 3.65p per share was fully covered by income and represented a 5.8% increase on the previous year’s dividend. At the FY15 year end, the trust had a revenue reserve of £5.89m, a 4.8% increase on the previous year and more than sufficient to cover the whole annual dividend if required. Based on IAT’s FY15 dividend and the 23 November share price of 178.0p, the trust currently yields 2.1%.
Peer group comparison
Exhibit 9 below shows IAT’s AIC Asia Pacific ex-Japan peer group, excluding three income-focused funds and one fund focusing on unquoted investments. Within this group, IAT’s NAV total return performance is above average over one, three and five years, ranking fifth, third and fourth respectively out of 12. Risk-adjusted performance as measured by the Sharpe ratio is also above the weighted average over three years. The dividend yield is the third-highest of the group. Ongoing charges are broadly average, as is the discount, and the trust’s small net cash position is below the sector average gearing level. Currently, half the funds in the group are slightly net cash and half have some level of gearing.
Exhibit 9: Asia Pacific ex-Japan peer group as at 16 November 2015
% unless stated |
Market Cap £m |
NAV TR 1 Year |
NAV TR 3 Year |
NAV TR 5 Year |
Ongoing Charge |
Perf. fee |
Discount (ex-par) |
Net Gearing |
Dividend yield (%) |
Sharpe 1y (NAV) |
Sharpe 3y (NAV) |
Invesco Asia Trust |
153.3 |
-6.9 |
25.1 |
24.7 |
1.1 |
No |
-11.2 |
98.0 |
2.1 |
-0.2 |
0.6 |
Aberdeen Asian Smaller |
271.2 |
-15.7 |
3.5 |
37.6 |
1.5 |
No |
-12.6 |
112.0 |
1.8 |
-1.1 |
0.1 |
Aberdeen New Dawn |
184.5 |
-15.4 |
-2.7 |
-0.4 |
1.1 |
No |
-12.2 |
112.0 |
2.5 |
-0.7 |
|
Asian Total Return Inv Company |
136.7 |
-2.4 |
12.6 |
3.7 |
1.1 |
Yes |
-9.2 |
108.0 |
1.7 |
0.1 |
0.4 |
Edinburgh Dragon |
456.4 |
-13.5 |
-1.8 |
4.1 |
1.2 |
No |
-11.8 |
111.0 |
1.3 |
-0.5 |
0.1 |
Fidelity Asian Values |
157.6 |
-0.2 |
30.3 |
23.7 |
1.5 |
No |
-11.5 |
98.0 |
0.9 |
0.1 |
0.6 |
JPMorgan Asian |
203.2 |
-5.6 |
13.5 |
-3.2 |
0.9 |
No |
-11.7 |
101.0 |
1.0 |
0.0 |
0.4 |
Martin Currie Asia Unconstrained |
98.3 |
-12.7 |
1.5 |
2.0 |
1.2 |
No |
-14.1 |
99.0 |
2.9 |
-0.5 |
0.1 |
Pacific Assets |
213.3 |
-5.2 |
29.6 |
49.7 |
1.3 |
No |
-1.7 |
89.0 |
1.4 |
0.0 |
0.8 |
Pacific Horizon |
106.8 |
-10.6 |
10.9 |
9.8 |
1.0 |
No |
-10.6 |
92.0 |
0.2 |
-0.4 |
0.3 |
Schroder Asia Pacific |
440.4 |
-7.1 |
12.8 |
31.3 |
1.1 |
No |
-10.7 |
100.0 |
1.1 |
-0.1 |
0.4 |
Scottish Oriental Smaller Cos |
236.0 |
-9.0 |
20.2 |
43.1 |
1.0 |
Yes |
-9.6 |
95.0 |
1.5 |
-0.4 |
0.6 |
Sector weighted average |
-9.2 |
10.7 |
18.6 |
1.2 |
0.0 |
-10.7 |
103.2 |
1.5 |
-0.3 |
0.3 |
|
IAT rank in sector |
8 |
5 |
3 |
4 |
6 |
5 |
8 |
3 |
6 |
3 |
Source: Morningstar, Edison Investment Research. Note: TR=total return. Sharpe ratio is a measure of risk-adjusted return. The ratios shown are calculated by Morningstar for the past 12- and 36-month periods by dividing a fund’s annualised excess returns over the risk-free rate by its annualised standard deviation. Net gearing is total assets less cash and equivalents as a percentage of net assets.
The board
IAT has four non-executive directors. Carol Ferguson joined the board in March 2009 and became chairman in August 2013. James Robinson, the longest-serving current director, was appointed in January 2007, while Tom Maier became a director in March 2009 and Owen Jonathan joined the board in March 2013. The directors have backgrounds in investment management and law.
|
Euromoney Institutional Investor