International Biotechnology Trust
Written by
International Biotechnology Trust |
Positioned for large-cap biotech recovery |
Investment trusts |
10 May 2016 |
Share price/discount performance
Three-year cumulative perf. graph
Gearing
Analysts
|
|||||||||||||||||||||||||||||||||||||||||||||||||||||||||||||||||||||||||||||
International Biotechnology Trust (IBT) is a long-established specialist fund investing in listed (c 90%) and unlisted (c 10%) companies in the high-growth area of biotechnology. After several years of strong absolute returns, the past six months have seen a sell-off in the sector, arguably sparked more by political pressure and investor risk aversion than by company fundamentals. While a resumption of bull market conditions is uncertain in the near term, the demographic factors and scientific advances underlying innovation in the sector remain favourable. IBT aims to out-perform the benchmark NASDAQ Biotechnology index and has done so in NAV total return terms over one, three and six months, one and three years and since lead manager Carl Harald Janson took over in September 2013.
12 months ending |
Share price |
NAV |
NASDAQ Biotech (%) |
MSCI World Healthcare (%) |
FTSE All-Share (%) |
30/04/12 |
19.9 |
22.6 |
20.1 |
8.9 |
(2.0) |
30/04/13 |
34.8 |
30.0 |
44.5 |
35.9 |
17.8 |
30/04/14 |
9.3 |
16.5 |
23.4 |
12.8 |
10.5 |
30/04/15 |
88.9 |
74.9 |
60.4 |
32.9 |
7.5 |
30/04/16 |
(16.0) |
(14.2) |
(15.6) |
0.0 |
(5.7) |
Source: Thomson Datastream. Note: Total returns, sterling adjusted.
Investment strategy: Risk-aware pursuit of growth
IBT has two investment portfolios. In the quoted portfolio, managers Carl Harald Janson and Ailsa Craig at SV Life Sciences (SVLS) take a risk-aware approach to identifying attractively valued companies that are addressing areas of unmet medical need, with strong intellectual property, experienced management and sound financing. An unquoted portfolio (c 10% of assets), run by SVLS managing partner Kate Bingham, provides exposure to earlier-stage companies that have largely been started or incubated in SVLS’s venture funds. IBT invests in 60-90 companies but a large proportion of assets (50%+) is in the top 10 holdings.
Market outlook: Fundamentals good, volatility likely
The biotech sector has seen two sharp sell-offs since September 2015, the most recent in a generalised ‘risk-off’ environment. Uncertainty around slowing global growth, divergent monetary policy, the US presidential election and the UK’s EU referendum may lead to further near-term volatility, but the demographic and scientific factors underlying biotech growth and innovation remain favourable.
Valuation: Discount less volatile than historically
At 6 May, IBT’s shares were trading at a 13.8% discount to cum-income net asset value. This is wider than the majority of peers and also a little wider than the average over one, three and five years, suggesting the shares look relatively cheap. Discount volatility has been reduced, with a one-year range of 3.9% to 18.5% compared with a three-year range of 1.9% to 26.0%. Periodic share buybacks help to manage the discount.
International Biotechnology Trust is a research client of Edison Investment Research Limited
Exhibit 1: Trust at a glance
Investment objective and fund background |
Recent developments |
||||||||||||||||||||||||||||||||||||||||||||||||||||||||||||||||||||||
International Biotechnology Trust aims to achieve long-term capital growth by investing in biotechnology and other life sciences companies, both quoted and unquoted, that have high growth potential. IBT invests in companies considered to have good prospects, experienced management and strong upside potential through the development and/or commercialisation of a product, device or enabling technology. Reflecting its capital appreciation objective, IBT’s current policy is not to pay dividends. |
■ 18 April 2016: Half-year results for the period ended 29 February 2016. NAV TR -17.7% compared with -18.0% for benchmark NASDAQ Biotechnology index (in £). Share price TR -22.9%. ■ 18 April 2016: Change to investment management agreement reflecting revised performance fee structure. ■ 5 November 2015: Annual results for the 12 months ended 31 August. NAV TR +48.2% versus +33.6% for the benchmark NASDAQ Biotech index (in £). Share price TR +75.4%. |
||||||||||||||||||||||||||||||||||||||||||||||||||||||||||||||||||||||
Forthcoming |
Capital structure |
Fund details |
|||||||||||||||||||||||||||||||||||||||||||||||||||||||||||||||||||||
AGM |
December 2016 |
Ongoing charges |
1.5% |
Group |
SV Life Sciences |
||||||||||||||||||||||||||||||||||||||||||||||||||||||||||||||||||
Annual results |
October 2016 |
Gearing |
0.0% |
Managers |
Carl Harald Janson, Ailsa Craig, Kate Bingham |
||||||||||||||||||||||||||||||||||||||||||||||||||||||||||||||||||
Year end |
31 August |
Annual mgmt fee |
0.9% on net assets |
Address |
71 Kingsway, London, |
||||||||||||||||||||||||||||||||||||||||||||||||||||||||||||||||||
Dividend paid |
N/A |
Performance fee |
See page 7 |
||||||||||||||||||||||||||||||||||||||||||||||||||||||||||||||||||||
Launch date |
May 1994 |
Trust life |
Indefinite |
Phone |
+44 (0)20 7421 7070 |
||||||||||||||||||||||||||||||||||||||||||||||||||||||||||||||||||
Continuation vote |
Two-yearly, next 2017 |
Loan facilities |
Up to £35m |
Website |
|||||||||||||||||||||||||||||||||||||||||||||||||||||||||||||||||||
Distribution by development stage at 31 March 2016 |
Share buyback policy and history |
||||||||||||||||||||||||||||||||||||||||||||||||||||||||||||||||||||||
Renewed annually, the trust has authority to purchase up to 14.99% and allot up to 5.0% of issued share capital. |
|||||||||||||||||||||||||||||||||||||||||||||||||||||||||||||||||||||||
|
|
||||||||||||||||||||||||||||||||||||||||||||||||||||||||||||||||||||||
Shareholder base (as at 19 April 2016) |
Geographical distribution (as at 31 March 2016) |
||||||||||||||||||||||||||||||||||||||||||||||||||||||||||||||||||||||
|
|
||||||||||||||||||||||||||||||||||||||||||||||||||||||||||||||||||||||
Top 10 holdings (as at 31 March 2016) |
|||||||||||||||||||||||||||||||||||||||||||||||||||||||||||||||||||||||
|
|||||||||||||||||||||||||||||||||||||||||||||||||||||||||||||||||||||||
Source: International Biotechnology Trust, Edison Investment Research, Bloomberg, Morningstar, Thomson. Note: *N/A where not in September 2015 top 10.
Market outlook: Is sell-off a source of opportunity?
The biotechnology sector had enjoyed a stellar run of performance from early 2012 until mid-2015 (Exhibit 2, left-hand chart), but has been hit by two sharp sell-offs in recent months. The first, in September 2015, was sparked by US political pressure on perceived sharp pricing practices in the specialty pharma sector (see The manager’s view), while the second, in January and February 2016, was arguably more the result of a general rise in investor risk aversion.
In spite of the recent market falls, however, fundamentals remain strong for the sector and there has largely been an absence of company-specific bad news. Ageing populations worldwide mean a greater number of elderly people in need of medical treatment, while the pace of scientific advance means more innovative drugs are being approved. While some areas, such as research into dementia, are still in their infancy, the potentially life-changing benefit of advances in treatment ensures that the pace of development remains high. The US election means pricing pressure on the sector may continue, but this is arguably misplaced given the far higher proportion of healthcare costs attributable to other areas such as hospital accommodation (Exhibit 2, right-hand chart).
Investing in biotechnology is more risky than in some other business areas because of the level of spending required to develop treatments that may ultimately prove to be ineffective or unsafe. This means many candidate drugs may fail to get to market, and it may be many years before companies achieve profitability. Because of this, investors may prefer to choose a professionally managed fund rather than trying to pick stocks themselves; most actively managed funds are run by teams that have backgrounds in life sciences as well as investment, giving them a head start in assessing the likelihood of clinical as well as financial success.
|
Exhibit 2: Market performance and US healthcare spending |
|
NASDAQ Biotech, MSCI World Health Care and FTSE All-Share, 10 yrs |
Estimated breakdown of US Federal healthcare spending, 2015-24 |
|
|
|
Source: Thomson Datastream, Edison Investment Research, International Biotechnology Trust |
|
Fund profile: Listed biotech with private equity portion
International Biotechnology Trust (IBT) is a specialist biotechnology investment trust, launched in 1994 and managed since 2001 (officially as investment adviser until 2005) by SV Life Sciences (SVLS). SVLS is headquartered in London and has offices in the US biotech hubs of Boston and San Francisco. It is solely focused on life sciences, with seven qualified physicians and 15 PhDs among its investment staff. The majority of SVLS’s business is investing in private companies, many of which are start-ups that it helps incubate. IBT invests principally in quoted companies, but also has c 10% of its portfolio in unlisted companies backed by SVLS. The quoted portfolio is managed by Carl Harald Janson (lead manager since September 2013) and Ailsa Craig, and blends large, established biotech firms with earlier-stage companies. The unquoted portfolio is managed by SVLS managing partner Kate Bingham.
The fund managers: Janson, Craig, Bingham
The managers’ view: Ignore noise and focus on fundamentals
IBT’s managers are relatively untroubled by the recent volatility in biotech stocks. The first sell-off in September 2015 was sparked by a Hillary Clinton tweet criticising specialty pharma firm Turing for hiking the price of the off-patent drug Daraprim by 5,000%. However, all stocks fell from a high price level because generalist investors attracted by the sector’s high returns had failed to distinguish between abusive pricing practices such as this and the real pricing power of biotech companies with genuinely revolutionary treatments. Drug pricing in the US is a political hot potato because of the forthcoming election and the fact the US spends 16.4% of its GDP on healthcare (see Exhibit 2), a far higher proportion than the UK (c 8.5%). The sell-off in early 2016 was driven by investor risk aversion and outflows from equities, in part caused by the effect of lower oil prices on producing countries that had invested their large surpluses in the stock market. Importantly, the managers say, in neither case was there any deterioration in the factors supporting biotech companies.
In addition to the headwinds facing the biotech sector being more sentiment-driven than structural, valuations also look favourable, say the managers. Large and mega-cap biotech is trading at a rare P/E discount to the S&P 500 (12-month forward average of 15.4x compared with 16.5x for the S&P 500) and the sector has the potential to re-rate, although possibly not until after the US election. While the biotech sector has underperformed global equities recently, the managers say continuing growth in worldwide prescription drug sales, as well as the accelerating pace of new product approvals, provides a favourable backdrop for outperformance to resume.
Asset allocation
Investment process: High growth tempered by risk awareness
IBT has been managed since 2001 by SVLS, a specialist investor in early-stage private companies as well as listed companies in the biotech and healthcare sectors. The SVLS investment team members have a variety of life sciences and investment backgrounds. IBT’s lead manager Carl Harald Janson joined the firm in September 2013. He works alongside Ailsa Craig (on the IBT team since 2006), while SVLS managing partner Kate Bingham is responsible for the unquoted portfolio.
The quoted portfolio investment process is aimed at identifying companies that are addressing areas of unmet medical need, with strong intellectual property (preferably as wholly owned assets), experienced management and sound financing. The managers are risk-aware and run the portfolio with the aim of outperforming the NASDAQ Biotechnology index while reducing some of the binary risk inherent in development-stage biotech. They also seek companies that are attractively valued relative to peers. The majority of holdings (81% at 31 March) have products on or close to market, with around half the total already generating profits. In the recent sell-off, the managers have tilted the portfolio towards more mature, larger companies as these tend to lead the way in a recovery. While portfolio construction is principally bottom-up, focusing on identifying sound companies with good clinical prospects, the managers also take account of the macroeconomic environment.
The unquoted portfolio includes holdings that have been started or incubated by SVLS. While new investment in unlisted companies is currently on hold, IBT’s managers do plan to invest in further situations as holdings mature, with a target holding period (culminating in IPO or trade sale) for new unlisted investments of three to four years. Where unlisted companies exit the portfolio, for example through merger, acquisition or flotation, there may still be future revenues (‘earn-outs’) as a result of ‘milestone’ payments to earlier-stage investors when specific clinical outcomes are achieved. The unquoted portfolio numbers 11 current holdings and six which have been partially exited but have further contingent milestone value, making up 12% of assets at HY16 (29 February).
In both portfolios, the fund managers are in close contact with the management of investee companies (usually with a board seat for unlisted companies). They also regularly travel to healthcare industry conferences and events, which are often the venues for clinical data releases.
Current portfolio positioning
At 31 March 2016, IBT had 88 holdings, 11 of which were unquoted companies. More than half of its portfolio (54.6%) was invested in the top 10 holdings. The majority of investments (84%) were in North America, with the balance in Europe. The managers have adapted the quoted portfolio to the more volatile market conditions by increasing exposure to companies that are generating earnings (79% of the portfolio at 31 March), taking the view that the current climate is less favourable to companies that may need to raise new finance. This has meant holding more larger companies, a decrease in small and mid-cap stocks and a greater focus on likely M&A targets. On a relative basis (compared with the NASDAQ Biotech index), IBT is now fully invested in large-cap stocks.
The biggest increase in weighting has been to oncology specialist Medivation, now 5.8% of assets. More favourable data for prostate cancer treatment Xtandi, as well as rumours of takeover bids from a number of established companies, have seen the share price more than double since a low point in early February. Another of the smaller stocks in the top 10, Danish company Genmab, has risen by 50% over the same period. Its lead drug daratumumab was approved by the FDA in December and continues to post encouraging data in earlier-stage multiple myeloma patients. Daratumumab is partly owned by Johnson & Johnson, which could potentially acquire Genmab as sales of the drug accelerate (currently its royalty rate is capped at 20%). Incyte is another potential M&A target among the top 10 stocks, as well as Ophthotech, which began as an unquoted holding.
Exhibit 3: Portfolio sector exposure at half-year end (%)
Portfolio end February 2016 |
Portfolio end August 2015 |
Change |
|
Therapeutics |
86.0 |
88.0 |
-2.0 |
Specialty pharmaceuticals |
6.0 |
9.0 |
-3.0 |
Medical devices |
6.0 |
5.0 |
1.0 |
Life science tools |
1.0 |
3.0 |
-2.0 |
Cash/(gearing) |
1.0 |
(5.0) |
6.0 |
100.0 |
100.0 |
Source: International Biotechnology Trust, Edison Investment Research
One of the well-known large-cap stocks in the top 10, Biogen, has seen sales of its lead multiple sclerosis drug Tecfidera turn out slower than expected, which has weighed on returns. The managers added to the stock on the basis of more favourable valuations, and also point out that Biogen is working on a treatment for Alzheimer’s disease. Expectations for a forthcoming data release are tilting towards the positive, which could mean significant upside for the share price.
In the unquoted portfolio, top holdings include ReShape Medical, whose space-filling stomach balloon to combat obesity was approved by the FDA in July 2015; KalVista (a company started by SVLS), which is developing an oral drug for diabetic macular oedema and hereditary angioedema (HAE); and Sutro Biopharma, involved in conjugating antibodies through protein engineering. All three of these holdings could potentially see exits via a trade sale within the next two to three years.
One recent sale from the quoted portfolio is Illumina, the market leader in gene sequencing technology. As the biggest name in life science tools (and 5% of the index), this sale has caused IBT to be underweight the sector. The managers felt the stock had become expensive given the company was past its peak growth phase. IBT has also had a long-term underweight to the specialty pharma sector, where corporate actions and cost-cutting are bigger drivers than clinical innovation. The sector has performed relatively well in recent years, driven by consolidation and tax inversions, but has been hit hard by the Turing scandal. IBT’s managers describe this as an overreaction that has caused some stocks to fall to P/E valuations as low as 5x or 6x, and as a consequence they have added some holdings.
Performance: Outperforming over most periods
|
Exhibit 3: Investment trust performance to 30 April 2016 |
||||||||
Price, NAV and benchmark total return performance, one-year rebased |
Price, NAV and benchmark total return performance (%) |
|||||||
|
|
|||||||
|
Source: Thomson Datastream, Edison Investment Research. Note: Three and five-year and since inception (SI) performance figures annualised. SI refers to tenure of manager Carl Harald Janson, who joined in September 2013. |
||||||||
|
Exhibit 4: Share price and NAV total return performance, relative to index (%) |
||||||||
|
One month |
Three months |
Six months |
One year |
Three years |
Five years |
SI* |
|
Price relative to NASDAQ Biotechnology |
3.7 |
2.8 |
(2.8) |
(0.5) |
3.8 |
(3.4) |
8.4 |
|
NAV relative to NASDAQ Biotechnology |
1.3 |
2.4 |
1.2 |
1.6 |
4.6 |
(3.8) |
6.3 |
|
Price relative to MSCI World Health Care |
3.2 |
(1.4) |
(17.7) |
(16.0) |
15.7 |
26.2 |
9.2 |
|
NAV relative to MSCI World Health Care |
0.8 |
(1.8) |
(14.3) |
(14.2) |
16.6 |
25.6 |
7.1 |
|
Price relative to FTSE All-Share |
3.4 |
(3.8) |
(15.5) |
(11.0) |
54.8 |
116.5 |
45.7 |
|
NAV relative to FTSE All-Share |
1.1 |
(4.2) |
(12.0) |
(9.0) |
56.0 |
115.4 |
42.9 |
|
|
Source: Thomson Datastream, Edison Investment Research. Note: Data to end-April 2016. Geometric calculation. *SI refers to tenure of manager Carl Harald Janson, who joined in September 2013. |
||||||||
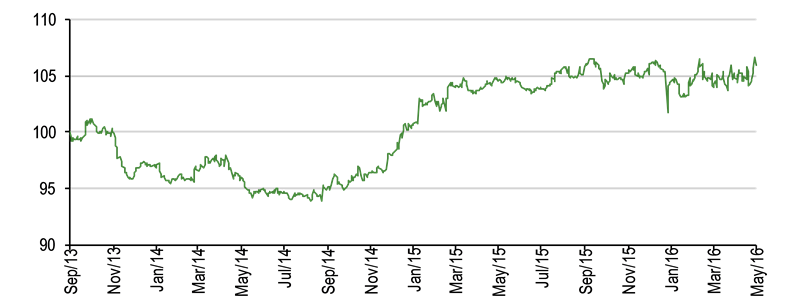
Biotech stocks in general have suffered two serious reverses since mid-2015, first in September and then in January. Because of this, IBT’s total return performance in absolute terms over six months and one year is negative (Exhibit 3). However, in NAV terms the trust has outperformed the benchmark NASDAQ Biotechnology index over one, three and six months, one and three years and since lead manager Carl Harald Janson took over in September 2013. While returns have lagged the broader healthcare index and the FTSE All-Share (included as a baseline for UK investors) over periods between three months and one year, the longer-term figures show significant outperformance and the most recent one-month figure is also ahead of all comparators (Exhibit 4). The unquoted portfolio can help to boost returns in volatile equity markets. Exhibit 5 shows IBT’s NAV total returns relative to the benchmark under the current manager. This illustrates a steady improvement followed by a period of stability, with a small dip in January 2016 more than made up in the months that have followed.
|
Exhibit 5: NAV performance under current manager, relative to NASDAQ Biotechnology |
|
|
Source: Thomson Datastream, Edison Investment Research |
Discount: Wider than peers; buybacks reduce volatility
IBT’s discount to NAV has been largely in a range of 5% to 15% over the past 18 months, having previously been more volatile with a range of 2% to 26%. At 6 May, the discount stood at 13.8%, compared with a one-year average of 11.5%. Since 2014, IBT has been active in buying back shares to manage the discount, which has reduced discount volatility. In the past 12 months it has bought back 4.8m shares at a cost of £11.2m.
|
Exhibit 6: Share price discount to NAV (including income) over three years (%) |
|
|
Source: Thomson Datastream, Edison Investment Research |
Capital structure and fees
IBT is a conventional investment trust, with 38.47m ordinary shares in issue at 6 May 2016. It has authority to buy back up to 14.99% of shares and allot up to 5% annually. It is subject to two-yearly continuation votes, the next of which is due at the December 2017 AGM. It has an overdraft facility for up to £35m (c 18% of NAV), but there were no borrowings at the 29 February 2016 half-year end.
SVLS is paid an annual fee of 0.9% of net assets. A performance fee may also be paid, the terms of which were revised at the recent HY results. For the quoted portfolio the fee is 10% of any outperformance in excess of 0.5% above the return on the NASDAQ Biotechnology index. For the unquoted portfolio the fee is 20% of net realised gains after accounting for unrealised losses. The performance fee is now capped at 2% of net assets (previously 3%), with any excess being carried forward for up to two years and offset against any carried forward underperformance before being paid out. The change has been backdated to the start of FY16 (1 September 2015).
Dividend policy and record
IBT invests in growing biotech companies. While 79% of the portfolio was generating revenues at 31 March 2016, many companies will be several years from profitability given the cash intensity of product development, and dividend income in the IBT portfolio is more than offset by expenses. IBT’s objective is to achieve capital growth and it has not paid a dividend since 2002.
Peer group comparison
IBT is a member of the Association of Investment Companies’ specialist Biotech & Healthcare sector, which contains four investment trusts, two focused on biotechnology and two on the broader healthcare market. Exhibit 7 below also includes two Swiss funds available to UK investors, biotech specialist BB Biotech and the more generalist HBM Healthcare Investments. While the biotech funds have suffered most in the recent market volatility, IBT has seen the smallest losses of the three in NAV total return terms (all figures are in sterling). Over three and five years IBT is ranked mid-table, although absolute returns have been impressive as biotech and healthcare stocks have performed strongly. Risk-adjusted returns as measured by the Sharpe ratio are broadly in line with averages over one and three years. IBT, like the UK-listed Biotech Growth Trust, does not pay dividends. Gearing is generally modest across the peer group and IBT is currently ungeared. Ongoing charges are somewhat above average and, in common with all but one of its peers, IBT charges a performance fee. IBT currently trades at the second-widest discount in the group; the only peer with a wider discount at the time of writing was HBM Healthcare Investments, which also invests in private, as well as public companies.
Exhibit 7: Biotech and healthcare investment companies as at 4 May 2016
% unless stated |
Market cap £m |
TR 1 |
TR 3 |
TR 5 year |
Ongoing charge |
Perf. fee |
Discount (ex-par) |
Net gearing |
Dividend yield (%) |
Sharpe 1y (NAV) |
Sharpe 3y (NAV) |
International Biotechnology Trust |
158.7 |
(19.5) |
69.0 |
170.0 |
1.5 |
Yes |
(13.3) |
100.0 |
0.0 |
(0.7) |
0.9 |
BB Biotech |
2,140.4 |
(22.9) |
74.9 |
223.6 |
1.1 |
No |
(0.3) |
101.0 |
6.4 |
(0.7) |
0.6 |
HBM Healthcare Investments |
545.8 |
12.6 |
140.6 |
161.8 |
1.7 |
Yes |
(29.7) |
100.0 |
5.5 |
0.6 |
1.5 |
Biotech Growth Trust |
345.8 |
(24.1) |
60.0 |
224.1 |
1.2 |
Yes |
(7.4) |
110.0 |
0.0 |
(0.8) |
0.8 |
Polar Capital Global Healthcare |
201.7 |
(5.6) |
32.9 |
89.2 |
1.1 |
Yes |
(4.9) |
100.0 |
2.2 |
(0.8) |
0.8 |
Worldwide Healthcare |
817.5 |
(6.5) |
74.2 |
153.8 |
1.0 |
Yes |
(6.6) |
105.0 |
0.8 |
(0.4) |
1.3 |
Group weighted average |
(14.3) |
79.8 |
193.6 |
1.2 |
(6.6) |
102.3 |
4.8 |
(0.5) |
0.9 |
||
IBT rank in peer group |
6 |
4 |
4 |
3 |
2 |
5 |
4 |
5 |
4 |
3 |
Source: Morningstar, Edison Investment Research. Note: TR = NAV total return. Sharpe ratio is a measure of risk-adjusted return. The ratios shown are calculated by Morningstar for the past 12- and 36-month periods by dividing a fund’s annualised excess returns over the risk-free rate by its annualised standard deviation. Net gearing is total assets less cash and equivalents as a percentage of net assets (100 = ungeared). BB Biotech and HBM Healthcare Investments returns have been translated from CHF to GBP.
The board
IBT has five non-executive directors (a sixth, Dr David Clough, having retired at the December 2015 AGM). Chairman Alan Clifton, a former managing director of Morley Fund Management, has been in his current post since 2012 and joined the board in 2001. Life sciences consultant Veronique Bouchet has been a director since 2009. John Aston, formerly chief financial officer of Cambridge Antibody Technology, was appointed to the board in 2011, while former Witan Investment Trust chief executive and fund manager Jim Horsburgh became a director in 2013. Chartered accountant Caroline Gulliver is the newest director, having been appointed in April 2015.
|