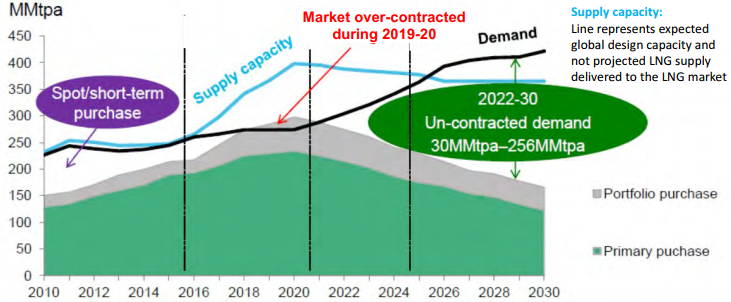
The Magnolia development remains one of the most competitive LNG development projects (greenfield or brownfield) globally. Industry is starting to recognize that the current LNG oversupply will move towards undersupply within five years and there are few projects on track to fill the resulting gap. This should put Magnolia increasingly in the spotlight for buyers looking to fulfil demand in 2023 onwards. LNGL management has indicated it is in discussions with many companies across a diverse set of geographies and interests. We have adjusted our valuation to account for a delayed expectation of project FID, reducing it slightly to $A1.25/share (US$3.8/ADR).
Written by
Liquefied Natural Gas |
Improving macro environment |
Update |
Oil & gas |
29 November 2017 |
ADR research
ADR share price performance
Business description
Next events
Analyst
Liquefied Natural Gas Ltd is a research client of Edison Investment Research Limited |
|||||||||||||||||||||||||||||||||||||||||
The Magnolia development remains one of the most competitive LNG development projects (greenfield or brownfield) globally. Industry is starting to recognize that the current LNG oversupply will move towards undersupply within five years and there are few projects on track to fill the resulting gap. This should put Magnolia increasingly in the spotlight for buyers looking to fulfil demand in 2023 onwards. LNGL management has indicated it is in discussions with many companies across a diverse set of geographies and interests. We have adjusted our valuation to account for a delayed expectation of project FID, reducing it slightly to $A1.25/share (US$3.8/ADR).
Year |
Revenues |
PTP |
Cash from |
Net (debt)/ |
Capex |
06/16 |
5.5 |
(86.9) |
(88.4) |
50.7 |
(0.1) |
06/17 |
0.4 |
(22.0) |
(19.2) |
30.4 |
(0.3) |
06/18e |
0.0 |
(21.7) |
(17.2) |
8.2 |
(5.0) |
06/19e |
43.5 |
16.9 |
24.5 |
(721.6) |
(754.3) |
Note: Figures are as reported. 2018e revenues include back-costs from Stonepeak. Converted at A$1.3/US$. Dividend yield excludes withholding tax. Investors should consult their tax advisor regarding the application of any domestic and foreign tax laws.
Market sentiment has improved
LNGL has suffered over the recent few years as a glut of spot LNG supply (and low spot crude prices) have cast shade on LNG markets. However, with spot prices (oil and LNG) improving and a consensus building that the oversupply will end in the early 2020s, we see much to be optimistic about. The Magnolia project is shovel ready (well ahead of many of its US peers) and continues to offer buyers a fast and cheaper alternative to other projects. The management continues to stress its marketing efforts and is discussing the project with many buyers including major oil companies and traders.
Valuation has room to move with milestones
As and when the project gains binding tolling agreements and moves towards FID, we expect investors to de-risk their expectations for the company, pushing shares higher. Peer metrics suggest that once in production, Magnolia’s substantial cashflow should generate share values significantly higher than the current price. In addition, Bear Head remains in a good position with all relevant permits/approvals allowing future design fine tuning and gas supply agreements to be sought before sanction (the company believes it is around a year behind Magnolia in terms of designs).
Valuation: Value reduced slightly to US$3.8/ADR
We have adjusted our valuation to account for actual cash balances and move our expectations of the timing for project FID and construction outwards given how long it has taken to move towards binding off-take agreements and management’s current thoughts on when agreements will be signed. These changes result in a reduction in our risked valuation to US$3.8/ADR ($A1.25/share), well above current share/ADR prices, while longer-term valuations are materially above these.
Macro environment has improved, as has the market sentiment over LNG
|
Exhibit 1: LNG supply glut ending in early 2020s |
|
|
Source: Bloomberg New Energy Finance (2017) and LNGL |
LNG prices have remained subdued in recent years as low Brent prices (upon which many LNG price contracts are based) combined with increasing supply. Using Japanese LNG prices as an example, realizations fell from around $15/mmbtu in 2014 to below $5 in 2016. Prices since then remained range bound below c $7.5/mmbtu, which has meant that LNGL’s negotiations with buyers for its Magnolia project did not progress as hoped. LNG buyers have been loath to contract long-term volumes at prices well above current spot prices, while low LNG prices do not generate high enough returns to motivate construction.
|
Exhibit 2: Japanese spot LNG prices have recovered |
Exhibit 3: Brent spot pricing has improved |
|
|
|
Source: Bloomberg |
Source: Bloomberg |
|
Exhibit 2: Japanese spot LNG prices have recovered |
|
|
Source: Bloomberg |
|
Exhibit 3: Brent spot pricing has improved |
|
|
Source: Bloomberg |
However, the recent pick up in oil prices has coincided with a growing acceptance that the supply glut will fade in the early 2020s, with few (if any) new projects coming online to fill the gap. As a result, the company has indicated its negotiations over tolling agreements cover many multiples of Magnolia’s 8mtpa capacity (see Exhibit 4 below), and include a range of companies (international oil companies, utilities, traders etc). During the data room process, no companies have raised objections to the technical aspects of the project.
The time to build new facilities on greenfield or brownfield sites (around four to five years) implies a growing imperative for buyers to commit to contracts to allow facilities to be built in time. Magnolia has been rated (by World Gas Intelligence) as the second best positioned project (behind Corpus Christi Train 3) in the US, and is well ahead of its greenfield peers in permitting and cost. We expect the company to execute binding agreements during 2018 (although an agreement in 2017 is not out of the question). Once the first ‘anchor’ agreement is signed, the company expects a number of others to come forward.
|
Exhibit 4: Volumes of offtake with potential customers far exceed Magnolia’s capacity |
|
|
Source: LNGL |
Valuation
Longer-term valuation metrics for peers (utilities and pipeline companies in the US) remain strong, suggesting material upside for the shares as and when the project hits its milestones. We assume a tolling fee of $2.4/mmbtu which would produce gross fees of around US$900m. Cash flows of this magnitude would imply significant share price increases from current levels using cashflow metrics.
|
Exhibit 5: Multiples of US utilities are historically high |
Exhibit 6: Dividend yields for US utilities are low |
|
|
|
Source: Bloomberg |
Source: Bloomberg |
|
Exhibit 5: Multiples of US utilities are historically high |
|
|
Source: Bloomberg |
|
Exhibit 6: Dividend yields for US utilities are low |
|
|
Source: Bloomberg |
|
Exhibit 7: Longer-term valuation expectations using EV/EBITDA multiples ($/share) |
|
|
Source: Edison Investment Research. Note: Assumes 100% equity ownership of the project and includes only Magnolia project cashflows. |
Given the uncertainty of timing on the project, we continue to use a risked DCF approach. We have adjusted our modelling assumptions to account for a refreshed view on timings for Magnolia and reported cash figures. We model first LNG deliveries at Magnolia in H223, a delay from previous expectations (a few months’ delay at Bear Head). This produces a slight reduction in our valuation from A$1.37/share (US$/4.19/ADR) to A$1.25/share (US$3.79/ADR).
Exhibit 8: Valuation summary
Asset |
Country |
WI |
CoS |
Absolute |
Risked |
Risked |
|
% |
% |
US$m |
A$/share |
US$/ADR |
|
Net (debt)/cash (June 2017) |
34 |
0.09 |
0.26 |
|||
G&A (includes share based payments) |
(49) |
(0.13) |
(0.38) |
|||
Project development costs July 2017 to June 2018 |
(5) |
(0.01) |
(0.04) |
|||
Magnolia Trains 1-4 |
United States |
100% |
60% |
408 |
1.06 |
3.19 |
Bear Head Trains 1-4 |
United States |
100% |
15% |
97 |
0.25 |
0.76 |
NAV |
|
|
|
485 |
1.25 |
3.79 |
Source: Edison Investment Research
Financials
The management continues to manage costs as far as possible, although cash needs to be spent on marketing the Magnolia project to achieve a binding tolling agreement and FID. Very little is required on project costs, as Magnolia’s design is now ready and awaiting project progress on offtake and financing. Management has stated it expects the current cash reserves to last until the end of 2018. It is therefore possible that the company may need to return to the market over the next 12 months if the project does not develop as anticipated, which could see shareholder dilution.
BNP Paribas recently announced it would no longer support oil and gas developments and as a result, LNGL will have to develop relationships with new lenders to provide debt financing. Given the project cashflows, and the investment quality of Magnolia’s expected customers, management does not believe that it will encounter many difficulties in attracting another debt partner.
|
Exhibit 9: Financial summary |
|||||||||
Accounts: IFRS, Yr end: June, US$m |
|
2013 |
2014 |
2015 |
2016 |
2017 |
2018e |
2019e |
|
Total revenues |
|
0 |
0 |
6 |
5 |
0 |
0 |
44 |
|
Cost of sales |
|
0 |
0 |
0 |
0 |
0 |
0 |
(2) |
|
Gross profit |
|
0 |
0 |
6 |
5 |
0 |
0 |
42 |
|
SG&A (expenses) |
|
(2) |
(3) |
(6) |
(15) |
(10) |
(10) |
(11) |
|
R&D costs |
|
0 |
0 |
0 |
0 |
0 |
0 |
0 |
|
Other income/(expense) |
|
(9) |
(15) |
(54) |
(67) |
(11) |
(7) |
(7) |
|
Exceptionals and adjustments |
|
0 |
(0) |
(11) |
(11) |
(2) |
(5) |
(8) |
|
Depreciation and amortization |
|
(0) |
(0) |
(0) |
(0) |
(0) |
(0) |
(0) |
|
Reported EBIT |
|
(10) |
(18) |
(66) |
(87) |
(22) |
(22) |
17 |
|
Finance income/(expense) |
|
0 |
(1) |
0 |
0 |
0 |
0 |
0 |
|
Other income/(expense) |
|
0 |
0 |
0 |
0 |
0 |
0 |
0 |
|
Exceptionals and adjustments |
|
0 |
0 |
0 |
0 |
0 |
0 |
0 |
|
Reported PTP |
|
|
(10) |
(19) |
(65) |
(87) |
(22) |
(22) |
17 |
Income tax expense (includes exceptionals) |
|
|
0 |
0 |
(0) |
0 |
(0) |
0 |
0 |
Reported net income |
|
|
(10) |
(19) |
(65) |
(87) |
(22) |
(22) |
17 |
Basic average number of shares, m |
|
|
67 |
334 |
464 |
503 |
513 |
513 |
513 |
Basic EPS |
|
|
(0.2) |
0.0 |
(0.6) |
(0.7) |
(0.2) |
(0.2) |
0.1 |
|
|
|
|
|
|
|
|
|
|
Balance sheet |
|
|
|||||||
Property, plant and equipment |
|
|
0 |
0 |
9 |
9 |
9 |
14 |
730 |
Goodwill |
|
|
0 |
0 |
0 |
0 |
0 |
0 |
0 |
Intangible assets |
|
|
0 |
0 |
0 |
0 |
0 |
0 |
38 |
Other non-current assets |
|
|
0 |
0 |
0 |
0 |
0 |
0 |
0 |
Total non-current assets |
|
|
0 |
0 |
9 |
9 |
9 |
14 |
768 |
Cash and equivalents |
|
|
1 |
36 |
35 |
51 |
30 |
8 |
109 |
Inventories |
|
|
0 |
0 |
0 |
0 |
0 |
0 |
0 |
Trade and other receivables |
|
|
0 |
0 |
2 |
1 |
0 |
0 |
0 |
Other current assets |
|
|
1 |
3 |
102 |
3 |
3 |
3 |
3 |
Total current assets |
|
|
2 |
39 |
139 |
55 |
34 |
12 |
113 |
Non-current loans and borrowings |
|
|
0 |
0 |
0 |
0 |
0 |
0 |
831 |
Other non-current liabilities |
|
|
0 |
0 |
0 |
0 |
0 |
0 |
0 |
Total non-current liabilities |
|
|
0 |
0 |
0 |
0 |
0 |
0 |
831 |
Trade and other payables |
|
|
1 |
3 |
10 |
2 |
2 |
2 |
2 |
Current loans and borrowings |
|
|
0 |
0 |
0 |
0 |
0 |
0 |
0 |
Other current liabilities |
|
|
0 |
0 |
1 |
1 |
0 |
0 |
0 |
Total current liabilities |
|
|
1 |
3 |
11 |
3 |
2 |
2 |
2 |
Equity attributable to company |
|
|
1 |
36 |
137 |
61 |
41 |
24 |
48 |
Non-controlling interest |
|
|
(0) |
(0) |
(0) |
(0) |
(0) |
(0) |
(0) |
|
|
|
|
|
|
|
|
|
|
Cashflow statement |
|
|
|||||||
Profit for the year |
|
|
(10) |
(19) |
(65) |
(87) |
(22) |
(22) |
17 |
Taxation expenses |
|
|
0 |
0 |
0 |
0 |
0 |
0 |
0 |
Net finance expenses |
|
|
0 |
0 |
0 |
0 |
0 |
0 |
0 |
Depreciation and amortization |
|
|
0 |
0 |
0 |
0 |
0 |
0 |
0 |
Share based payments |
|
|
(0) |
0 |
11 |
11 |
2 |
5 |
8 |
Other adjustments |
|
|
4 |
1 |
(6) |
(5) |
1 |
0 |
0 |
Movements in working capital |
|
|
0 |
2 |
7 |
(7) |
(0) |
0 |
0 |
Interest paid / received |
|
|
0 |
0 |
0 |
0 |
0 |
0 |
0 |
Income taxes paid |
|
|
0 |
0 |
0 |
0 |
0 |
0 |
0 |
Cash from operations (CFO) |
|
|
(6) |
(16) |
(53) |
(88) |
(19) |
(17) |
24 |
Capex |
|
|
(0) |
(0) |
(9) |
(0) |
(0) |
(5) |
(754) |
Acquisitions & disposals net |
|
|
0 |
0 |
0 |
0 |
0 |
0 |
0 |
Other investing activities |
|
|
2 |
(1) |
(99) |
99 |
0 |
0 |
0 |
Cash used in investing activities (CFIA) |
|
|
2 |
(2) |
(108) |
98 |
(0) |
(5) |
(754) |
Net proceeds from issue of shares |
|
|
0 |
53 |
155 |
0 |
0 |
0 |
0 |
Movements in debt |
|
|
0 |
0 |
0 |
0 |
0 |
0 |
831 |
Other financing activities |
|
|
(0) |
(0) |
(0) |
(0) |
(0) |
(0) |
(0) |
Cash from financing activities (CFF) |
|
|
(0) |
53 |
155 |
0 |
0 |
(0) |
831 |
Increase/(decrease) in cash and equivalents |
|
|
(4) |
35 |
(6) |
10 |
(19) |
(22) |
101 |
Currency translation differences and other |
|
|
0 |
(0) |
6 |
5 |
(1) |
0 |
0 |
Cash and equivalents at end of period |
|
|
1 |
36 |
35 |
51 |
30 |
8 |
109 |
Net (debt) cash |
|
|
1 |
36 |
35 |
51 |
30 |
8 |
(722) |
Movement in net (debt) cash over period |
|
|
(4) |
34 |
(0) |
15 |
(20) |
(22) |
(730) |
|
Source: Edison Investment Research, company accounts. Note: Assumes a US$1:1.33 A$ exchange rate. |
|||||||||
|
|
The Magnolia development remains one of the most competitive LNG development projects (greenfield or brownfield) globally. Industry is starting to recognise that the current LNG oversupply will move towards undersupply within five years and there are few projects on track to fill the resulting gap. This should put Magnolia increasingly in the spotlight for buyers looking to fulfil demand in 2023 onwards. LNGL management has indicated it is in discussions with many companies across a diverse set of geographies and interests. We have adjusted our valuation to account for a delayed expectation of project FID, reducing it slightly to $A1.25/share (US$3.8/ADR).