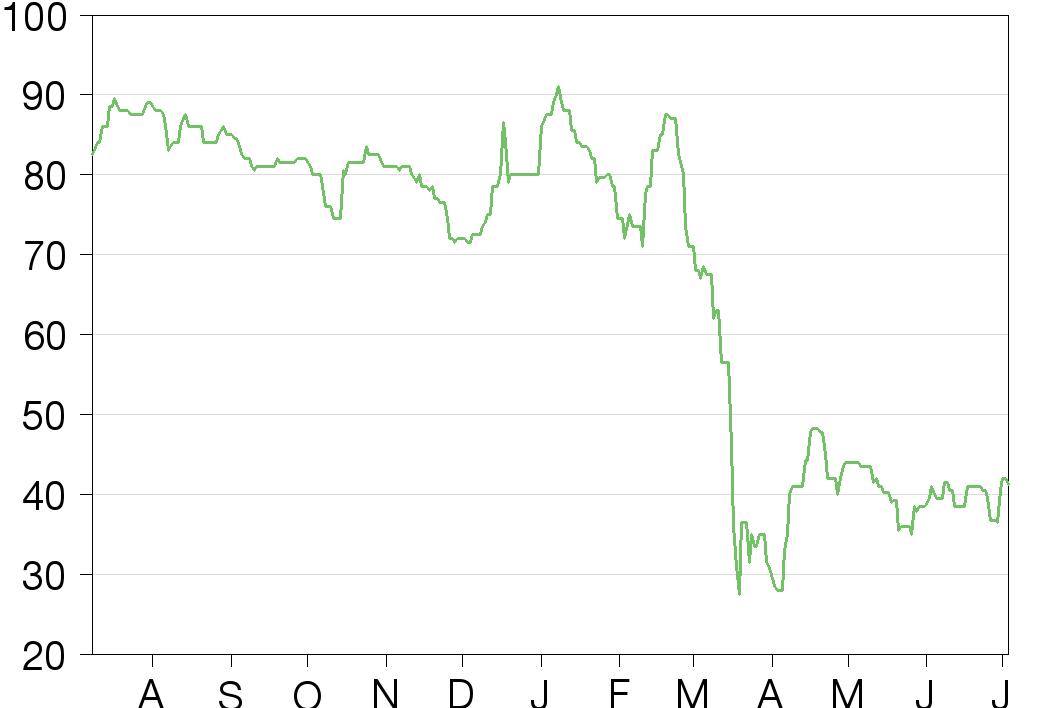
Walker Greenbank has a tangible strategic impetus under its new management team with a clear business model migration plan. While COVID-19 related market effects are affecting near-term trading – and the decision not to pay an FY20 final dividend – they are also presenting opportunities. Our estimates remain suspended for now ahead of the AGM on 29 July when an update on trading and the financial position can be expected.
Written by
Walker Greenbank |
Implementing strategy in COVID-affected markets |
FY20 results |
Care & household goods |
6 July 2020 |
Share price performance
Business description
Next events
Analyst
Walker Greenbank is a research client of Edison Investment Research Limited |
|||||||||||||||||||||||||||||||||||||||||||||
Walker Greenbank has a tangible strategic impetus under its new management team with a clear business model migration plan. While COVID-19 related market effects are affecting near-term trading – and the decision not to pay an FY20 final dividend – they are also presenting opportunities. Our estimates remain suspended for now ahead of the AGM on 29 July when an update on trading and the financial position can be expected.
Year end |
Revenue (£m) |
PBT* |
EPS* |
DPS |
P/E |
Yield |
01/18** |
112.2 |
12.7 |
14.4 |
4.4 |
2.9 |
10.6 |
01/19 |
113.3 |
9.5 |
10.8 |
3.2 |
3.8 |
7.8 |
01/20 |
111.5 |
7.4 |
9.2 |
0.5 |
4.5 |
1.3 |
Note: *PBT and EPS (fully diluted) are company normalised, excluding pension scheme costs, LTIP charges and exceptional items. **Restated for IFRS 15. The FY20 DPS represents the declared interim dividend only; no final dividend was announced.
In line FY20 PBT, mixed company outturns
FY20 company adjusted PBT of £7.4m was in line with our expectations (and c £2.1m lower than the prior year) with an adverse mix diluting group margins in H2. Manufacturing profitability was robust across the year, with Standfast & Barracks (fabrics) performing well in each of its market sectors while Anstey (wallcoverings, paints) was pretty stable overall. Lower sales (including higher-margin licence income) were evident in the Brands division outturn. That said, Morris & Co performed well at home and in export markets while Clarke & Clarke sold well in the UK especially. The group’s year-end net cash position improved modestly to £1.3m and banking facilities are as previously notified. No FY20 final dividend was recommended as expected.
Operating and implementing strategy
Notwithstanding the wider coronavirus impacts (and the revenue run rate for the last four weeks has narrowed to c 31% below the prior year equivalent) the new management team is setting about executing its refreshed strategy. Announced partnerships, fewer/more focused collection launches, SKU management and increased use of digital delivery are all features of this approach. All manufacturing sites, distribution facilities and showrooms are open now and activity levels are being aligned with prevailing demand. Ending FY20 with a £1.3m net funds position, together with banking facilities in place provides Walker Greenbank with notional liquidity headroom in excess of £10m, subject to cash flow performance in FY21 to date.
Recovery visibility ahead of reinstating estimates
We intend to reinstate estimates once underlying demand levels become more visible as markets ease lockdown restrictions and move into a recovery phase. Based on FY20 reported earnings, Walker Greenbank is trading on historical P/E and EV/EBITDA (adjusted for pensions cash) multiples of 4.5x and 3.1x, respectively.
FY20 results overview
Group revenues were marginally down in FY20. Manufacturing division profitability improved notably though an adverse overall EBIT mix (absent significant one-off Brands licence income in the prior year) affected group margins. The adoption of IFRS 16 benefited EBIT by £0.3m in FY20 though the impact at the PBT level was immaterial. Walker Greenbank sustained a modest net funds position at the year end, with liquidity headroom from renewed banking facilities.
Exhibit 1: Walker Greenbank interim and divisional splits
Year-end January (£m) |
H119* |
H219* |
2019* |
H120*** |
H220*** |
2020*** |
Headline % change y-o-y |
CER % change y-o-y |
||||
H120 |
FY20 |
H1 |
FY |
|||||||||
Group Revenue |
54.7 |
58.6 |
113.3 |
55.9 |
55.5 |
111.5 |
2.3% |
-1.6% |
||||
Brands |
44.6 |
48.6 |
93.3 |
46.3 |
43.9 |
90.2 |
3.9% |
-3.3% |
0.8% |
-3.6% |
||
UK |
23.1 |
23.2 |
46.3 |
22.2 |
22.7 |
44.9 |
|
-4.0% |
-3.0% |
|
-4.0% |
-3.0% |
International |
19.5 |
21.0 |
40.5 |
20.9 |
18.9 |
39.8 |
|
7.2% |
-1.7% |
|
4.8% |
-2.6% |
Licence income |
2.0 |
4.5 |
6.5 |
3.2 |
2.3 |
5.5 |
|
61.9% |
-14.9% |
|
60.0% |
-14.9% |
Manufacturing – gross** |
16.3 |
16.6 |
32.9 |
17.1 |
18.4 |
35.5 |
5.1% |
7.9% |
||||
UK |
7.5 |
6.8 |
14.3 |
6.6 |
7.8 |
14.4 |
|
-12.0% |
1.0% |
|
||
International |
2.6 |
3.2 |
5.7 |
3.0 |
3.8 |
6.8 |
|
16.6% |
18.9% |
|
||
Inter company |
(6.2) |
(6.7) |
(12.9) |
(7.6) |
(6.7) |
(14.3) |
21.0% |
10.8% |
||||
Group Operating Profit |
4.1 |
5.2 |
9.3 |
4.9 |
2.1 |
7.0 |
18.7% |
-24.7% |
||||
Brands |
4.7 |
6.1 |
10.8 |
5.6 |
2.5 |
8.2 |
19.8% |
-24.1% |
||||
Manufacturing |
0.6 |
0.3 |
0.8 |
1.0 |
1.2 |
2.2 |
87.0% |
170.3% |
||||
Central items** |
(1.1) |
(1.2) |
(2.3) |
(1.8) |
(1.6) |
(3.4) |
57.1% |
|||||
EBIT margins % |
||||||||||||
Group |
7.5% |
8.8% |
8.2% |
8.7% |
3.8% |
6.3% |
||||||
Brands (pre-central) |
10.5% |
12.5% |
11.5% |
12.1% |
5.8% |
9.0% |
||||||
Manufacturing (gross, pre-central) |
3.4% |
1.6% |
2.5% |
6.1% |
6.5% |
6.3% |
||||||
Source: Edison Investment Research, Walker Greenbank data. Note: *Re-stated. **Manufacturing – gross includes intercompany transfers to Brands, which is netted out on consolidation. ***Reported under IFRS 16 for the first time – c £0.3m of lease finance costs now stripped out and included in the net finance cost line for the full year. Central excludes exceptionals and pension net finance costs.
Brands: Tougher H2 trading
Internationally recognised heritage and contemporary, premium and mid-market, wall covering and furnishing brands (Sanderson, Morris & Co, Harlequin, Zoffany, Scion, Anthology, Clarke & Clarke, Studio G).
On a reported basis, FY20 Brands product sales were 2.4% lower than the prior year after a modestly favourable FX translation effect. Following good progress in H1, year-on-year performance deteriorated in H2 with international sales in particular appearing to tail down. The second half of the prior year included £2.7m revenue from a one-off apparel licensing deal with H&M, which made for a tough headline comparator in this income category. Notwithstanding some restructuring activity during the year, operational gearing effects from lower overall Brands product volumes and Licence income contributed to a 250bp reduction in EBIT margin to 9.0% for the year as a whole.
Individual brand performance: Arthur Sanderson/Morris & Co and Clarke & Clarke (including Studio G) were the standout brand groups, achieving low single-digit revenue growth year-on-year (+4.3% and +4.1%, respectively, in constant currency) while the other portfolio heritage brands experienced declines to varying degrees. Sanderson/Morris grew sales in all three key reporting regions, led by strong demand for Morris & Co designs in Scandinavia and the UK in particular. The UK was, in fact, Clarke & Clarke’s (C&C) best sales territory, while increasing exposure to northern Europe also. While its North American sales were down, this will have reflected some business disruption in the earlier part of the year ahead of a new distribution agreement with Kravet Inc (in July, after C&C’s previous US partner entered Chapter 11). The other leading brands continued to experience tough market headwinds for the second consecutive year with Harlequin and its sister brands (Scion and Anthology) seeing a c 9% sales decline and Zoffany was down c 13% with reductions seen in all three main market regions.
Partnerships and collaboration: Within the commentary accompanying the FY20 results there is clear and broad evidence that the new management team is taking steps to energise the brands within the portfolio and emphasise their individual characteristics through the partnering initiatives. Walker Greenbank has pre-announced several agreements and summarising them here highlights their number and breadth as well as noting that they were all in the last six months.
■
Sanderson – ‘Celebration of the National Trust’; new fabric collection (30 January)
■
Clarke & Clarke – ‘Wilderie’ by Emma J Shipley wallpaper collection (January)
■
Clarke & Clarke – ‘Tess Daly Collection’; new homewares range including bedlinen, throws and cushions (28 February)
■
Scion – ‘Next Collection’; extended range of soft furnishings, wallpaper and curtains (5 March)
■
Zoffany – ‘Palladio’, wallpaper collection Sam Wilde design refresh (27 May trading update)
■
Morris & Co – ‘Queen Square Collection’ wallpapers & fabrics with Ben Pentreath (23 June)
The groundwork for the design development and launch would clearly have taken place during FY20 with no material in-year benefits. Some of these collaborations (eg Palladio, Queens Square) are scheduled to be formally launched later this year.
As well as using established market channels, there appears to be increasing reach into retail (both traditional and online) and more end customer engagement to raise brand profiles among consumers. In addition, the way in which new collections are launched is evolving with increasing use of digital marketing (including webinars and social media) and also virtual/digital pattern books. UK lockdown periods have accelerated the introduction of – and probably market appetite/reception for – these channels. The additional range of marketing tools should help to facilitate the sharper definition of brand identities over time.
During FY21, the top 10 customers accounted for c 35% of UK Brands sales revenue. In a different sense, the development of closer relationships with key, larger customers is also underway. The use of exclusive ranges (eg Morris & Co with wallpaperdirect.com, part of Brewers and Harlequin with Thomas Sanderson, curtain and window furnishings specialist) together with enhanced service and supply agreements are all areas where Walker Greenbank brands can support and participate in faster rates of customer growth.
Licence income: In headline terms, revenue declined by c 15% to £5.5m in FY20. The large, one-off apparel deal in FY19 was flagged previously (ie H&M Morris & Co licence fee £2.7m) and IFRS 15 (which requires the accelerated recognition of contracted minimum revenues in the year of inception) also obscures the true underlying performance of core, non-apparel licence income. Management reports that this grew to £3.2m in FY20 (+13.9% constant FX) representing almost 60% of the category total. Licensing extends group brands into finished goods (eg bed linen, cushions, giftware) creating an additional, high-margin revenue stream that also serves to raise brand awareness. Seeking to grow core licence income is strategically sensible in our view.
Restructuring: Finally for the Brands division, we should mention that full integration of Clarke & Clarke (encompassing warehouse support function consolidation) took place during FY20 following completion of the three-year earnout period. A restructuring cost of c £0.7m was taken during the year and around half of the expected £2m annualised benefits were delivered in H2. While this was not really evident in reported EBIT, it suggests that underlying profitability would otherwise have been softer than the headline decline. With the full year effect to come in FY21, the division is more able to accommodate COVID-19 impacts than would otherwise have been the case.
Manufacturing: Strong performance
Two locations, Anstey (wallcoverings) and Standfast & Barracks (fabrics), which produce high-end furnishings; c 60% of FY20 gross divisional revenue was to third-party customers, c 40% supported the group’s Brands division.
FY20 represented the first undisturbed year for Walker Greenbank’s manufacturing facilities for some time.1 Total revenue increased by almost 8% to £35.5m in FY20; third-party sales rose by 6.1% (including a strong second half performance) while internal Brands sales were almost 11% above the prior year level.
Standfast & Barracks experienced a significant flooding event in December 2015 (ie FY16) that affected the following year’s trading and a small machine fire occurred at Anstey at the end of December 2017 (FY18) that pushed some sales into FY19.
Manufacturing volumes – in both fabrics and wallcoverings – comprise re-print runs for successful collection SKUs together with initial runs for new designs/collections. The former could be considered a base load of business (c 70%) with scheduling informed by a combination of inbound order levels and warehouse inventory. New collection runs clearly need to precede formal launches, which are typically around spring and autumn timetables. So, the challenge is to balance these production requirements and utilise capacity effectively. These timing effects, as well as increases or decreases in new launch activity, can amplify seasonal revenue variations, more so when a new collection encompasses both fabric and wallpaper designs, which we cannot readily quantify. Consequently, we should attach some caution to our commentary on H1/H2 splits owing to potential timing distortions. Full year comparisons better capture overall activity and iron out any differences in weighting between, say, spring and autumn launches between years.
External sales of £21.3m in FY20 was split broadly two-thirds domestic customers and one-third exports. UK revenue grew by 1% with an almost opposite seasonal pattern to FY19 appearing as lower H1 activity year-on-year was compensated for by an H2 rebound. The phasing of wallcovering sales appeared to be the main driver of this pattern as we believe that fabric sales showed incremental improvements in both half years. International sales were strong throughout the year with double-digit growth year-on-year in both half years resulting in almost 19% progress for FY20 as a whole, being the second consecutive year of good growth. Fabric sales had a particularly good year and wallcoverings were c 6% ahead also, with a greater H1 bias than in the prior year.
Our first observation regarding internal sales is that c 11% y-o-y progress is some way ahead of the Brands division product sales growth. This infers that the share of internally sourced product is likely to have increased (to around half of the total). Secondly, we note that the year comprised of strong first half sales growth with a flatter H2 year-on-year. This shape (ie H1 better than H2) was also seen in Brands, more so for its international revenues. Lastly, both product categories contributed to the increase in channel sales with fabrics (+15.6%) and wallcoverings (+7.5%) both comfortably ahead year-on-year.
Facility-level performance: Our earlier comments on the strength of printed fabric product sales (in all three channels: UK, export and internal) is corroborated by S&B’s reported 16.5% revenue increase in FY20. Anstey’s progress was a more marginal +1.0%; channel performances were variable across the year but export and internal product sales progress was enough to carry a softer UK year. Both locations grew digitally-printed product revenues with S&B up 5% (behind more traditional methods, so the share of sales reduced to 52% from 58%) and Anstey up c 35% (from a lower base, increasing the share of sales to c 12%). These are important metrics as digital print processes allow more flexible print run lengths with faster changeovers and, subject to capacity utilisation, higher margin potential. Management noted that S&B returned to profitability for the first time since the flood-related business interruptions in FY16, disclosing generated EBITDA of £2.6m (a 15.1% margin) while the equivalent Anstey contribution was £2.8m (14.8%). Assuming that all intangible amortisation relates to Brands suggests that Manufacturing divisional depreciation was £3.4m in FY20. The £1.4m uplift in divisional EBIT (to £2.2m) on a higher sales base delivered a 340bp margin improvement to 6.3%.
Group regional performance: The UK remains Walker Greenbank’s largest product sales market, accounting for just over half of product sales and around two-thirds of the smaller licence income category. Domestic product sales were down 2.1% y-o-y with a c 3% decline in Brands revenue partly offset by a small improvement from Manufacturing. Both categories generated higher sales in H2 versus H1 with better year-on-year comparatives also. Given that UK consumer confidence generally was pretty weak amid Brexit and political uncertainty for much of the year, a broadly stable outturn with better H2 momentum represents a creditable result in our view. Including a small FX tailwind, reported international revenues were slightly ahead overall for the year driven by a very strong Manufacturing export performance, with fabric sales particularly strong, while wallcovering sales also grew. Brand product and licence income were both slightly down year-on-year. During FY20, international sales reporting regions were redefined as North America, northern Europe (including Russia) and rest of world (including Japan). Looking at the breakdown of Brand product sales, North America (the largest export market and c 17% of total group revenue) experienced a 7.1% sales reduction, while northern Europe (c 14%) grew modestly with the aforementioned Clarke & Clarke and Morris & Co effects being the main drivers of these respective outturns.
Positive net funds and liquidity headroom
Walker Greenbank sustained and slightly improved its net cash position in FY20, ending the year in a £1.3m net funds position (up £0.9m y-o-y). Given that group operating profit was down c 30% against FY19 this is a commendable outturn, a perception reinforced by lower, seasonally influenced, average net debt also (by £4.4m to £3.8m in FY20). At the year end, the company also had £8.4m IFRS 16 lease liabilities on the balance sheet.
Adjusting for IFRS 16 line items in the cash flow statement to aid comparison with the prior year, operating cash flow at £6.6m was only just over half of the FY19 level. The primary contributors to the year-on-year reduction were c £2m lower EBITDA (to c £11m) and a c £4m working capital reversal (from £2.6m inflow to a £1.6m outflow). All three working capital line items achieved cash inflows in H2, though that for receivables was perhaps not as strong as we anticipated. Receivables and payables days both appeared to lengthen. Non-trading cash outflows related to defined benefit pension scheme deficit recovery cash payments of £1.9m, similar to the prior year and c £0.7m restructuring costs.
Net interest and tax payments were individually in line with FY19 and together totalled £1m. Capex spending of c £1.7m (including a new digital printer at Anstey) was below the prior year and compared to owned asset depreciation of £2.6m. Spending on intangible assets – related to capitalised development costs of new collection designs – was similar to FY19 at £0.7m and equivalent to the amortisation charge on internally generated intangible assets. After these items, underlying free cash flow generation of c £3m was sufficient to cover dividend cash outflows of £2.2m, all made in H2 as usual.
For the record IFRS 16 lease costs are now separately disclosed – inflating reported operating cash flow, mirrored by higher finance costs – and totalled almost £3m (comprising £2.7m capital repayments and £0.2m interest). The change in presentation has no impact on underlying cash flow generation. Right of use assets on the balance sheet at the year-end were in line with IFRS 16 lease liabilities referenced above.
Cash flow outlook: The UK COVID-19 lockdown began towards the end of March – the second month of Walker Greenbank’s financial year – and restrictions began to ease in May. The company has continued to service sales, albeit at a reduced level, from inventory throughout and restarted manufacturing operations towards the end of May. A net funds position update was not provided with the FY20 results but previously announced actions (including furloughed staff, salary reductions, tax/PAYE payment deferrals and the decision not to declare an FY20 final dividend) will all be helping to preserve cash within the business.
As the scale of the coronavirus pandemic had not become fully apparent at the end of FY20, no significant draw down of borrowing facilities into cash for liquidity purposes had occurred at that time. As previously announced, Walker Greenbank has in place a £12.5m RCF together with an uncommitted £5m accordion option (both to 2024), which was supplemented in April with a 12-month overdraft facility of £2.5m. The leverage and interest cover covenants on the main facility have been waived until April and July 2021; in the former case, the test has been replaced by a £5m minimum liquidity headroom covenant. Taken at face value – netting off the liquidity covenant value from total available committed facilities and cash – Walker Greenbank had in place in excess of £10m headroom available above the minimum liquidity requirement.
Current trading in FY21 to date
The first five months of FY21 have seen vastly variable trading conditions broadly comprising:
■
one and a half months of normal trading;
■
two months of full lockdown restrictions; and
■
a one and a half month initial recovery phase.
Management commented that during this period, group revenues overall were c 35% lower than in the equivalent prior year period. In addition, on a rolling four-week basis, the latest period run rate was 31% down year-on-year, consistent with a gradual re-opening of activities across the supply chain and some parts of the distribution channels. This development is no guarantee of the subsequent trajectory of recovery. This will be a question of assessing underlying ongoing demand – most likely in a recessionary UK economy – once any deferred sales have been satisfied. While management reports that enquiry levels (including sample requests) are continuing to improve and S&B now has some order visibility (unspecified) we are not reinstating estimates at this stage, pending greater clarity on the underlying trading environment. A trading update will be issued at the AGM on 29 July 2020.
New management pressing on with strategy implementation
The group board has undergone extensive change over the last 18 months, including appointing new CEO Lisa Montague (appointed April 2019) and CFO Michael Williamson (February 2020, initially as interim). Below board level, the executive team has also been strengthened through the recruitment of new group commercial, operations and marketing & digital directors (three positions, two being completely new) as well as a new head of the North America sales region.
A revised strategy was introduced with the H120 results, well ahead of the COVID-19 pandemic; not all of the detail was fleshed out at that time partly due to the pending arrival of some of the new hires above. While some of the near-term timings will need to be flexed, the scorecard against previously set ‘by end FY21’ milestones is already showing good progress. We have already referenced actions taken to sharpen individual brand identities and increase partner collaboration and use of digital marketing techniques.
Management has also set out a business transformation roadmap centred around a reduction in SKU count from c 20k currently to around 12k over a five-year period (the time horizon being partly dictated by pattern book inventory commitments). This streamlines the business in virtually every step of product delivery (manufacturing, working capital, distribution), increasing efficiency and agility to changing customer requirements and market trends. Part of this process includes a reduced level of new collection launches (eg 21 in FY21 compared to a recent yearly average of 55) backed by greater marketing intensity using a combination of traditional and digital techniques. We support this holistic strategic refresh, which should ultimately reinforce the power of Walker Greenbank’s vertically integrated model and yield improved returns over time.
Exhibit 2: Financial summary
£m |
2013 |
2014 |
2015 |
2016 |
2017 |
2018R |
2019 |
2020 |
|||
Year end January |
IFRS |
IFRS |
IFRS |
IFRS |
IFRS |
IFRS |
IFRS |
IFRS |
|||
PROFIT & LOSS |
|
|
|
|
|
|
|
|
|
|
|
Revenue |
|
|
75.7 |
78.4 |
83.4 |
87.8 |
92.4 |
112.2 |
113.3 |
111.5 |
|
Cost of Sales |
|
|
(30.2) |
(30.3) |
(32.7) |
(35.9) |
(36.2) |
(44.0) |
(45.3) |
(43.3) |
|
Gross Profit |
|
|
45.5 |
48.1 |
50.7 |
52.0 |
56.2 |
68.2 |
68.0 |
68.1 |
|
EBITDA (pre IFRS 16) |
|
|
8.6 |
9.7 |
10.7 |
11.8 |
13.1 |
15.7 |
12.9 |
11.0 |
|
Op Profit - Edison norm |
|
|
5.8 |
6.5 |
7.3 |
8.2 |
9.5 |
12.2 |
9.3 |
7.0 |
|
Op Profit - company adjusted |
|
|
6.6 |
7.5 |
8.3 |
9.1 |
10.6 |
13.0 |
9.8 |
7.8 |
|
Net Interest |
|
|
(0.2) |
(0.2) |
(0.2) |
(0.2) |
(0.2) |
(0.3) |
(0.3) |
(0.4) |
|
Intangible Amort – acquired |
|
|
0 |
0 |
0 |
0 |
(0.3) |
(1.0) |
(1.0) |
(1.0) |
|
Pension net finance charge |
(0.7) |
(0.9) |
(0.8) |
(0.7) |
(0.1) |
(0.2) |
(0.2) |
(0.2) |
|||
Exceptionals |
|
|
0 |
0 |
0 |
0 |
(1.8) |
2.3 |
(2.2) |
(1.0) |
|
Other |
|
|
0 |
0 |
0 |
0 |
0 |
0 |
0 |
0 |
|
Profit Before Tax (Edison norm) |
|
|
|
|
|
9.3 |
11.9 |
9.0 |
6.6 |
||
Profit Before Tax (company norm) |
|
6.4 |
7.3 |
8.1 |
8.9 |
10.4 |
12.7 |
9.5 |
7.4 |
||
Profit Before Tax (statutory) |
|
|
4.9 |
5.5 |
6.3 |
7.3 |
7.0 |
13.0 |
5.6 |
4.4 |
|
Tax |
|
|
(1.0) |
(0.5) |
(1.2) |
(1.5) |
(1.6) |
(1.1) |
(1.2) |
(0.7) |
|
Profit After Tax (norm) |
|
|
5.4 |
6.6 |
6.9 |
7.5 |
8.2 |
10.0 |
7.3 |
6.3 |
|
Profit After Tax (statutory) |
|
|
4.0 |
5.0 |
5.1 |
5.9 |
5.4 |
11.9 |
4.4 |
3.7 |
|
|
|
|
|
|
|
|
|
|
|
|
|
Average Number of Shares Outstanding (m) |
|
57.5 |
58.5 |
59.3 |
60.0 |
62.7 |
70.4 |
71.0 |
71.0 |
||
EPS - Edison norm (p) FD |
|
|
|
|
|
|
11.5 |
13.3 |
10.1 |
7.9 |
|
EPS - company norm (p) FD |
|
|
9.4 |
10.7 |
11.2 |
11.6 |
12.9 |
14.4 |
10.8 |
9.2 |
|
EPS - statutory (p) |
|
|
6.9 |
8.6 |
8.6 |
9.8 |
8.6 |
16.9 |
6.2 |
5.2 |
|
Dividend per share (p) |
|
|
1.5 |
1.9 |
2.3 |
2.9 |
3.6 |
4.4 |
3.2 |
0.5 |
|
|
|
|
|
|
|
|
|
|
|
|
|
Gross Margin (%) |
|
|
60.1 |
61.3 |
60.8 |
59.2 |
60.8 |
60.8 |
60.0 |
61.1 |
|
EBITDA Margin (%) |
|
|
11.4 |
12.4 |
12.8 |
13.4 |
14.1 |
14.0 |
11.4 |
9.9 |
|
Op Margin (Edison norm) (%) |
|
7.7 |
8.3 |
8.8 |
9.3 |
10.2 |
10.9 |
8.2 |
6.3 |
||
|
|
|
|
|
|
|
|
|
|
|
|
BALANCE SHEET |
|
|
|
|
|
|
|
|
|
|
|
Fixed Assets |
|
|
18.5 |
21.1 |
21.5 |
18.9 |
47.5 |
47.7 |
46.0 |
52.3 |
|
Intangible Assets |
|
|
6.7 |
7.3 |
7.2 |
7.1 |
31.6 |
31.8 |
30.8 |
29.8 |
|
Tangible Assets |
|
|
9.8 |
11.7 |
12.7 |
11.7 |
15.8 |
16.0 |
15.2 |
22.5 |
|
Investments |
|
|
2.0 |
2.2 |
1.6 |
0.1 |
0.0 |
0.0 |
0.0 |
0.0 |
|
Current Assets |
|
|
32.6 |
35.3 |
37.1 |
40.3 |
51.3 |
52.1 |
49.3 |
52.1 |
|
Stocks |
|
|
16.8 |
18.4 |
22.0 |
18.1 |
30.3 |
29.5 |
28.0 |
28.5 |
|
Debtors |
|
|
12.8 |
13.9 |
14.1 |
19.3 |
19.5 |
21.3 |
18.9 |
20.5 |
|
Cash |
|
|
2.9 |
2.8 |
1.0 |
2.9 |
1.5 |
1.3 |
2.4 |
3.1 |
|
Other |
|
|
0.1 |
0.2 |
0.0 |
0.0 |
|
|
|
|
|
Current Liabilities |
|
|
(17.3) |
(19.4) |
(20.7) |
(19.4) |
(34.8) |
(28.9) |
(23.8) |
(27.5) |
|
Creditors |
|
|
(16.9) |
(19.0) |
(20.3) |
(19.0) |
(28.0) |
(22.4) |
(21.8) |
(25.8) |
|
Short term borrowings |
|
|
(0.4) |
(0.4) |
(0.4) |
(0.4) |
(6.8) |
(6.6) |
(2.0) |
(1.7) |
|
Long Term Liabilities |
|
|
(9.6) |
(10.2) |
(10.9) |
(4.5) |
(12.7) |
(9.1) |
(10.6) |
(12.1) |
|
Long term borrowings |
|
|
(1.4) |
(0.9) |
(0.6) |
(0.2) |
0.0 |
0.0 |
0.0 |
0.0 |
|
Other long term liabilities |
|
|
(8.2) |
(9.2) |
(10.4) |
(4.3) |
(12.7) |
(9.1) |
(10.6) |
(12.1) |
|
Net Assets |
|
|
24.2 |
26.9 |
26.9 |
35.3 |
51.3 |
61.8 |
60.9 |
64.8 |
|
|
|
|
|
|
|
|
|
|
|
|
|
CASH FLOW |
|
|
|
|
|
|
|
|
|
|
|
Operating Cash Flow |
|
|
6.0 |
6.2 |
3.5 |
7.1 |
12.4 |
7.0 |
12.6 |
9.6 |
|
Net Interest |
|
|
(0.2) |
(0.2) |
(0.2) |
(0.1) |
(0.2) |
(0.2) |
(0.3) |
(0.5) |
|
Tax |
|
|
(0.0) |
(0.0) |
(0.0) |
(0.6) |
(2.3) |
(2.2) |
(0.8) |
(0.8) |
|
Capex |
|
|
(3.1) |
(4.7) |
(3.2) |
(2.5) |
(6.7) |
(3.5) |
(2.8) |
(2.4) |
|
Acquisitions/disposals |
|
|
0.0 |
0.0 |
0.0 |
0.0 |
(27.1) |
0.0 |
0.0 |
0.0 |
|
Financing |
|
|
(0.1) |
(0.0) |
(0.4) |
(0.1) |
18.3 |
1.8 |
0.0 |
0.0 |
|
Dividends |
|
|
(0.7) |
(0.9) |
(1.1) |
(1.4) |
(1.8) |
(2.7) |
(3.1) |
(2.2) |
|
Net Cash Flow |
|
|
1.8 |
0.3 |
(1.5) |
2.3 |
(7.4) |
0.1 |
5.7 |
3.7 |
|
Opening net debt/(cash) |
|
|
0.7 |
(1.2) |
(1.5) |
(0.0) |
(2.3) |
5.3 |
5.3 |
(0.4) |
|
Net finance leases |
|
|
0.0 |
0.0 |
0.0 |
0.0 |
(0.0) |
0.0 |
0.0 |
(2.7) |
|
Other |
|
|
0.0 |
0.0 |
0.0 |
0.0 |
(0.2) |
(0.1) |
0.0 |
(0.0) |
|
Closing net debt/(cash) |
|
|
(1.2) |
(1.5) |
(0.0) |
(2.3) |
5.3 |
5.3 |
(0.4) |
(1.3) |
|
Lease finance (under IFRS 16) |
|
|
|
|
|
|
|
|
|
8.4 |
|
Source: Walker Greenbank, Edison Investment Research. Note: Edison norm deducts pension scheme and LTIP costs from company adjusted norm. 2018 results restated for IFRS 15 Revenue from Contracts with Customers; the primary P&L effects were to reclassify some marketing materials/services as net other income and carriage recoveries to revenue and, as they were previously netted out of distribution costs, increase this cost line. From FY20 figures are presented on an IFRS 16 basis.
|
|
Over the last 18 months, Powerhouse has cemented its relationship with Peel Environmental, which is targeting the development of at least 30 distributed modular generation (DMG) plants across the UK. Each of these will potentially generate £0.5m in annual licence fees for Powerhouse. This roll-out is conditional on shareholders approving the proposed acquisition of former development partner Waste2Tricity (W2T) at the general meeting on 14 July.