Last close As at 05/08/2026
—
— 0.00 (0.00%)
Market capitalisation
—
Research: Investment Companies
Securities Trust of Scotland (STS) aims to achieve long-term income and capital growth through a fundamental approach to global equity investment. The manager, Mark Whitehead, is not constrained by index considerations and focuses on finding 35–55 high-quality companies with sustainable business models and financial resilience, in which to invest for a three- to five-year horizon. He also utilises the trust’s ability to employ options strategies in a controlled manner to generate additional income. STS’s board adopts a progressive dividend policy and, over the past three years, the annual dividend has increased by 24%. It has also recently refreshed the trust’s marketing strategy, and appointed a new independent director, Sarah Harvey, who has considerable expertise in this area.
Written by
Securities Trust of Scotland |
High-conviction global equity income portfolio |
Investment trusts |
26 February 2019 |
Share price/discount performance
Three-year performance vs index
Gearing
Analysts
|
|||||||||||||||||||||||||||||||||||||||||||||||||||||||||||||||||||||||||||||||||||||||||
Securities Trust of Scotland (STS) aims to achieve long-term income and capital growth through a fundamental approach to global equity investment. The manager, Mark Whitehead, is not constrained by index considerations and focuses on finding 35–55 high-quality companies with sustainable business models and financial resilience, in which to invest for a three- to five-year horizon. He also utilises the trust’s ability to employ options strategies in a controlled manner to generate additional income. STS’s board adopts a progressive dividend policy and, over the past three years, the annual dividend has increased by 24%. It has also recently refreshed the trust’s marketing strategy, and appointed a new independent director, Sarah Harvey, who has considerable expertise in this area.
12 months ending |
Share price |
NAV |
Blended |
FTSE All-Share |
MSCI World |
31/01/15 |
1.7 |
12.1 |
16.2 |
7.1 |
17.7 |
31/01/16 |
(2.5) |
(2.6) |
1.0 |
(4.6) |
1.1 |
31/01/17 |
34.4 |
27.3 |
29.6 |
20.1 |
32.8 |
31/01/18 |
9.1 |
11.8 |
8.7 |
11.3 |
11.9 |
31/01/19 |
(3.4) |
(3.4) |
4.6 |
(3.8) |
1.6 |
Source: Refinitiv. Note: All % on a total return basis in pounds sterling. Blended benchmark is FTSE All-Share Index until 31 July 2011, MSCI World High Dividend Yield Index until 31 May 2016 and the rolling three-year median return of open- and closed-ended peers thereafter.
Investment strategy: Robust, proprietary process
Whitehead has a robust investment approach, which involves proprietary screening of stocks, detailed evaluation of companies, and includes credit analysis to determine the sustainability of cash flows and balance sheet resilience in adverse economic scenarios. The manager is also an industry leader in environmental, social and governance (ESG) analysis, which is an integrated and key part of the investment process.
Market outlook: Influenced by geopolitics
The US Federal Reserve chairman’s recent change in stance to maintain accommodative monetary policy is supportive for the US economy and its stock market. Coupled with more reasonable global equity valuations, following a sharp correction in Q418 when investors feared prospects of a US recession, MSCI World has recovered c 11% this year. However, geopolitical factors, including the ongoing US-China trade dispute and Brexit, are likely to continue to heavily influence the direction of equity markets in the near term.
Valuation: Marketing refresh may narrow discount
STS trades at a 6.1% discount to its cum-income NAV, which is broadly in line with the three-year average of 6.4%. The board has recently taken measures to improve demand for STS’s shares from existing and new shareholders, including a material increase in the marketing budget provided by the manager and a refresh of the strategy. These efforts may help narrow the trust’s discount.
Exhibit 1: Trust at a glance
Investment objective and fund background |
Recent developments |
||||||||||||||||||||||||||||||||||||||||||||||||||||||||||||||||||||||
Securities Trust of Scotland’s investment objective is to provide rising income and long-term capital growth from a portfolio of global equities. Following the adoption of an unconstrained mandate from 1 June 2016, the trust measures its performance versus the rolling three-year median return of open- and closed-ended peers, as well as an absolute target to produce real growth in revenue and cum-income NAV on a rolling five-year basis. |
■ 16 January 2019: announcement of third interim dividend of 1.45p per share. ■ 21 November 2018: interim results for six months ending 30 September. NAV TR +11.1% versus peer group +10.7%. Share price TR +8.9%. Declared second interim dividend of 1.45p per share. ■ 19 September 2018: announcement of first interim dividend for FY19 of 1.45p per share. |
||||||||||||||||||||||||||||||||||||||||||||||||||||||||||||||||||||||
Forthcoming |
Capital structure |
Fund details |
|||||||||||||||||||||||||||||||||||||||||||||||||||||||||||||||||||||
AGM |
September 2019 |
Ongoing charges |
0.9% |
Group |
Martin Currie Investment Mgmt (UK) |
||||||||||||||||||||||||||||||||||||||||||||||||||||||||||||||||||
Annual results |
June 2019 |
Net gearing |
10.2% |
Manager |
Mark Whitehead |
||||||||||||||||||||||||||||||||||||||||||||||||||||||||||||||||||
Year end |
31 March |
Annual mgmt fee |
(see page 7) |
Address |
Saltire Court, 20 Castle Terrace, Edinburgh EH1 2ES |
||||||||||||||||||||||||||||||||||||||||||||||||||||||||||||||||||
Dividend paid |
Quarterly |
Performance fee |
None |
||||||||||||||||||||||||||||||||||||||||||||||||||||||||||||||||||||
Launch date |
28 June 2005 |
Trust life |
Indefinite |
Phone |
+44 (0) 131 229 5252 |
||||||||||||||||||||||||||||||||||||||||||||||||||||||||||||||||||
Continuation vote |
None |
Loan facilities |
£25m (see page 7) |
Website |
|||||||||||||||||||||||||||||||||||||||||||||||||||||||||||||||||||
Dividend policy and history (financial years) |
Share buyback policy and history (financial years) |
||||||||||||||||||||||||||||||||||||||||||||||||||||||||||||||||||||||
Dividends are paid quarterly in October, January, April and July. Dividends were increased in FY16 after the announcement of a new progressive dividend policy. |
Renewed annually, the trust has authority to purchase up to 14.99% and allot up to 5% of issued share capital. |
||||||||||||||||||||||||||||||||||||||||||||||||||||||||||||||||||||||
|
|
||||||||||||||||||||||||||||||||||||||||||||||||||||||||||||||||||||||
Shareholder base (as at 31 January 2019) |
Portfolio exposure by geography (as at 31 January 2019, net of cash, gearing and option exposure) |
||||||||||||||||||||||||||||||||||||||||||||||||||||||||||||||||||||||
|
|
||||||||||||||||||||||||||||||||||||||||||||||||||||||||||||||||||||||
Top 10 holdings (as at 31 January 2019) |
|||||||||||||||||||||||||||||||||||||||||||||||||||||||||||||||||||||||
|
|||||||||||||||||||||||||||||||||||||||||||||||||||||||||||||||||||||||
Source: Securities Trust of Scotland, Edison Investment Research, Bloomberg, Morningstar. Note: *N/A where not in January 2018 top 10.
Market outlook: Scope for improved investor sentiment
A year ago most major equity markets were near their all-time peaks, fuelled by synchronous global growth, unprecedentedly low interest rates and strong earnings momentum (Exhibit 2, LHS). Investor sentiment started to turn more cautious in early 2018 as central banks were widely expected to reverse quantitative easing, signalling less favourable liquidity conditions and higher interest rates. However, geopolitical developments last year were more influential than expected and amplified economic risks for equity markets. These include an ongoing US-China trade dispute, worsening scenarios for Brexit outcomes and political impasse in the US, which led to a government shutdown. Both the FTSE All-Share and MSCI World indices finished 2018 near their 12-month lows. Global equities have recovered c 11% since the start of 2019 led by the US, where the central bank recently shifted its stance on monetary policy, reversing investor expectations for further interest rate hikes. Geopolitical developments are likely to continue to influence the direction of markets for the time being and earnings expectations are moderating, creating a challenging backdrop for global equities. However, investor sentiment is fragile and there is scope for improvement on positive news. Meanwhile, as shown in Exhibit 2 (RHS), valuations appear less stretched, particularly for UK equities.
|
Exhibit 2: Market performance and valuation |
|||||||||||||||||||||||||||||||||||||||||||||||||||||||||||||||||||
Performance of indices (over last 10 years, in sterling terms) |
Valuation metrics |
||||||||||||||||||||||||||||||||||||||||||||||||||||||||||||||||||
|
|
||||||||||||||||||||||||||||||||||||||||||||||||||||||||||||||||||
|
Source: Refinitiv, Edison Investment Research. Note: Valuation metrics at 22 February 2019. |
|||||||||||||||||||||||||||||||||||||||||||||||||||||||||||||||||||
Fund profile: Unconstrained and high conviction
STS aims to achieve rising income and long-term capital growth through investment in a balanced and diversified portfolio of global equities. The trust has been managed by Mark Whitehead since May 2016; shortly after that it adopted an unconstrained mandate, focusing on identifying stocks for their long-term sustainable growth and positive dividend prospects. The investment approach is fundamental and the manager targets holds 35–55 high conviction stocks, the majority of which are larger companies with market capitalisations over £1bn. Performance is measured against the median of all relevant open- and closed-ended peers (sourced from the Morningstar Global Equity Income and AIC Global Equity Income sectors) on a rolling three-year basis.
STS is permitted to have net gearing up to 20% of its NAV and can use derivatives in a careful and controlled manner. Whitehead uses options strategies to generate additional income for the trust, predominantly by selling puts. The approach is tactical and puts are only sold on companies that already on the approved stock list. Options income can account for around 10% of total portfolio income per year. At end January 2019, STS had active options exposure of 1.5%.
The fund manager: Mark Whitehead
The manager’s view: Improving backdrop but Europe difficult
Whitehead has become more optimistic about global equities. He believes the US Federal Reserve chairman’s recent shift, back to a more accommodative stance on monetary policy, is supportive for US equities. Previously, he expected relatively aggressive interest rate hikes this year that, combined with a trade dispute with China and the waning effects of 2018 tax cuts, would result in a significant slowdown in the US economy. As indicated by a sharp correction in US equities in Q418, investors had begun to consider the prospect of a recession. Whitehead believes there is now low likelihood of interest rates rising this year and equity valuations, following the correction, are attractive.
Whitehead also thinks the outlook for China is improving. Its economic slowdown last year, exacerbated by its trade dispute with the US, has been a drag on global growth and sentiment. The MSCI China index was one of the worst performers last year, declining 23% (in US dollar terms), However, Whitehead believes efforts by the Chinese government to stimulate its economy should bear fruit. Measures include cuts to the level of reserves banks are required to hold (to encourage more lending), reductions in personal taxes and increased government spending on large infrastructure projects.
In the manager’s view, Europe has the most difficult equity environment. He believes Germany is flirting with recession and the uncertain outcomes for Brexit are unhelpful. Consumer confidence is very weak; however, he thinks it would not be difficult for sentiment to improve meaningfully. Whitehead believes European equities’ weak performance has already reflected many concerns and valuations are reasonable and, in particular, UK domestically oriented stocks look undervalued.
Asset allocation
Investment process: Rigorous focus on quality and resilience
The manager follows a disciplined, bottom-up approach to find quality companies that can deliver attractive and sustainable income streams over a three- to five-year investment horizon. With an unconstrained global mandate, STS’s investment universe contains nearly 3,000 stocks. Whitehead initially deploys a proprietary screen to filter companies on the basis of growth, quality and valuation characteristics. This reduces the universe to fewer than 1,000 stocks, which are then subject to further qualitative screening and fundamental analysis to arrive at an approved stock list of around 70–90 companies. These undergo rigorous detailed financial modelling, including a credit analysis. Considerable attention is paid to the capital structure of the business, managements’ track record on capital allocation and the sustainability of cash flows and the ability to pay dividends. Companies are stress tested to assess liquidity and financial resilience under adverse economic scenarios. ESG evaluation is integrated into the investment process and helps determine the manager’s conviction levels (Martin Currie is an industry leader in ESG analysis). The manager also ensures the portfolio is well diversified across countries and sectors.
Current portfolio positioning
Exhibit 3 shows the portfolio’s sector exposure at end-January 2019. During 2018, Whitehead became more cautious on the prospects for global economic growth. He found valuations to be demanding and expected interest rates and liquidity conditions to become less favourable. The manager also believed political factors, including the trade dispute between the US and China, could take a toll on global economic growth. As a result, he reduced the portfolio’s holdings in cyclically exposed stocks in favour of more defensive businesses.
The most significant sector reduction in STS’s exposure over the past year was to financials
(-9.5pp). Sales included Huntingdon Bancshares (US) following a period of good performance for the sector and in view of the manager’s concern for slowing US economic growth in H218. Manulife (Canada) was sold following a review of the company, which identified potential long-term structural headwinds for capital requirements. In the UK, insurer Hastings was sold as Whitehead believed regulatory changes, intense competition and pricing pressure presented increasing challenges for the company. Activity within the financials sector also included the purchase of Caixa Bank, the largest retail bank and non-life insurer in Spain. Unlike the companies sold, which operate in countries where economic recoveries are more advanced, Spain’s economic downturn following the global financial crisis was more acute and its banking sector is still at a relatively early stage of recovery. Other sales to reduce the portfolio’s cyclicals exposure included paper packaging company DS Smith (UK), pulp and paper company International Paper (US), paint manufacturer Akzo Nobel (the Netherlands) and electrical products manufacturer Schneider Electric. These sales reduced the portfolio’s exposure to materials (-2.8pp) and cyclical industrials. The overall weight in industrials, however, increased by 0.6pp reflecting the purchase of Lockheed Martin (US), which the manager believes has non-cyclical businesses. As a global security and aerospace company, demand for its products and services are less sensitive to economic cycles. Its biggest customers are governments and orders have long production lead times, resulting in relatively stable and predictable revenues. Whitehead believes the company’s long-term guidance is conservative and long-term demand for new products (such as the F-35 fighter) to be stronger than expected and that margins can improve following a period of investment.
Exhibit 3: Portfolio sector exposure* (% unless stated)
Portfolio end-January 2019 |
Portfolio end-January 2018 |
Change (pp) |
|
Financials |
16.2 |
25.7 |
(9.5) |
Consumer staples |
13.8 |
7.9 |
5.9 |
Industrials |
12.9 |
12.3 |
0.6 |
Information technology |
12.1 |
12.6 |
(0.5) |
Healthcare |
11.2 |
8.4 |
2.8 |
Utilities |
8.4 |
3.7 |
4.7 |
Materials |
7.8 |
10.6 |
(2.8) |
Energy |
7.6 |
7.5 |
0.1 |
Communication services |
7.5 |
6.1 |
1.4 |
Consumer discretionary |
7.4 |
7.4 |
0.0 |
Real estate |
5.3 |
6.0 |
(0.7) |
Cash |
3.8 |
1.9 |
1.9 |
Active options exposure |
1.5 |
1.6 |
(0.1) |
Gearing |
(14.0) |
(11.7) |
(2.3) |
Source: Securities Trust of Scotland, Edison Investment Research. *Active options exposure means allocations may not total 100%.
The largest increase in sector exposure over the past year is consumer staples (+5.9pp). The manager added to the portfolio’s holding in US-listed consumer goods conglomerate Procter & Gamble. He thinks the company can return to generating good organic growth following a period of restructuring involving a refocus on its strongest brands, selling non-core assets and improving its cost structure. Whitehead says the stock trades at a discount to its peers, while paying an attractive 3.5% yield. A new position was also purchased in food conglomerate Danone (France), which the manager believes can deliver mid- to high-single-digit organic sales growth. The company has made a number of acquisitions in recent years, which has shifted the portfolio in favour of higher growth health and wellness products, reducing exposure to low-growth dairy products. Over the past year, STS also increased its exposure to the less economically sensitive utilities (+4.7pp) and healthcare (+2.8pp) sectors, where Whitehead added to existing positions in Merck (US) and Sanofi (France). At end January 2019, Merck was the largest holding on the portfolio. The manager believes the company is a leader in multiple medical research fields including oncology and immunology.
Performance: Near term in line with benchmark
Since June 2016 STS has measured its performance against the median of all relevant open- and closed-ended peers (sourced from the Lipper Global Equity Income and AIC Global Equity Income sectors respectively) on a rolling three-year basis. In addition, given the change in investment mandate from May 2016, the most relevant performance periods are one, three and six months and one year. As shown in Exhibit 5, STS’s NAV total return has slightly outperformed the benchmark, the FTSE All-Share index and the MSCI World index over one and three months. It has slightly underperformed its benchmark over six months and one year. This partly reflects the predominance in the benchmark of open-ended funds, which are not permitted to use leverage. Leverage typically amplifies upward as well as downward performance in markets and Q418 saw a sharp correction in US equities, the largest geographical component for global equities. The manager remains focused on long-term performance and is not influenced by shorter-term performance volatility.
|
Exhibit 4: Investment trust performance to 31 January 2019 |
|
Price, NAV and benchmark total return performance, one-year rebased |
Price, NAV and benchmark total return performance (%) |
|
|
|
Source: Refinitiv, Edison Investment Research. Note: Three, five and 10-year performance figures annualised. Blended benchmark is FTSE All-Share Index until 31 July 2011, MSCI World High Dividend Yield Index until 31 May 2016 and the rolling three-year median return of open- and closed-ended peers thereafter. |
|
Exhibit 5: Share price and NAV total return performance, relative to indices (%)
|
One month |
Three months |
Six months |
One year |
Three years |
Five years |
10 years |
Price relative to blended benchmark |
1.6 |
2.4 |
(0.3) |
(1.8) |
1.7 |
(14.1) |
(4.3) |
NAV relative to blended benchmark |
1.1 |
0.8 |
(2.1) |
(1.9) |
(1.3) |
(8.2) |
(6.3) |
Price relative to FTSE All-Share |
0.7 |
2.1 |
3.2 |
0.5 |
10.3 |
7.0 |
23.0 |
NAV relative to FTSE All-Share |
0.2 |
0.5 |
1.3 |
0.4 |
7.0 |
14.4 |
20.5 |
Price relative to MSCI World |
0.5 |
2.8 |
(0.5) |
(4.9) |
(6.2) |
(21.8) |
(5.9) |
NAV relative to MSCI World |
0.0 |
1.2 |
(2.3) |
(5.0) |
(9.0) |
(16.5) |
(7.8) |
Source: Refinitiv, Edison Investment Research. Note: Data to end January 2019. Geometric calculation.
|
Exhibit 6: NAV total return performance relative to benchmark over three years (%) |
|
|
Source: Refinitiv, Edison Investment Research |
Discount: Wider than peers with scope to narrow
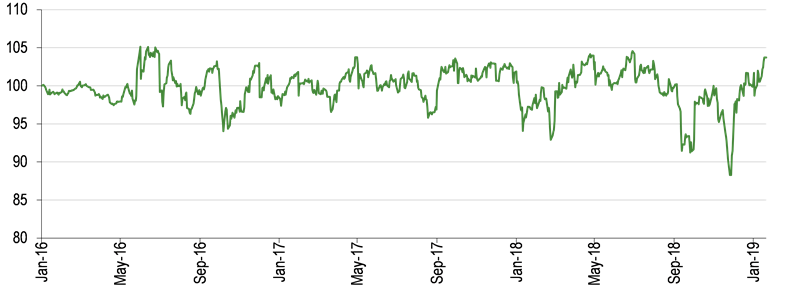
STS trades at a 6.1% discount to its cum-income NAV, which is broadly in line with the three-year average of 6.4%, but wider than most of its peers. The board takes a proactive approach to managing the discount and reducing its volatility. It has the authority to repurchase up to 14.99% of issued capital (renewable annually) and, if the average discount exceeds 7.5% in the 12 weeks prior to the financial year end, a redemption opportunity is triggered. The board believes the best and most sustainable way to manage the discount is to increase demand for STS’s shares from existing and new customers. In August 2018, it announced a material increase in the marketing budget provided by the manager and a refresh of the company’s strategy. These efforts may help to narrow the trust’s discount to NAV.
|
Exhibit 7: Share price discount to NAV (including income) over three years (%) |
|
|
Source: Refinitiv, Edison Investment Research |
Capital structure and fees
STS is a conventional investment trust with one class of share; there are 104.7m ordinary shares in issue and 17.6m shares held in treasury. In September 2016, the board took advantage of low interest rates and agreed a seven-year, £15m multi-currency, fixed-rate facility, alongside a £10m revolving credit facility with the Royal Bank of Scotland. At end January 2019, the facilities were fully drawn and STS had net gearing of 10.2%.
In June 2018, the board announced a change to the management fee payable to Martin Currie Investment Management. With effect from 1 April 2018, an annual fee of 0.6% is applied to net assets of up to £200m, reducing to 0.4% of net assets above £200m. The fee is paid out of capital and income (in the ratio of 63:35) reflecting the board’s expected long-term split of returns between capital gains and income. At 30 September 2018, the trust’s ongoing charges were 0.9%.
Dividend policy and record
In alignment with the trust’s objective to deliver rising income and long-term capital growth to shareholders, the board adopted a progressive dividend policy in FY16, which allows the use of retained capital profits when necessary. It believes this policy gives the manager greater flexibility to hold stocks with higher growth potential and slightly lower yields. Since the adoption of this policy, over the past three years STS has delivered a 24% increase in the annual dividend. The FY18 total dividend of 6.1p per share included a first-time contribution of 0.27p from capital. Dividends are payable four times a year in October, January, April and July. So far in FY19, the board has declared three interim dividends of 1.45p per share (unchanged from FY18).
Peer group comparison
Exhibit 8 shows the AIC Global Equity Income peer group of funds (with a track record of over one year). Within this relatively small group of seven trusts, there is a broad range of investment mandates so direct comparisons may be less relevant. We have included average data from the much larger Investment Association Global Equity Income sector (with over 50 funds) for reference. STS’s NAV total returns rank second over one year, sixth over three and five years, and third over 10 years, with the 10-year performance significantly above the open-ended average. The trust’s ongoing charge ranks second; however, it does not charge a performance fee. Although its dividend yield ranks fourth, it is comparable to most of its peers and the sector average has been skewed by Blue Planet’s 13% yield (which reflects a different mandate with over half of its portfolio held in bonds and high yield instruments). STS ranks sixth in terms of its discount to cum-fair NAV.
Exhibit 8: AIC Global Equity Income peer group as at 22 February 2019*
% unless stated |
Market cap/ |
NAV TR |
NAV TR |
NAV TR |
NAV TR |
Discount (cum-fair) |
Ongoing charge |
Perf. |
Net gearing |
Dividend yield (%) |
Securities Trust of Scotland |
176.3 |
4.6 |
43.8 |
51.9 |
253.2 |
(6.6) |
0.9 |
No |
110 |
3.6 |
Blue Planet Investment Trust |
18.8 |
(0.5) |
37.6 |
4.4 |
|
(14.1) |
3.7 |
No |
102 |
12.6 |
Henderson International Income |
280.3 |
0.1 |
44.4 |
61.9 |
|
1.5 |
0.8 |
No |
97 |
3.4 |
Invesco Perp Select Global Eq Inc |
62.6 |
(1.0) |
45.4 |
57.9 |
227.5 |
(2.9) |
0.8 |
Yes |
106 |
3.5 |
JPMorgan Global Growth & Income |
408.7 |
(1.9) |
61.3 |
72.5 |
305.7 |
2.1 |
0.6 |
Yes |
108 |
4.0 |
Murray International |
1,544.4 |
1.5 |
53.0 |
54.3 |
229.0 |
4.3 |
0.6 |
No |
112 |
4.3 |
Scottish American |
536.6 |
5.3 |
57.6 |
75.5 |
303.9 |
4.5 |
0.8 |
No |
114 |
0.8 |
Simple average |
432.5 |
1.1 |
49.0 |
54.1 |
263.9 |
(1.6) |
1.2 |
107 |
4.6 |
|
STS rank in sector (seven trusts) |
5 |
2 |
6 |
6 |
3 |
6 |
2 |
3 |
4 |
|
Open-ended peers simple average |
344.1 |
3.9 |
38.6 |
50.0 |
187.0 |
N/A |
1.4 |
N/A |
3.7 |
Source: Morningstar, Edison Investment Research. Note: *Performance to 21 February 2019 based on ex-par NAV. TR=total return. Net gearing is total assets less cash and equivalents as a percentage of net assets.
The board
STS’s board consists of five independent non-executive directors, chaired by Rachel Beagles (appointed in 2010 and assumed her role in 2016). Angus Gordon Lennox is the senior independent director (appointed in 2013 and assumed his role in 2017). Mark Little was appointed in 2014 and John Evans in 2016. Sarah Harvey was appointed in October 2018 and has assumed the role of chairman of the marketing and communications committee.
|
|
Year-end comments confirm FY19 results are expected to be in line with management estimates. Strong Licensing performance is likely to have contributed meaningfully to this outcome and towards an ungeared balance sheet position. UK market trends remain weak and cause us to reduce our earnings estimates by 20–25% for FY20 and FY21 although, in the absence of fresh guidance, we have assumed that DPS is maintained at FY18 levels ahead of FY19 results, which are scheduled for 10 April.