National Grid’s high visibility revenues, underwritten by regulatory returns across the UK and US, offer equity holders an attractive combination of asset growth and a 4.3% dividend yield. Both the UK and US businesses are well run. The UK business has predictability of revenues until the end of the current regulatory period in 2021 and is delivering returns ahead of OFGEM’s expected ‘base returns’. In the US, a rate filing programme is underway, which will result in enhanced returns in the years ahead. Now that the sale of the UK Gas Distribution is complete, management can continue to focus on delivering shareholder returns across its business units. Management targets 5-7% asset growth, and our fair value per ADR of $69.40 offers 9.1% upside versus current prices.
Written by
National Grid |
Growth and returns |
Corporate outlook |
Utilities |
28 April 2017 |
ADR research
ADR share price performance
Business description
Next events
Analysts
National Grid is a research client of Edison Investment Research Limited |
|||||||||||||||||||||||||||||||||
National Grid’s high visibility revenues, underwritten by regulatory returns across the UK and US, offer equity holders an attractive combination of asset growth and a 4.3% dividend yield. Both the UK and US businesses are well run. The UK business has predictability of revenues until the end of the current regulatory period in 2021 and is delivering returns ahead of OFGEM’s expected ‘base returns’. In the US, a rate filing programme is underway, which will result in enhanced returns in the years ahead. Now that the sale of the UK Gas Distribution is complete, management can continue to focus on delivering shareholder returns across its business units. Management targets 5-7% asset growth, and our fair value per ADR of $69.40 offers 9.1% upside versus current prices.
Year end |
Revenue (US$m) |
PTP |
EPADR |
DPADR |
P/E |
Gross yield |
03/15 |
19,777 |
3,566 |
3.61 |
2.65 |
18.0 |
4.1 |
03/16 |
18,986 |
3,896 |
3.95 |
2.68 |
16.5 |
4.1 |
03/17e |
21,204 |
4,432 |
4.43 |
2.72 |
14.7 |
4.2 |
03/18e |
18,946 |
3,588 |
3.90 |
7.83 |
16.7 |
12.0 |
Note: Converted at US$1.24/£. Gross yield excludes withholding tax. Investors should consult their tax advisor regarding the application of any domestic and foreign tax laws.
UK asset sale soon to be completed…
Since the UK Gas Distribution business was put up for sale, National Grid’s (NG) solid underlying equity story has been overshadowed by the sales process. Now that buyers have been found, and cash returns are scheduled in calendar Q217, we believe the market can refocus on NG’s remaining businesses – UK Electric Transmission, UK Gas Transmission, US Regulated (Electricity Transmission, Electricity Distribution and Gas Transmission) – which all offer strong prospects and most of which are outperforming.
…allowing a renewed focus on fundamentals
NG’s key underlying attraction remains its highly visible, non-cyclical, regulated cash flows. We forecast that, by 2021, Grid will generate £23.8bn of post-tax operating cash flow. Additionally, NG’s asset base will grow, driven by an average annual capex spend of over £3.9bn, and dividends will grow every year across our forecast period. The asset base growth and a dividend yield of 4.3% give what Grid’s management refers to as total shareholder returns (TSR) of nearly 10%.
Valuation: $69.40/ADR, but beware rising bond yields
We use a blended average of a sum-of-the-parts valuation and a peer-based multiple model. Our SOTP is driven by a segment-based premium to regulatory asset value (RAV)/asset base model, which implies a fair value per ADR of $63.90, while our multiple-derived model offers a fair value per ADR of $74.90. The average of $69.40 offers equity holders 9.1% upside to current levels. We highlight rising government bond yields as a key risk for investors owing to NG’s bond proxy status.
Investment summary: Refocus post disposal
Company description: Stability, growth, returns
Due to its unique end-market exposure to UK and US regulated power and gas infrastructure, National Grid is able to offer US-based ADR holders solid asset-backed returns, supported by well-established regulatory regimes. 5-7% asset growth coupled with an attractive yield of 4.3% (based on $63.62/ADR) gives equity holders an attractive combination of growth and income. With the disposal of its UK Gas Distribution business for an implied EV of £13.8bn ($17.25bn) and a cash consideration of £5.4bn ($6.75bn), management has demonstrated an admirable focus on crystallising value for shareholders. Now that the deal has completed, NG’s leadership can continue to focus its energies on unlocking shareholder value by engaging with regulators in the US and UK and continuing with its five-year £21.5bn ($26.9bn) investment plan (note, this plan will be reduced following the disposal), ensuring continued long-term shareholder value.
Valuation: 9% upside, but rising yields a risk
Our fair value per ADR of $69.40 is derived firstly from a sum-of-the-parts model, which is driven by a segment premium to RAV model. We also factor in relative EV/EBITDA multiples of national Grid’s closest peers in arriving at our fair value per ADR. Investors should be aware of two key risks for the stock:
■
Macro issues: historically, NG’s share price has moved inversely to long-dated UK government bonds. We explore this in our valuation section, but we highlight this as a key risk for equity holders, especially as central banks globally consider tightening.
■
Technical issues: around £4.0bn of the £5.4bn ($6.75bn) proceeds from the UK Gas Distribution sale will be returned to shareholders in early 2017. This could distort the share price in the coming months. As could the share colsolidation.
Financials: Better FY17 and disposal in FY18
Due to the regulated nature of Grid’s businesses, there is little change to our last set of published numbers from November 2016 in the near term. Grid released technical guidance in March that indicated that due to “overcollection” in both the US and UK, the company will generate earnings ahead of expectations although this is a temporary phenomenon. The biggest change is obviously in FY18, when the company will deconsolidate the UK Gas Distribution business and account for the remaining 39% stake as an associate. Finally, since we last published, the pound has weakened from $1.30 to $1.29 (although our central FX assumption is $1.24). For an underlying forecast change table in sterling as reported, see Exhibit 14.
Exhibit 1: Forecast change table
EPADR (US$) |
PTP (US$m) |
EBITDA (US$m) |
|||||||
Old |
New |
% chg. |
Old |
New |
% chg. |
Old |
New |
% chg. |
|
2017e |
4.22 |
4.43 |
+5.0 |
4,202 |
4,432 |
+5.5 |
7,573 |
7,876 |
+4.0 |
2018e |
4.39 |
3.90 |
-11.1 |
4,399 |
3,588 |
-18.5 |
7,907 |
6,112 |
-22.7 |
Source: Edison Investment Research
An attractive mix of stable growth and high returns
NG’s core competencies are managing relationships with utility regulators and other stakeholders and managing significant infrastructure investments. By combining those skill sets and relationships, the group has been able to deliver solid growth and returns for shareholders thanks to its outperformance versus its allowed returns.
Strategy: A focus on higher-growth, regulated utility networks
National Grid owns and operates a unique geographical combination of regulated gas and electricity networks in the US and UK. The company has accumulated the high degree of necessary competence in engagement with regulators, government agencies and consumer groups to enable the strong operational performance of its networks. The recent disposal of the UK Gas Distribution business shows Grid’s commitment to higher-growth businesses and its determination to crystallise value for shareholders.
Value driven by asset growth and shareholder returns
National Grid’s regulated asset base (‘RAV’ in the UK and ‘rate base’ in the US) underpins shareholder returns and the stock’s equity valuation. The interests of energy consumers as well as National Grid’s shareholders are aligned provided the company can grow its asset base by investing efficiently in grid enhancements. We are confident Grid will meet its stated objectives of growing its assets by 5-7% per year in constant currency terms. On top of this, equity holders also benefit from a generous dividend payout (63% of underlying earnings, growing at UK retail price index [RPI]), which gives a yield of 4.3% based on the current price.
Exhibit 2: Divisional summary and targets
Operating segment |
FY16 RAV |
FY16 ROE |
Notes |
Group targets |
UK Electricity Transmission |
£11.8bn |
13.9% |
Delivering investment and efficiency as planned. Preparing for competition. |
■ RAV growth 5-7% ■ Group FY16 ROE target was 12% ■ UK regulated operations to outperform by 200-300bp ■ Return proceeds from gas disposal to shareholders ■ Improve US returns ■ Grow dividend by at least RPI |
UK Gas Transmission |
£5.6bn |
12.5% |
Continuing to deliver efficiency and reliability as agreed with regulator. |
|
UK Gas Distribution |
£8.7bn |
13.0% |
Disposed – cash return in calendar Q217. |
|
US Regulated |
$18.3bn |
8.0% |
KEDNY/KEDLI, Niagara Mohawk, MA Electric all filed. MA GAS, N Mohawk in FY17. |
Source: National Grid, Edison Investment Research
UK Business
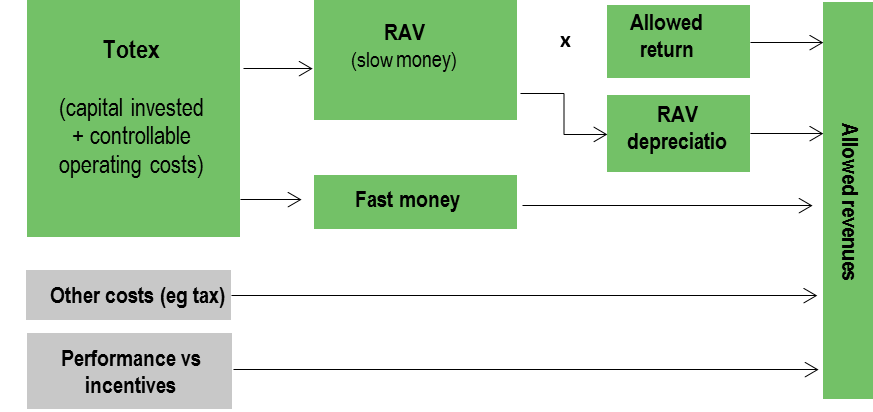
A long-established privatised utility network, which has proved an attractive draw for international capital, the UK electricity and gas grid has undergone significant regulatory changes in recent years. Introduced in 2013, the RIIO (Revenue = Incentives + Innovation + Outputs) system replaced the RPI-X regime in place since 1990 and seeks to encourage innovation in a rapidly evolving energy landscape characterised by high levels of renewable capacity requiring grid connection as well as more traditional maintenance and replacement. The economic benefits of efficiencies gained by owner operators, such as National Grid, are split between utilities and consumers.
|
Exhibit 3: UK RIIO regulatory system |
|
|
Source: National Grid, Edison Investment Research |
On top of ‘totex incentives’, which split the economic benefits of efficiencies found by network operators such as NG (£330m for customers in the first three years of RIIO), meeting further incentives such as reliability targets and customer satisfaction brings the potential for increased outperformance. By performing well on these issues as well as efficiencies, Grid was able to outperform versus its base regulatory returns on equity in FY16 (UK Electricity Transmission 13.9% RoE – 370bp outperformance, UK Gas Transmission 12.5% RoE – 250bp outperformance, UK Gas Distribution 13.0% – 310bp outperformance).
The final, potentially longer-term component of the RIIO framework is ‘Innovation’, which is intended to encourage companies such as NG to invest in new capabilities, in particular with regard to connecting renewables generation capacity as it comes on stream. The RIIO framework encourages companies to find cost-efficient solutions to issues that arise as the grid evolves.
Electricity Transmission
With a 14% increase in H117 operating profit to £697m (FY16 RoE 13.9%), albeit due to timing benefits, UK Electricity Transmission (UKET) is expected to turn in a slightly lower RoE for FY17 as the totex incentive is reduced. At the half year, capex was up by 14% to £586m, which is a good driver of long-term shareholder returns.
|
Exhibit 4: NG UK Electric Transmission key financial indicators |
|
|
Source: National Grid, Edison Investment Research |
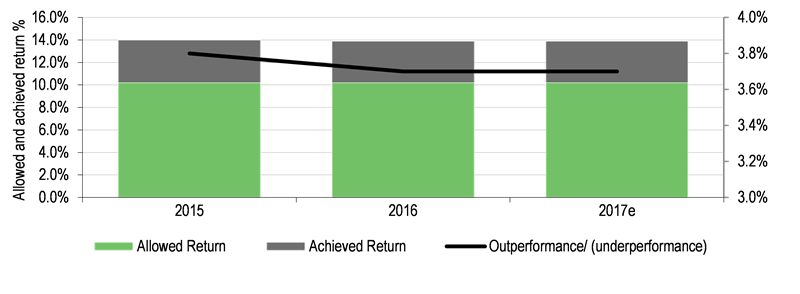
UKET aims to continue investing, with RAV growth expected to be 6% per annum to 2021, while outperformance should come from continuing management attention on efficiency and innovation.
|
Exhibit 5: NG UK Electric Transmission returns |
|
|
Source: National Grid, Edison Investment Research |
Gas Transmission
UK Gas Transmission’s (UKGT) H117 operating profit of £159m was flat half-on-half (FY16 RoE 12.5%), with less favourable timing behind the performance. Capital investment of £116m at H117 was up 27% versus H116.
|
Exhibit 6: NG UK Gas Transmission key financial indicators |
|
|
Source: National Grid, Edison Investment Research |
UKGT expects its RAV to grow ahead of RPI in FY17 and the unit continues to focus on improving its totex efficiencies after narrowly missing out on its totex objective in FY16. That said, it aims to continue to perform well versus its other incentives, which drove 120bp of outperformance in FY16.
|
Exhibit 7: NG UK Gas Transmission returns |
|
|
Source: National Grid, Edison Investment Research |
In its role as system operator, UKGT has managed the gas network well, including during periods of high demand, such as winter 2015/16
Gas Distribution: Sales proceeds to be returned to shareholders
UK Gas Distribution (UKGD) returned an operating profit of £403m at H117 (FY16 RoE 13.0%), which was a reduction of 5.8% on the same period a year earlier owing to unfavourable timing. Management is upbeat on the outlook for RoEs in this business as it performs very well versus its incentives. It is the only UK unit where management expects RoEs to increase in FY17 vs FY16. However, in UKGD the main story was the recently completed sale process. We have deconsolidated UKGD from our group EBIT forecasts and include it as an associate from FY18. We have also adjusted our cash flow statement and balance sheet for the cash inflows, debt deconsolidation and shareholder returns in the form of a special dividend and buy back.
|
Exhibit 8: NG UK Gas Distribution key financial indicators |
|
|
Source: National Grid, Edison Investment Research |
A special situation: Sales process complete
In 2015 NG management announced it was exploring a majority sale of its UKGD business. This was to reflect its apparently less attractive growth profile and underscores management’s focus on realising value for shareholders. In December 2016, the company said it had found a buyer for 61% of the business: a consortium of investors including Macquarie and China Investment Corporation. The £13.6bn valuation is 28% higher than our sum-of-the-parts valuation of £10.7bn and management has said it will return £4.0bn of proceeds (£5.4bn gross cash proceeds net of costs and some retained cash) to shareholders £3.2bn will be returned via a special dividend on June 2nd and the remainder will be returned via a buy back.
|
Exhibit 9: NG UK gas distribution returns |
|
|
Source: National Grid, Edison Investment Research |
From the beginning of FY18, the remaining 39% of the UKGD business will be accounted for in the associates and JVs line in the main P&L. We have deconsolidated the unit from our group earnings forecasts from FY18e and adjusted our sum-of-the-parts group valuation.
US Business: Addressing underperformance
With operations across New York State and New England, NG’s US business has gas and electricity infrastructure in attractive end markets in the US. In recent years, Grid’s US business has fallen behind in lodging rate filings, with the result that RoEs in the division have declined to 8.0%. As a rule of thumb, strongly performing regulated US utilities should be achieving RoEs at 90-95% of their allowed returns. The 12% increase in operating profit to £435m at H117 was a result of the strengthening dollar and favourable timing. Capex of £1,039m was up £39m in constant currency. We forecast US capex will continue to rise given the number of rate filings underway.
Playing catch up with the regulator
Exhibit 10: NG US rate base (US$m)
2016 |
2017e |
2018e |
2019e |
2020e |
2021e |
|
Long Island (KEDLI) |
2,176 |
2,343 |
2,496 |
2,703 |
2,893 |
3,043 |
Downstate New York (KEDNY) |
2,525 |
2,718 |
2,896 |
3,136 |
3,357 |
3,531 |
Upstate New York (NMPC Gas) |
1,160 |
1,249 |
1,330 |
1,441 |
1,542 |
1,622 |
Upstate New York (NMPC Electric) |
4,621 |
4,975 |
5,300 |
5,740 |
6,143 |
6,461 |
Massachusetts Electric |
2,156 |
2,321 |
2,473 |
2,678 |
2,866 |
3,015 |
Massachusetts Gas |
1,945 |
2,094 |
2,231 |
2,416 |
2,586 |
2,720 |
Narragansett Distribution (Electric and Gas) |
1,234 |
1,329 |
1,415 |
1,533 |
1,640 |
1,725 |
New England Power |
1,405 |
1,513 |
1,611 |
1,745 |
1,868 |
1,965 |
Narragansett Electric (Transmission) |
608 |
655 |
697 |
755 |
808 |
850 |
Canadian Interconnector |
11 |
12 |
13 |
14 |
15 |
15 |
Long Island Generation |
420 |
452 |
482 |
522 |
558 |
587 |
Total US rate base |
18,261 |
19,660 |
20,943 |
22,682 |
24,275 |
25,534 |
Growth |
7.7% |
6.5% |
8.3% |
7.0% |
5.2% |
|
New York Jurisdiction |
10,482 |
11,285 |
12,022 |
13,019 |
13,934 |
14,657 |
Massachusetts and Rhode Island Jurisdiction |
5,335 |
5,744 |
6,119 |
6,627 |
7,092 |
7,460 |
FERC Jurisdiction |
2,444 |
2,631 |
2,803 |
3,036 |
3,249 |
3,417 |
Total US rate base |
18,261 |
19,660 |
20,943 |
22,682 |
24,275 |
25,534 |
Source: National Grid, Edison Investment Research
Currently Grid is in the process of playing catch up with the regulator across several jurisdictions. For instance, at the half year, management stated that, upon approval, KEDNY and KEDLI were expected to be awarded an allowed return of 9% versus the 7.1% and 7.3% they achieved in FY16. Niagara Mohawk is also expected to see an increase in achieved return.
Exhibit 11: NG US RoEs
2016 |
2017e |
2018e |
2019e |
2020e |
2021e |
|
Long Island (KEDLI) |
7.3% |
7.3% |
7.3% |
7.3% |
7.3% |
7.3% |
Downstate New York (KEDNY) |
7.1% |
7.1% |
7.1% |
7.1% |
7.1% |
7.1% |
Upstate New York (NMPC Gas) |
8.4% |
8.4% |
8.4% |
8.4% |
8.4% |
8.4% |
Upstate New York (NMPC Electric) |
8.1% |
8.1% |
8.1% |
8.1% |
8.1% |
8.1% |
Massachusetts Electric |
10.4% |
10.4% |
10.4% |
10.4% |
10.4% |
10.4% |
Massachusetts Gas |
8.4% |
8.4% |
8.4% |
8.4% |
8.4% |
8.4% |
Narragansett Distribution (Electric and Gas) |
10.2% |
10.2% |
10.2% |
10.2% |
10.2% |
10.2% |
New England Power |
11.0% |
11.0% |
11.0% |
11.0% |
11.0% |
11.0% |
Narragansett Electric (Transmission) |
11.2% |
11.2% |
11.2% |
11.2% |
11.2% |
11.2% |
Canadian Interconnector |
13.0% |
13.0% |
13.0% |
13.0% |
13.0% |
13.0% |
Long Island Generation |
12.5% |
12.5% |
12.5% |
12.5% |
12.5% |
12.5% |
Total US RoE |
8.0% |
8.6% |
8.6% |
8.6% |
8.6% |
8.6% |
Source: National Grid, Edison Investment Research
Investing for growth and returns
NG and its regulators work together to devise long-term capex programmes for the businesses, which grow the asset base (the bedrock of NG’s valuation) and, in turn, ensure regulated, visible, growing cash flows that cover Grid’s dividend requirements and go some way to funding future capex projects.
Capex: Driving asset growth and tomorrow’s returns
NG targets 5-7% asset growth. NG’s total capex budget over the next five years will be funded by a mixture of internal cash flows and net debt issuance. We have removed the UKGD capex from our forecasts from FY18e.
|
Exhibit 12: NG group capex forecasts |
|
|
Source: National Grid, Edison Investment Research |
Divestments and returns: A key part of the story
Grid’s ongoing businesses provide shareholders with a healthy yield of 4.3%. The UKGD disposal shows a clear management focus on shareholder value, as does the dividend policy of growing DPS at least in line with UK RPI inflation. The company has announced the proposed schedule for a £4bn shareholder return programme. £3.2bn will be delivered via a special dividend due to be paid on 2 June. The remainder will be returned via a buy back. After the special dividend there will be a share consolidation (11 for 12) after which the dividend policy will be to continue growing payouts at or above RPI. We include all company guidance in our forecasts.
|
Exhibit 13: National Grid EPS and DPS forecast |
|
|
Source: National Grid, Edison Investment Research |
Financials
Due to the nature of National Grid’s regulated earnings, we are making minimal changes to our earnings forecasts to reflect timing issues, inflation differences and currency movements. The main change we have made is to deconsolidate UKGD from FY18, which reduces our EBITDA considerably, although the impact at the EPS level is partly offset as the earnings come through in the associates line. Capex is reduced as UKGD’s capex requirement will no longer be accounted for at group level. Net debt is significantly lower due to the cash inflow from the sale together with the deconsolidation of UKGD’s debt. A full set of financial forecasts can be found in Exhibit 20.
Exhibit 14: Detailed forecast changes
2016 |
2017e |
2018e |
|
New EBITDA (£m) |
5,710 |
6,352 |
4,929 |
Old EBITDA (£m) |
5,710 |
5,826 |
6,082 |
± New vs old |
|
9.0% |
-19.0% |
New EBIT (£m) |
4,096 |
4,664 |
3,482 |
Old EBIT (£m) |
4,096 |
4,163 |
4,361 |
± New vs old |
|
12.0% |
-20.2% |
New EPS (p) |
69.00 |
71.36 |
64.26 |
Old EPS (p) |
69.00 |
65.10 |
67.59 |
± New vs old |
|
9.6% |
-4.9% |
New DPS (p) |
43.16 |
43.81 |
129.28 |
Old DPS (p) |
43.71 |
44.80 |
45.92 |
± New vs old |
|
-2.2% |
181.5% |
New capex (£m) |
(3,408) |
(3,659) |
(3,312) |
Old capex (£m) |
(3,408) |
(4,015) |
(4,178) |
± New vs old |
|
-8.9% |
-20.7% |
New net debt (NG definition) (£m) |
25,325 |
13,860 |
18,226 |
Old net debt (NG definition) (£m) |
25,325 |
26,548 |
27,759 |
± New vs old |
|
-47.8% |
-34.3% |
Source: Edison Investment Research
Earnings: Ahead of an (unreliable) consensus
Given that Grid recently disposed of UKGD, we have little confidence in the consistency of approach in consensus estimates. We have formed our view on earnings based on actual numbers, H117 technical guidance and regular communication with the company. Meanwhile, we forecast that NG’s DPS (underlying and excluding the special dividend) will compound by an average of 2.3% across our five-year forecast horizon.
Exhibit 15: Edison forecasts vs consensus
Year-end 31 March |
2016 |
2017e |
2018e |
Edison revenues (£m) |
15,311 |
17,100 |
15,279 |
Bloomberg revenues (£m) |
|
15,853 |
16,042 |
± Edison vs consensus |
|
7.9% |
-4.8% |
Edison EBITDA (£m) |
5,710 |
6,352 |
4,929 |
Bloomberg EBITDA (£m) |
|
5,897 |
5,387 |
± Edison vs consensus |
|
7.7% |
-8.5% |
Edison EBIT (£m) |
4,096 |
4,664 |
3,482 |
Bloomberg EBIT (£m) |
|
4,262 |
3,887 |
± Edison vs consensus |
|
9.4% |
-10.4% |
Edison EPS (pence per share) |
69.00 |
71.36 |
64.26 |
Bloomberg EPS (pence per share) |
|
63.80 |
64.70 |
± Edison vs consensus |
|
11.8% |
-0.7% |
Edison DPS (pence per share) |
43.16 |
43.81 |
129.28 |
Bloomberg DPS (pence per share) |
|
44.30 |
45.70 |
± Edison vs consensus |
|
-1.1% |
182.9% |
Edison capex (£m) |
(3,408) |
(3,659) |
(3,312) |
Bloomberg capex (£m) |
|
(3,994) |
(3,750) |
± Edison vs consensus |
|
-8.4% |
-11.7% |
Edison net debt (company definition) (£m) |
25,325 |
13,860 |
18,226 |
Bloomberg net debt (£m) |
|
25,702 |
25,306 |
± Edison vs consensus |
|
-46.1% |
-28.0% |
Source: Edison Investment Research, Bloomberg data. Note: Data as at 30 April 2017.
Cash flow
Between FY17e and FY21e, we forecast Grid will produce £23.8bn of after tax operating cash flow, which more than covers the £19.4bn capex requirement over the same period. The £9.6bn we forecast in dividend payments over this period includes the £3.2bn one-off return from the UKGD disposal.
Balance sheet
To those unfamiliar with regulated utilities, our forecast for NG’s headline net debt to EBITDA multiple of 3.7x for FY18e may look stretched. However, regulated returns are designed to cover capital investment, shareholder returns and interest payments and ensure that Grid will generate more than enough cash to cover all of its commitments. P&L interest cover averages 3.96x over our forecast horizon, while funds from operations (FFO) interest cover was 5.5x at FY16. Retained cash flow (RCF) to net debt at FY16 was 11.5% and FFO to net debt was 16.7%. Both these figures are within parameters that regulators and ratings agencies view as sensible. We view NG’s key credit metrics as conservative. Net debt as a portion of total regulatory value for NG was 62% at FY16, in line with regulatory assumptions. In short, NG manages its cash flows and treasury functions proactively and conservatively, with the result that it has more than sufficient headroom to finance £2-3bn of cash flow requirements per year at historically low interest rates.
Valuation methodologies
We take several valuation methodologies into account in arriving at our fair value per share.
1.
Our first valuation methodology for NG is a sum-of-the-parts model, driven by a segment-level RAV premium model.
2.
We average our premium to RAV model with a sector multiple-based model. Our peer comparison data are in Exhibit 17 and we believe EV/EBITDA is the most relevant comparable ratio.
3.
We also take account of NG’s share performance in relation to UK 10-year bond yields to show the inverse correlation.
The blended average of our premium to RAV fair value per ADR of $63.90 and our peer comparison-derived fair value per share of $74.90 is $69.40. This implies upside of 9.1% to the current share price.
Sum-of-the-parts using segment RAV premium
For regulated businesses, the usual valuation methodology is to use the asset base as a starting point and ascribe a premium or discount depending on the economic value of outperformance or underperformance. Using this method for NG, we arrive at a fair value per ADR of $63.90, or 0.4% upside to the current price of $63.62/ADR.
Exhibit 16: National Grid sum-of-the-parts
Sum of the parts |
£m |
pence/share |
US$m |
US$/ADR |
UKET RAV |
12,083 |
322 |
14,983 |
19.98 |
Premium |
4,190 |
112 |
5,196 |
6.93 |
% premium to RAV |
34.7% |
|||
UKGT RAV |
5,712 |
152 |
7,083 |
9.44 |
Premium |
1,659 |
44 |
2,057 |
2.74 |
% premium to RAV |
29.0% |
|||
Total UK Regulated (£m) |
23,645 |
630 |
29,319 |
39.10 |
US Rate base ($m) |
16,890 |
450 |
16,890 |
22.52 |
P/B (x) |
1.45 |
|||
Total US Regulated ($m) |
24,490 |
526 |
24,490 |
32.66 |
Total US Regulated (£m) |
19,750 |
526 |
24,490 |
32.66 |
Other Activities |
510 |
|||
EBITDA Multiple |
11.0 |
|||
Total other Activities (£m) |
5,608 |
149 |
6,954 |
9.27 |
Equity stake in UKGD (18x P/E) |
3,500 |
93 |
4,340 |
5.79 |
Total Enterprise value £m (UK + US + Other) |
52,503 |
1,399 |
60,763 |
86.8 |
Less net debt |
13,860 |
369 |
17,186 |
22.92 |
Equity value (£m) |
38,643 |
1,030 |
43,577 |
63.9 |
Market price |
987.0 |
63.62 |
||
Upside/(downside) |
4.3% |
0.4% |
||
£/US$ |
1.24 |
|||
Number of shares (m) |
3,752.0 |
|||
Number of ADRs (m) |
749.9 |
Source: Edison Investment Research
Note: we arrive at a fair premium or discount to RAV based on a net present value calculation of the economic outperformance of each unit versus its required return. We use 18x P/E for the UKGD equity stake as it is in line with other listed UK regulated utilities (see Exhibit 17).
Peer multiples
NG trades at attractive levels in comparison to its closest listed UK and international peers. Grid trades on a 4.3% one-year forward dividend yield (ahead of its closest UK peers on 3.9%). Also, on one-year forward EV/EBITDA, Grid trades at a 9.3% discount to a global average of 11.1x. To reinforce the point that regulated utilities can sustain high levels of debt and that NG is actually conservatively geared, its one-year forward net debt to EBITDA of 3.7x is actually well below the global average of 4.5x.
Exhibit 17: National Grid vs peers
Company |
Share Price (local) |
Market cap (local m) |
Dividend yield |
Current P/E |
Next P/E |
Current EV/ EBITDA |
Next EV/ EBITDA |
FCF Yield |
Net debt to +1y EBITDA |
Snam SpA |
4.08 |
14,290 |
5.1% |
15.5x |
15.1x |
12.6x |
12.4x |
7.5% |
5.5x |
Terna Rete Elettrica Nazionale SpA |
4.68 |
9,415 |
4.4% |
14.1x |
13.9x |
11.1x |
10.9x |
-6.3% |
5.2x |
Enagas SA |
24.25 |
5,789 |
5.6% |
13.0x |
13.5x |
10.3x |
10.5x |
8.1% |
4.4x |
Red Electrica Corp SA |
18.05 |
9,766 |
4.4% |
14.5x |
13.9x |
10.2x |
9.9x |
8.3% |
3.8x |
Average Regulated Europe |
|
|
5.0% |
14.2x |
14.2x |
11.4x |
11.3x |
3.1% |
5.0x |
Pennon Group PLC |
867 |
3,608 |
4.1% |
20.1x |
19.5x |
12.7x |
12.2x |
-1.4% |
1.6x |
United Utilities Group PLC |
867 |
6,710 |
4.0% |
21.6x |
21.5x |
13.7x |
13.2x |
0.7% |
6.9x |
Severn Trent PLC |
984 |
5,445 |
3.5% |
21.8x |
21.1x |
12.2x |
11.8x |
1.4% |
4.9x |
Average UK |
|
|
4.5% |
17.7x |
17.4x |
12.1x |
11.8x |
1.7% |
4.8x |
Consolidated Edison Inc |
80 |
24,336 |
3.4% |
19.6x |
18.7x |
10.2x |
9.6x |
-1.6% |
2.5x |
PPL Corp |
38 |
25,972 |
4.0% |
17.7x |
16.4x |
11.6x |
10.6x |
-4.2% |
4.9x |
Average US |
|
|
3.7% |
18.6x |
17.6x |
10.9x |
10.1x |
-2.9% |
3.7x |
Average Global |
|
|
4.7% |
16.8x |
16.4x |
11.5x |
11.1x |
0.6% |
4.5x |
National Grid PLC |
1,007 |
37,761 |
4.3% |
15.5x |
15.6x |
8.0x |
10.3x |
0.0% |
3.7x |
Source: Bloomberg data, 27.04.17
If we apply a 12.0x one-year forward EV/EBITDA in line with the top of the range for NG’s global peers, our fair value per ADR increases to $74.90, offering 17.7% upside.
Exhibit 18: NG fair value per ADR at market average EV/EBITDA
£m |
Current EV/EBITDA |
FV/ADR at 12.0x ($) |
Upside/(downside) % |
|
FY18e EBITDA |
4,929 |
10.33 |
74.9 |
17.7% |
Source: Edison Investment Research
Bond proxy: Rising inflation and long-term yields a risk
|
Exhibit 19: NG share price vs inverted UK 10-year bond yields |
|
|
Source: Bloomberg data, 20 April 2017 |
We note that a serious risk to NG’s share price is rising yields on long-dated UK bonds. As NG is a bond proxy, most investors require a premium to risk-free assets, so rising yields in gilts have historically been associated with a falling NG share price. The underperformance in the stock since summer 2016 demonstrates this.
Exhibit 20: Financial summary
$m |
2015 |
2016 |
2017e |
2018e |
2019e |
2020e |
2021e |
||
Year end 31 March |
IFRS |
IFRS |
IFRS |
IFRS |
IFRS |
IFRS |
IFRS |
||
PROFIT & LOSS |
|||||||||
Revenue |
|
|
19,777 |
18,986 |
21,204 |
18,946 |
19,853 |
20,418 |
20,972 |
EBITDA |
|
|
6,628 |
7,080 |
7,876 |
6,112 |
6,574 |
6,775 |
6,957 |
Operating Profit (before amort. and except.) |
4,790 |
5,079 |
5,784 |
4,317 |
4,671 |
4,768 |
4,855 |
||
Intangible Amortisation |
0 |
0 |
0 |
0 |
0 |
0 |
0 |
||
Exceptionals |
(103) |
(14) |
0 |
0 |
0 |
0 |
0 |
||
Operating Profit |
4,687 |
5,065 |
5,784 |
4,317 |
4,671 |
4,768 |
4,855 |
||
Associated company |
57 |
73 |
75 |
319 |
335 |
338 |
344 |
||
Exceptionals |
(308) |
(136) |
0 |
0 |
0 |
0 |
0 |
||
Net Interest |
(1,281) |
(1,256) |
(1,428) |
(1,048) |
(1,165) |
(1,291) |
(1,381) |
||
Pre-Tax Profit (norm) |
|
|
3,566 |
3,896 |
4,432 |
3,588 |
3,841 |
3,815 |
3,818 |
Pre-Tax Profit (IFRS) |
|
|
3,156 |
3,746 |
4,432 |
3,588 |
3,841 |
3,815 |
3,818 |
Tax |
(862) |
(934) |
(1,108) |
(861) |
(922) |
(916) |
(916) |
||
Profit After Tax (norm) |
2,704 |
2,962 |
3,324 |
2,727 |
2,919 |
2,899 |
2,902 |
||
Profit After Tax (IFRS) |
2,294 |
2,812 |
3,324 |
2,727 |
2,919 |
2,899 |
2,902 |
||
0.0 |
0.0 |
0.0 |
0.0 |
0.0 |
0.0 |
0.0 |
|||
Average Number of ADR Outstanding (m) |
749.9 |
749.9 |
749.9 |
699.4 |
687.4 |
687.4 |
687.4 |
||
EPADR - normalised ($) |
|
|
3.61 |
3.95 |
4.43 |
3.90 |
4.25 |
4.22 |
4.22 |
EPADR - (IFRS) ($) |
|
|
3.06 |
3.75 |
4.43 |
3.90 |
4.25 |
4.22 |
4.22 |
DPADR ($) |
2.65 |
2.68 |
2.72 |
7.83 |
2.77 |
2.84 |
2.91 |
||
EBITDA Margin (%) |
33.5 |
37.3 |
37.1 |
32.3 |
33.1 |
33.2 |
33.2 |
||
Operating Margin (before GW and except.) (%) |
24.2 |
26.8 |
27.3 |
22.8 |
23.5 |
23.4 |
23.2 |
||
BALANCE SHEET |
|||||||||
Fixed Assets |
|
|
60,832 |
65,251 |
52,320 |
54,632 |
58,147 |
61,340 |
63,989 |
Intangible Assets |
7,374 |
7,690 |
7,690 |
7,690 |
7,690 |
7,690 |
7,690 |
||
Tangible Assets |
53,063 |
57,069 |
44,137 |
46,450 |
49,964 |
53,157 |
55,806 |
||
Investments |
394 |
492 |
492 |
492 |
492 |
492 |
492 |
||
Current Assets |
|
|
7,478 |
7,827 |
14,852 |
11,297 |
12,517 |
12,751 |
13,482 |
Stocks |
422 |
542 |
542 |
542 |
542 |
542 |
542 |
||
Debtors |
3,517 |
3,065 |
3,065 |
3,065 |
3,065 |
3,065 |
3,065 |
||
Cash |
148 |
157 |
7,183 |
2,388 |
3,608 |
3,842 |
4,573 |
||
Other |
3,393 |
4,062 |
4,062 |
5,302 |
5,302 |
5,302 |
5,302 |
||
Current Liabilities |
|
|
(8,065) |
(8,864) |
(8,864) |
(8,864) |
(8,864) |
(8,864) |
(8,864) |
Creditors |
(4,310) |
(4,386) |
(4,386) |
(4,386) |
(4,386) |
(4,386) |
(4,386) |
||
Short term borrowings |
(3,755) |
(4,478) |
(4,478) |
(4,478) |
(4,478) |
(4,478) |
(4,478) |
||
Long Term Liabilities |
|
|
(44,319) |
(46,684) |
(39,492) |
(41,352) |
(45,072) |
(47,552) |
(50,032) |
Long term borrowings |
(28,374) |
(30,669) |
(23,477) |
(25,337) |
(29,057) |
(31,537) |
(34,017) |
||
Other long term liabilities |
(15,945) |
(16,015) |
(16,015) |
(16,015) |
(16,015) |
(16,015) |
(16,015) |
||
Net Assets |
|
|
15,927 |
17,531 |
18,817 |
15,715 |
16,729 |
17,676 |
18,576 |
CASH FLOW |
|||||||||
Operating Cash Flow |
|
|
6,634 |
7,018 |
7,876 |
6,112 |
6,574 |
6,775 |
6,957 |
Net Interest |
(1,281) |
(1,256) |
(1,428) |
(1,048) |
(1,165) |
(1,291) |
(1,381) |
||
Tax |
(425) |
(362) |
(1,108) |
(861) |
(922) |
(916) |
(916) |
||
Capex |
(3,814) |
(4,226) |
(4,537) |
(4,107) |
(5,417) |
(5,200) |
(4,751) |
||
Acquisitions/disposals |
(246) |
(412) |
6,696 |
0 |
0 |
0 |
0 |
||
Financing |
(399) |
(319) |
(292) |
(1,264) |
(8) |
(13) |
(16) |
||
Dividends |
(1,576) |
(1,658) |
(1,671) |
(5,486) |
(1,562) |
(1,601) |
(1,641) |
||
Net Cash Flow |
(1,107) |
(1,214) |
5,537 |
(6,654) |
(2,500) |
(2,246) |
(1,749) |
||
Opening net debt/(cash) |
|
|
31,739 |
31,981 |
34,989 |
20,772 |
27,427 |
29,927 |
32,173 |
HP finance leases initiated |
0 |
0 |
0 |
0 |
0 |
0 |
0 |
||
Other |
866 |
(1,794) |
8,680 |
(0) |
0 |
(0) |
(0) |
||
Closing net debt/(cash) |
|
|
31,981 |
34,989 |
20,772 |
27,427 |
29,927 |
32,173 |
33,922 |
Source: National Grid accounts, Edison Investment Research
|
|||||||||||||||||||||||||||||||||||||||
|
|
2017 is likely to be a critical year for Green Dragon Gas (GDG) as management works to deliver on several milestones that will enable a step-up in activity levels. We were encouraged by the CNPC approval and submission of the GCZ CBM Block overall development plan (ODP) in April. Execution of supplementary agreements and GSS ODP submission would provide an incremental reserve base for GDG to leverage in order to refinance outstanding bonds and fund further drilling activity. With regard to funding GDG states that it has multiple term sheets for mezzanine and RBL funding on hand. Our base case valuation of 227p/share rises to 237p/share assuming GSS ODP approval this year and GCZ developed in-line with ODP, this is offset by a delay in GSS development relative to previous forecasts.