Last close As at 05/08/2026
—
— 0.00 (0.00%)
Market capitalisation
—
Research: Financials
Banca Sistema’s (BST) main activity is financing trade receivables from the Italian public sector. It also purchases commercial receivables and has a growing salary and pension backed loan business. It aspires to be the leading independent speciality finance provider in Italy. A modest valuation, capital headroom, potential for increased penetration of public sector factoring in Italy, market share gains for BST and the development of diversifying businesses combine to make an appealing investment proposition.
Written by
Banca Sistema |
Growing speciality finance provider |
Initiation of coverage |
Banks |
8 May 2017 |
Share price performance
Business description
Next events
Analysts
Banca Sistema is a research client of Edison Investment Research Limited |
|||||||||||||||||||||||||||||||||||||||||||||||
Banca Sistema’s (BST) main activity is financing trade receivables from the Italian public sector. It also purchases commercial receivables and has a growing salary and pension backed loan business. It aspires to be the leading independent speciality finance provider in Italy. A modest valuation, capital headroom, potential for increased penetration of public sector factoring in Italy, market share gains for BST and the development of diversifying businesses combine to make an appealing investment proposition.
Year |
Net operating income (€m) |
PBT* |
EPS* |
DPS |
P/E |
Yield |
Price to book (x) |
12/16 |
81.5 |
35.7 |
32.8 |
7.6 |
7.1 |
3.3 |
1.6 |
12/17e |
87.2 |
41.0 |
35.3 |
9.0 |
6.6 |
3.9 |
1.4 |
12/18e |
97.2 |
47.6 |
40.9 |
9.5 |
5.7 |
4.1 |
1.2 |
12/19e |
104.2 |
52.1 |
44.7 |
11.0 |
5.2 |
4.7 |
1.0 |
Note: *PBT and EPS are normalised, excluding exceptional items.
Factoring offers high returns and low credit risk
Payment times in Italy are the longest in Europe creating a fertile market for factoring receivables. Overall factoring penetration is above the European average but still below the level seen in the UK, for example, so the potential for growth appears good. Within this market Banca Sistema’s main focus is on public sector receivables where the time to pay averages 130 days but the credit risk is comparable with government bonds. Having established a network of relationships with suppliers and their public sector customers, BST has accumulated a database of payment profiles that creates a strong base for further growth. With its first quarter results (see page 9) BST set a target return on average equity for FY17 of over 20% (we estimate 22.5%).
Appetite for new opportunities
Banca Sistema has taken the opportunity to invest in new businesses that provide attractive returns and a measure of diversification. One of these is salary and pension-backed loans where risks are moderated by the public sector bias of the client base. Further growth is planned for this business and agreement has been reached to add two new originators to the existing five partners. The newest venture is an initial investment in pawnbroking, an interesting niche business that does not absorb regulatory capital and may make a useful contribution on a medium-term view.
Valuation: Rating belies the record and potential
Compared with selected peers (page 13) Banca Sistema trades on the lowest P/E and a below average price to book ratio. Applying an ROE/COE model suggests, on our assumptions, that the market is building in a cost of equity of over 15%, which appears cautious. Assuming an ROE of 22% and 12.4% cost of equity we come to a valuation of c €3.15, more than 30% above the current share price.
Independent speciality finance company
Banca Sistema was launched in 2011 following the integration of Banca Sintesi and SF Trust. The STAR segment of Borsa Italiana in July 2015 raising c €36.5m in new money as part of the initial public offering.
The bank’s main activity is providing financing (factoring) of trade receivables for companies supplying a range of Italian public sector entities including central and local bodies and state-owned companies (collectively labelled Public Administrations or PAs). These counterparties represent a low credit risk, comparable to the sovereign credit risk on an Italian government bond. In 2016 Banca Sistema strengthened its PA healthcare factoring business by acquiring Beta Stepstone from Fortress. The bank also undertakes factoring of receivables relating to VAT and other tax receivables and from private sector companies in Italy.
Opportunities for attractive diversifying investment are sought and this has led to the expansion of salary and pension backed loans and lending to small and medium-sized enterprises (SMEs) which benefit from a state guarantee. While attractive under the existing regime, the SME business is to be run off following the announcement of a reduction in the level of state guarantees. The group has recently made an initial step into pawnbroking with the opening of one branch and plans to open two or three more in 2017. This is not expected to have a significant impact on the profit and loss account before 2019.
Other activities include debt collection of third-party receivables and a strategic partnership with Axactor through a minority interest in CS Union that gives exposure to non-performing loan (NPL) acquisitions and servicing.
As a bank BST is able to diversify its sources of funding which are split broadly equally between retail term and current accounts and wholesale funding, including the securitisation of salary and pension-backed loans and the use of ECB funding (TLTRO II) to help optimise interest costs.
As shown in Exhibits 1 and 2, factoring accounts for a substantial majority of both the bank’s customer loans outstanding and net interest income.
|
Exhibit 1: Analysis of customer loans outstanding |
Exhibit 2: Net interest income analysis |
|
|
|
Source: Banca Sistema (Q117) |
|
Exhibit 1: Analysis of customer loans outstanding |
|
|
Source: Banca Sistema (Q117) |
|
Exhibit 2: Net interest income analysis |
|
|
Source: Banca Sistema (Q117) |
In Exhibits 3 and 4 we show the progression of customer loans outstanding, net income from banking activities and profit after tax. Growth over the period has been strong with the reduction in customer loans for 2016 reflecting the temporary impact of a cancelled Q4 factoring receivables purchase, which can be seen as an example of natural ‘lumpiness’ in flows, particularly around half- and full-year period ends.
|
Exhibit 3: Customer loan growth |
Exhibit 4: Net banking income and profit progression |
|
|
|
Source: Banca Sistema |
|
Exhibit 3: Customer loan growth |
|
|
Source: Banca Sistema |
|
Exhibit 4: Net banking income and profit progression |
|
|
Source: Banca Sistema |
Factoring business
In a traditional factoring transaction Banca Sistema will buy invoices from a supplier at a discount to face value and then seek to secure payment from the entity that owes the money, the obligor, in a timely fashion. Most of the receivables BST buys are purchased on a non-recourse basis from large corporates, although there have been more transactions with SMEs recently, a trend that has been accelerated by the acquisition of Beta Stepstone. Pricing of invoice purchases is set with reference to BST’s proprietary database, which has a 10-year history of transactions including the information inherited from SF Trust and Beta Stepstone. Each additional transaction increases the breadth and history within the database, a key business resource.
When considering near-term trends in factoring turnover, it should be remembered that it tends to display seasonality as companies seek to improve their balance sheet positions at quarter-end dates by selling invoices. This is particularly marked at the end of December when there is a concentration of large transactions. This can give rise to a degree of lumpiness in turnover levels, as noted above, and in these circumstances it can also be useful to monitor the longer-term record to give an alternative perspective.
Collection of the amount owed and late payment interest where appropriate generates a return to the bank and, from an accounting perspective, revenues are accrued through amortisation of the discount to face value and collection/recognition of late payment interest. This revenue is labelled as interest and/or fee income according to the terms of the transaction. All else equal, the sooner the payment can be collected the higher the rate of return on investment will be. (See appendix on page 16 for an illustration of how pricing is determined.)
For PA receivables late payment interest (LPI) starts to accumulate from the invoice due date at the rate of 8% plus the ECB reference rate. However, unlike some competitors, BST’s approach to collections does not rely heavily on collecting LPI; instead it takes a non-confrontational, non-litigation approach to securing payment of the invoice face value. This helps maintain supplier relationships with customers and BST’s own relationship with obligors, facilitating agreement on a satisfactory collection period with LPI acting as a negotiation tool in this process. BST notes that its approach enables it to agree discounted pricing with other players paying closer to par but relying more heavily on late payment interest. Where appropriate BST does employ legal collection and during FY16 this applied to approximately 10% of turnover and, because of the accumulation of cases from previous years, 20% of total loans outstanding. LPI may be collected as a result of a judicial decision or through an out of court settlement; in either case, it will help BST to achieve its target return even where the expected collection date has passed. Accounting for LPI at BST changed during FY16 from a cash basis to accrual of part of the amount due when legal proceedings have begun (for detail, see discussion of Q117 results page 9). This is now more in line with peers and does not affect the incidence of cash flows, a key focus of the business.
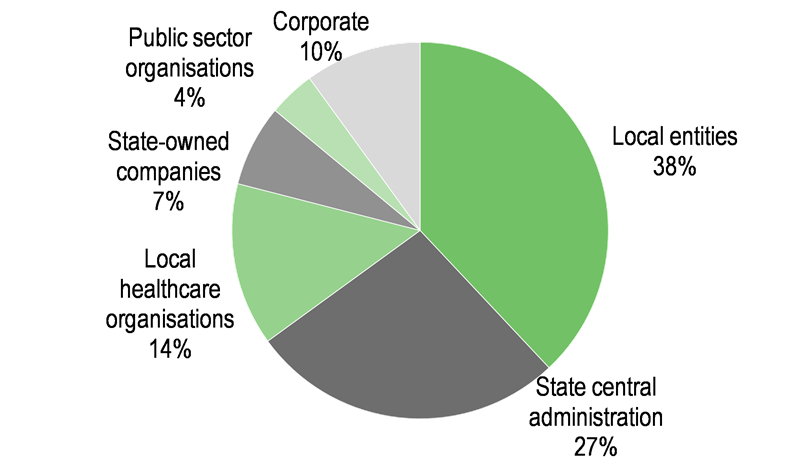
The next two charts show the analysis of the end year factoring outstanding by type and obligor. Most factoring is on a non-recourse basis (including VAT receivables), with small proportion of recourse factoring where the client pays interest on the amount advanced during the collection period. The obligor analysis in Exhibit 6 shows the preponderance of public sector exposure: 90% of total factoring outstanding. Banca Sistema’s client base includes leading multinational and domestic companies with main sectors including utilities, telecommunications, healthcare and transportation. Looking at customer concentration, the top five customers accounted for c 30% of turnover in Q117 (c 40% in Q116).
|
Exhibit 5: Factoring outstanding by type (Q117) |
Exhibit 6: Factoring outstanding by obligor (Q117) |
|
|
|
Source: Banca Sistema |
|
Exhibit 5: Factoring outstanding by type (Q117) |
|
|
Source: Banca Sistema |
|
Exhibit 6: Factoring outstanding by obligor (Q117) |
|
|
Source: Banca Sistema |
Salary and pension guaranteed loans (CQS)
The salary and pension-backed loans (CQS/CQP) part of Banca Sistema’s business acquires portfolios of loans to public and private-sector employees or those entitled to retirement benefits. The loans are made on a fixed rate basis and are repaid by a direct deduction of up to 20% of net salaries or pensions. The repayments must be supported by insurance coverage for loss of employment, disability or death. The duration of loans is between two years and ten years with an average contractual duration of 9.6 years currently. These loans are primarily made to those who do not have access to bank credit. Loans are sourced from originators who in turn may employ agents to source loans. The loan book has expanded strongly from its inception in 2014 (€13m at the year-end) to Q117 with a period-end outstanding of €313m. Banca Sistema is employing securitisation as a source of financing for this business and has announced its intention to sell securities arising from its first securitisation in Q217.
SME state guaranteed loans
Also launched in 2014 was Banca Sistema’s offering of state guaranteed SME loans. This scheme offers loans on preferential terms to SME borrowers with backing from a state guarantee fund for 80% of the loan. At the end of 2016 Banca Sistema’s loan book in this area stood at approaching €80m but the government has announced a change in the terms of the scheme that will reduce the backing to 40% of loans. Given this change and increased commercial bank competition, the bank decided to stop making these loans and is allowing the book to run off (or would sell should an appropriate offer arise).
Strategy: Grow factoring and CQS and consider other openings
Banca Sistema specifies its vision as becoming the leading independent speciality finance player in Italy and the preeminent public sector factoring provider. In the immediate term this involves a focus on developing its core factoring business where its established relationships with clients, obligors and 14 partner banks together with its proprietary database of payment profiles provide a strong base for further penetration of the market. In addition, the bank’s diversified funding platform combined with capital headroom (see Financials section, page 12) facilitates development of further speciality finance activities where attractive opportunities arise. The existing salary and pension backed loan activity (CQS) is set to be developed further, absorbing capital released as the SME loans activity runs off.
Consistent with this opportunistic approach to diversification Banca Sistema is also making a cautious entry to the pawnbroking market in Italy with one branch (in Milan) open so far and it plans to open a further two or three during 2017. In contrast with unsecured personal loans the focus is not on the credit status of the borrower but on the value of the pledge and initially loans will only be made against gold pledges (these are permitted to be up to 80% of the pledge). The operation is being supported with the hiring of experienced valuers. Positively, the activity will not absorb regulatory capital. The business is not expected to make a significant contribution in 2017 or 2018 but has the potential to become a valuable diversifying investment with anticyclical characteristics on a medium-term view.
Management: Breadth of relevant experience
Led by Gianluca Garbi since the formation of Banca Sistema, the management team has a breadth of experience in financial services, banking, factoring, operations and legal matters gained across a number of prominent companies. Brief details are given in Exhibit 7 with more information on BST’s website
Exhibit 7: Management experience
Executive |
Role |
Assumed role |
Experience |
|
Gianluca Garbi |
CEO |
2011 |
Executive positions in Dresdner Finanziaria and Commerzbank, nine years as CEO of the MTS fixed income market and a period as a member of the council of economic advisers in Italy. |
|
Margherita Mapelli |
CFO |
2012 |
Financial roles at Barclays bank, projects at Borsa Italiana and London Stock Exchange and financial and operations director at MTS. |
|
Massimiliano Ciferri |
COO |
2013 |
More than 20 years’ experience in operations, IT and general management in companies including Pfizer, GE Capital, Accenture and Pirelli. |
|
Marco Pompeo |
Head of legal and corporate affairs |
2011 |
Over 12 years as lawyer at Allen & Overy working on transactions with a focus on PA receivables purchases. |
|
Cesare Santacroce |
CRO |
2011 |
Various roles at Banca Profilo including the period when it moved from being an investment company to a bank and IPO'd. |
|
Egisto Franceschi |
Head of collection services |
2011 |
Was COO at Banca Sistema and CEO at SF Trust and prior to this held senior positions at GE Money over a period of 13 years. |
|
Steve Skerrett |
Head of retail and commercial Banking |
2011 |
With more than 25 years in banking, roles have included positions as MD at Bank of America and UBS (European structured finance). |
|
Source: Banca Sistema
In addition to the CEO the nine-member board of directors includes: Luitgard Spögler (chairperson), Giovanni Puglisi, Claudio Pugelli, Giorgio Barba Navaretti, Ilaria Bennati, Daniele Pittatore, Carlotta De Francheschi and Diego De Francesco (co-opted to the board Q117). They bring a range of legal, banking supervision, investment banking, accounting, marketing, and academic experience to their roles. Five of the directors are deemed independent.
Market background and outlook
In this section we provide background on the Italian receivables factoring, salary and pension loan markets and, briefly, the pawnbroking market given the recent initial step Banca Sistema has made into this market. We also consider the outlook in these markets.
Receivables factoring in Italy
Exhibit 8 puts the overall Italian factoring market in a European context, comparing it with some of other the larger markets. Italy ranks fourth in size; its 11.6% penetration (relative to GDP) is above the 10% European average but noticeably below the near-15% level seen in the UK. Banca Sistema cites Italian treasury (MEF) data indicating public sector factoring penetration at 7% of government spending. Exhibit 9 highlights the relatively long public sector payment times that characterise the Italian market supporting the suggestion that there should be good scope to increase penetration from the current level. Payment times in business-to-business transactions are shorter but at 80 days are also the longest in Europe.
|
Exhibit 8: EU factoring penetration & market size 2015 |
Exhibit 9: Average public sector payment times 2015 |
|
|
|
Source: EU Federation for Factoring and Comml. Finance Industry |
Source: Intrum Justitia, European payment report 2016 |
|
Exhibit 8: EU factoring penetration & market size 2015 |
|
|
Source: EU Federation for Factoring and Comml. Finance Industry |
|
Exhibit 9: Average public sector payment times 2015 |
|
|
Source: Intrum Justitia, European payment report 2016 |
A study by CRIBIS published in November 2016 underlined the extended payment times that prevail in the Italian public sector. This showed that only 22.3% of public administration entities paid on time, compared with 35.9% for private sector companies. While the number of good payers has increased from 11.5%, since 2010 the number of those paying later than 30 days after the due date also increased (from 20% to 25.3%).
The Italian health system is particularly prone to late payment and CRIBIS indicates that 61% of health system entities pay more than 30 days late. The latest industry figures from Assobiomedica show an average of 150 days. As Exhibit 10 shows, there has been a marked downtrend in recent years, perhaps reflecting a number of measures to help contain late payment and the cost of late payment interest. However, the average time to payment remains long, the figures may be influenced by the exclusion of factored invoices and the average also hides the still very wide regional variation.
|
Exhibit 10: Italian health system average payment times |
Exhibit 11: Italian health system DSO by region |
|
|
|
Source: Assobiomedica Note: 2017 average to February |
Source: Assobiomedica. Note: DSO = days sales outstanding |
|
Exhibit 10: Italian health system average payment times |
|
|
Source: Assobiomedica Note: 2017 average to February |
|
Exhibit 11: Italian health system DSO by region |
|
|
Source: Assobiomedica. Note: DSO = days sales outstanding |
As we show in Exhibit 11 payment times range between 76 days and 506, suggesting there are still substantial opportunities for factoring companies to assist clients in managing receivables and cash flows. Weighting these regional figures for payment times by BST’s outstanding receivables gives a figure of 189 days: 32% above the national average. This can be compared with the range of funding periods (241 to 461 days) BST assumed when pricing receivables portfolios during FY16, suggesting prudent criteria are applied, even allowing for some adverse selection on the part of sellers.
The level of factoring outstanding in the Italian market (private and public sector) grew at a compound annual rate of 6% in the 10 years to 2016. Growth fluctuated significantly during the period, accelerating following the financial crisis as the availability of credit from mainstream lenders was constrained, but then reversing following the euro-area crisis in 2011-12. Modest growth has resumed subsequently. For the first three months of 2017 the level of factoring outstanding has been above the prior year period (+2.7% at end March), while cumulative turnover was 19% ahead for the first quarter.
|
Exhibit 12: Growth in factoring outstanding in the Italian market |
|
|
Source: Assifact |
Exhibit 13 shows the leading providers of factoring in Italy. The market appears quite concentrated with the top five companies accounting for a share of over 70%. However, calculating the Herfindahl-Hirschman index gives a figure of 1,266, which would not generally be seen as markedly concentrated.
Exhibit 13: Leading providers of factoring in Italy (as at end December 2016)
Outstanding (€m) |
Market share (%) |
Cumulative mkt share (%) |
Parent |
Specialisation |
||
Mediocredito Italiano |
13,898 |
22.8 |
22.8 |
Banca Intesa |
||
UniCredit Factoring |
11,681 |
19.1 |
41.9 |
UniCredit |
||
IFITALIA |
8,853 |
14.5 |
56.4 |
Intesa Sanpaolo |
||
Banca IFIS |
5,911 |
9.7 |
66.1 |
Independent |
Emphasis on SME/retail DRL |
|
UBI Factor |
3,052 |
5.0 |
71.1 |
UBI Banca |
||
Factorit |
2,771 |
4.5 |
75.7 |
BNP Paribas |
||
SACE FCT |
2,059 |
3.4 |
79.0 |
CDP (SACE) |
||
Banca Farmafactoring |
1,794 |
2.9 |
82.0 |
Independent |
Emphasis on health service recbls |
|
MPS L&F |
1,749 |
2.9 |
84.9 |
Banca MPS |
||
Creditech |
1,134 |
1.9 |
86.7 |
Mediobanca |
||
Banca Sistema |
1,005 |
1.6 |
88.4 |
Independent |
Emphasis on public administration |
|
Emil-Ro Factor |
976 |
1.6 |
90.0 |
BPER Banca |
||
Credemfactor |
641 |
1.1 |
91.0 |
Credem |
||
BCC Factoring |
620 |
1.0 |
92.0 |
Iccrea Banca (Credito Cooperativo) |
||
Fidis |
598 |
1.0 |
93.0 |
FCA (Fiat Chrysler) |
Captive finance provider |
Source: Assifact, Edison Investment Research. Note: Following acquisitions IFIS includes GE Capital and Sistema, Beta Stepstone.
Banca Sistema ranks eleventh in this table and is one of three independents shown. The top three players are parts of large banks and in some instances the emphasis may be more on providing receivables management and credit guarantees to existing customers rather than financing. Of the independents, Banca IFIS is the largest player followed by Banca Farmafactoring (recently completed its IPO) which is more comparable with Banca Sistema given its focus on health system receivables.
Salary and pension-backed loans, a low risk market
As noted earlier these are loans backed by salaries or pensions with additional security provided by compulsory insurance. Levels of growth had been strong prior to the financial crisis, but then stalled before resuming more modest growth (Exhibit 14). The flow of new loans continued to grow last year (+17%), but the level of loans outstanding was marginally lower as the rate of churn increased from 26% to 31%. The analysis of loans made in 2012-15 shows that state employees and pensions have accounted for a large proportion of the total, again tending to lower the credit risk exposure. Nevertheless, the risk weighting applied to these loans is 75% so expansion in this area is relatively capital intensive. Industry representations to reduce this weighting might improve the level of capital absorbed in Banca Sistema’s planned expansion here in due course. In the meantime, securitisation and sale are likely to moderate the capital requirement.
|
Exhibit 14: Italian salary-backed loans evolution |
Exhibit 15: Italian salary-backed loans flow analysis |
|
|
|
Source: IBL Banca Group, Assofin |
|
Exhibit 14: Italian salary-backed loans evolution |
|
|
Source: IBL Banca Group, Assofin |
|
Exhibit 15: Italian salary-backed loans flow analysis |
|
|
Source: IBL Banca Group, Assofin |
Pawnbroking market
The pawnbroking market is a niche area with Banca Sistema citing Bank of Italy figures showing turnover of €800m per annum. The main players in this market are commercial banks and independent broker networks. The ticket size is typically small with 30,000 loans issued per month. Banca Sistema intends to focus purely on gold backed loans initially and these account for 60% of turnover with jewellery and diamonds the next largest category at 20% followed by 12% for watches. Between 92% and 95% of pledges are redeemed with the remainder sold at auction. Loans are generally short duration with Banca Sistema offering three-, six- and 12-month terms; the maximum period for which a loan can be renewed is three years and the ministry of finance (MEF) sets maximum interest rates as required by Italian usury law.
Outlook
The macroeconomic and political background in Italy remains uncertain with periodic concerns over eurozone health (generally positive for factoring volumes as international companies seek to reduce exposure), resolution of the Italian banking system legacy of bad debts and Brexit implications among the possible threats to the economy. Nevertheless, forecasts such as those from the OECD and the European Commission point to continued recovery from recession with GDP growth of around 1% expected for this year and next while unemployment is expected to fall slightly (but remain above 11%).
For the markets that Banca Sistema operates in this background would broadly represent a continuation of current conditions. Government consumption is only expected to increase marginally but the main opportunity for the bank in public sector receivables factoring is greater penetration (as mentioned earlier this is estimated to be only 7%) and an increase in market share (currently less than 2% of the overall factoring market). For Banca Sistema the resumption of stronger factoring turnover growth in the first quarter is encouraging and, while there are likely to be fluctuations in the level of turnover by quarter, we look for good growth in factoring receivables outstanding against a background of moderate market growth. Periods of increased concern over the economy or political situation while worrying in a general sense could present increased opportunities for Banca Sistema to purchase receivables portfolios from international companies wishing to lower their exposure.
For the salary and pension-backed loan business modest overall growth in the market seems a reasonable assumption, but for Banca Sistema greater focus on and capital commitment to this area is likely to be the key driver of growth.
In pawnbroking the prospects for Banca Sistema’s operation will largely depend on the successful establishment of the initial branches, including the recruitment of key staff. The level of gold price (on a broadly upward trend since late 2013) can have a positive or negative influence on the volume of business, level of loans that can be granted and any auction income.
Q117 results highlights
Banca Sistema’s Q117 results showed lower net interest income, operating income and profit after tax than Q116 primarily reflecting an expected second-half bias in the incidence of late payment interest during the year, a lower interest margin and a lower level of average factoring receivables during the quarter following comparatively weak turnover in Q416 versus Q415. Other factors creating a drag in the period were a lower contribution from the Italian government bond portfolio in trading revenues and a one-off expense within personnel costs.
Positively, following a disappointing Q416 for factoring turnover (down 23% on Q415, held back by the cancellation of a significant portfolio purchase), turnover in the first quarter increased by 21%. The quarterly evolution of factoring turnover and the level of receivables outstanding is shown in Exhibit 16 with the figures for FY15 illustrating a more normal pattern of seasonality with a heavy weighting of turnover in the final quarter.
|
Exhibit 16: Factoring receivables outstanding and turnover by quarter |
|
|
Source: Banca Sistema |
The CQS/CQP business increased outstanding loans to more than €300m, is planning the sale of its first securitisation in the second quarter and has announced a second securitisation. Supporting growth, two further loan origination partners are to be added in May, taking the total to seven.
Reflecting the company’s expectation of a stronger performance in the remaining three quarters it is aiming for a return on average equity of over 20% for the full year compared with the 15% recorded in the first quarter.
Exhibit 17: Q117 results summary
€000s |
Q116 |
Q117 |
% change |
Interest income |
20,168 |
16,355 |
-18.9 |
Interest expense |
(4,076) |
(3,932) |
-3.5 |
Net interest income |
16,092 |
12,423 |
-22.8 |
Net fee and commission income |
2,342 |
2,249 |
-4.0 |
Net income from asset sales/purchases and trading |
642 |
231 |
-64.0 |
Operating income |
19,076 |
14,903 |
-21.9 |
Net impairment losses on loans |
(1,471) |
488 |
N/A |
Net operating income |
17,605 |
15,391 |
-12.6 |
Staff costs |
(3,625) |
(4,274) |
17.9 |
Other administrative expenses |
(5,213) |
(5,052) |
-3.1 |
Other operating income/costs |
(33) |
116 |
N/A |
Operating expenses |
(8,871) |
(9,210) |
3.8 |
Profit/(loss) from equity investments |
(6) |
0 |
-100.0 |
Pre-tax profit |
8,728 |
6,181 |
-29.2 |
Tax |
(2,767) |
(1,783) |
-35.6 |
Profit after tax |
5,961 |
4,398 |
-26.2 |
Net interest margin |
4.62% |
3.60% |
|
Loan loss provision as % of average loans* |
0.42% |
-0.14% |
|
Cost income ratio |
43% |
63% |
|
Return on average equity |
25% |
15% |
|
Tax rate |
32% |
29% |
Source: Banca Sistema, Edison Investment Research. Note: underlying loan loss provision Q117 c 0.65%.
The Q117 profit and loss account is compared with Q116 in Exhibit 17 with further discussion of the results below (comparisons with Q116 unless stated).
■
Factoring turnover of €408m was up 21% in the quarter contributing to the increase in factoring receivables outstanding which were 8% ahead at just over €1bn at the end of the quarter or 6% above Q416.
■
As noted, the sharp reduction in Q416 turnover versus Q415 resulted in average factoring receivables outstanding for Q117 being 7% lower at €896m.
■
Salary and pension-backed loans outstanding more than doubled to €313m.
■
Net interest income was down 23% to €12.4m including late payment interest of €3.1m which in turn included an accrual of €2.0m and cash collection of €1.1m. The remaining interest income also included late payment interest paid in extra-judicial settlements of €1m (see below for discussion of BST’s adoption of accrual accounting at end June 2016).
■
The loan loss provisions line showed a net positive figure of €0.5m resulting from a €2.3m net write back of provisions in the factoring portfolio. This followed a review of the previous approach that took 50% provisions against receivables from cities in distress. As the outcome in these cases has been a delay in payment rather than failure to pay the treatment now takes account of the expected time value of payments rather than a straight percentage writedown. On the other hand there was a further increase in provisions in the SME area as some loans moved into the bad loan category and the generic provision for this segment was increased. BST indicates that the underlying level of provisions was c 65bps.
■
Expenses overall showed a moderate increase of 3.8% reflecting in part the addition of Beta Stepstone which contributed to the increase in staff costs. However, the main contributor to the 18% increase here there was a one-off effect as there is a requirement to recognise in full the cost of a non-compete agreement with staff (€0.5m), without which staff costs would have risen less than 5%.
■
The return on average equity was 15% but, as noted, the bank has set a target of over 20% for the full year.
■
Capital ratios remain well above regulatory limits with CET 1 at 12.6% and a total capital ratio of 16.6%, which benefited from a €14m tier II subordinated bond issue in March.
The following two charts take a closer look at the trend in yields for the factoring business. The first shows the average gross yield which includes interest income (cash, cash receipts of late payment interest and the accrual of late payment interest) together with fee income. This shows that the funding costs remained stable across the three periods shown while other costs (collection and introduction costs) were somewhat lower. As noted above, the reduction in gross yield between Q116 and Q117is largely attributed to a lower incidence of late payment interest (in this chart the Q116 figure is adjusted to include accrual of late payment of interest on a pro forma basis). The second chart shows the target yield at expected collection date (see Exhibit 27 for an illustration of the factoring time line) and the funding period for receivables. The target yield here does not include late payment interest or allow for any benefit of early collection. Both duration and yield show fluctuations depending on the mix of receivables purchased but BST confirm that there is no strong trend in pricing although visually the lower end point for target yield suggests a softening which is more reflective of the particular period shown.
|
Exhibit 18: Factoring average gross yield |
Exhibit 19: Funding period and target yield at ECD |
|
|
|
Source: Banca Sistema. Note: Q116 pro forma, including LPI. |
Source: Banc Sistema. Note: ECD = expected collection date. |
|
Exhibit 18: Factoring average gross yield |
|
|
Source: Banca Sistema. Note: Q116 pro forma, including LPI. |
|
Exhibit 19: Funding period and target yield at ECD |
|
|
Source: Banc Sistema. Note: ECD = expected collection date. |
Changes in accounting for late payment interest were adopted in June 2016. Previously, Banca Sistema only recognised this on a cash basis but it now recognises a portion of late payment interest accrued (in common with competitors). The policy reflects the adoption of a statistical model based on collection experience and is only applied where legal proceedings have begun. For receivables from the national healthcare system, 65% of qualifying late payment interest is accrued and for other public sector receivables, 15%. This gives an average rate of 20% accrual, which compares with 40% for Banca Farmafactoring in 2016, for example.
The company has reported that the 15% applied to other public sector receivables is conservative compared with experience and that had the recovery percentages indicated by the model been applied for FY16 then interest income would have been €15.8m (19%) higher. For 2016 €11.3m was accrued including €5.7m related to prior periods which can be regarded as a one-off. As noted earlier the Q117 accrual was €2m and BST expects the rate of accrual to be significantly higher for the balance of the year.
Prospectively, the level of accrual is likely to increase as the outstanding balance of receivables grows and matures. This does not reflect any change in the way that BST collects receivables with an average of only around 10% of receivables purchased in a year moving into legal collection. However, the time taken to pursue collection in this way means that the percentage of outstanding receivables in the process of legal collection had risen to 28% in Q117. Management notes that this accrual will broadly offset the interest cost relating to the receivables where legal proceedings are in process with further income likely to be generated on collection of the remaining late payment interest. Finally, we highlight that the balance of late payment interest earned but not recognised in the profit and loss account had increased from €104.3m at end FY16 to c €110m at the end of Q117: effectively a store of potential future income.
Financials
In this section we discuss some of the assumptions used in our estimates, starting with growth in customer loans outstanding (Exhibit 20). Total loans are assumed to increase by 10% this year and 8% for 2018 and 2019. This depends on a continuation of the return of momentum in factoring turnover (discussed earlier) and the expected stepping up of growth in salary and pension-backed loan purchases. It should be noted that the growth here is net of assumed securitisation sales of between €220m and €250m (2019e) per annum. This would contain the capital requirement for expansion in this area (although the retention of a 5% stake in the securitisation vehicles will absorb some capital) and, we estimate, generate profits of €4-7m per annum, effectively crystallising an element of the interest income that would otherwise have been earned had the loans been retained. Note that presentationally we have including profits on securitisations in other banking income rather than interest income and it is shown on a separate line in our financial summary (Exhibit 26).
|
Exhibit 20: Customer loan assumptions |
Exhibit 21: Interest income history and estimates |
|
|
|
Source: Edison Investment Research, Banca Sistema |
|
Exhibit 20: Customer loan assumptions |
|
|
Source: Edison Investment Research, Banca Sistema |
|
Exhibit 21: Interest income history and estimates |
|
|
Source: Edison Investment Research, Banca Sistema |
Exhibit 21 shows how interest income and the yield on average customer loans are expected to evolve with a broadly stable yield estimated over the forecast period. A large part of the bank’s fee income relates to factoring and if grouped with interest income would push the yield on average loans from just above 6% to c 7%.
On funding, the bank’s strategy is to maintain diversification and at the quarter end the retail and wholesale funding split was 48/52. Within retail there is also broadly equal division between current account and term deposits. Term deposits had an average residual maturity of c 20 months and c 30% are from Germany and Austria, helping to lower average costs. The retail funding cost was 1.5% in the first quarter, as for 2016 and compared with 2.3% in 2015. The cost of term deposits stood at 2%. Wholesale funding includes interbank, ECB funding and a senior bond. The overall cost of funding has been stable at c 1.2% and we only allow for a marginal increase in cost over our forecast period, which is balanced by an equally small increase in yield on outstanding loans to give a stable net interest margin of c 5% between 2017 and 2019. This does not take into account the potential benefit of €123m of TLTRO funding where a nil cost is applied compared with the expected -40bp to be recognised in January 2018 subject to the level of lending relative to BST’s benchmark). The bank’s portfolio of Italian government bonds was increased in the first quarter (to €649m vs €515m at the year-end) including the purchase of some bonds with a three-year duration in anticipation of the CQS securitisation to match TLTRO funding. The positive margin earned over the ECB funding rate (0.2% in FY16) is now a relatively small part of net interest income.
Looking at loan quality, non-performing loans as a percentage of the gross total has increased as the business has matured (from 1% in 2013 to 9.9% last year and 11.3% at the end of Q117). Provision coverage has also increased from 10% to 15% over the same period. BST asset quality trends are influenced by factoring business evolution where the main counterparts are Italian PAs.
Based on customer loan and income forecasts we forecast risk weighted assets increasing from €0.8bn at end 2016 to €1.1bn by the end of 2019. Retained earnings allow the CET ratio, which is already well above the regulatory requirement, to increase from 13.3% to 16.7% after paying dividends equivalent to c 25% of net earnings. This suggests capacity for faster loan growth than we have allowed including, potentially, further diversifying product developments.
While we have not shown quarterly forecasts, we note that a combination of seasonal variations, the incidence of normal fluctuations in factoring volumes and the impact of securitisation profits (and the subsequent absence of related interest income until loan purchases replace the assets sold) is likely to mean an uneven pattern of earnings on a quarterly basis. We will therefore focus more on any evidence of changes in longer-term trends when reviewing results announcements and commentary.
Valuation
In this section we consider the market valuation of Banca Sistema in the context of selected peers, discuss the output of a ROE/COE model and suggest a valuation based on this. Finally, for reference, we compare the recent performance of the shares with that of the valuation peer group.
Our peer group includes companies involved in factoring, debt purchase, debt management and collection. Banca Sistema is characterised by its particular focus on public sector receivables and in this respect recently listed Banca Farmafactoring is the closest peer while Banca IFIS is a significant player in factoring in the Italian market as well as purchasing and managing non-performing loans together with corporate banking and leasing activities. As shown in Exhibit 22, Banca Sistema is trading on the lowest prospective P/E and is on a below average price to book rating even though it has an above average ROE and the highest yield in the group. At this stage we have not included companies with pawnbroking activities in the comparison as this is yet to become a material contributor for Banca Sistema.
Exhibit 22: Valuation comparison
Ticker |
Market cap |
2017 P/E |
Yield |
ROE |
Price to book (x) |
|
Banca Sistema |
BST IM |
186.3 |
6.6 |
3.3 |
25.4 |
1.6 |
Arrow Global |
ARW LN |
746.5 |
10.9 |
2.5 |
16.8 |
3.8 |
Banca Farmafactoring |
BFF IM |
750.2 |
8.2 |
N/A |
21.7 |
2.3 |
Banca IFIS |
IFIS IM |
2,002.8 |
17.3 |
2.2 |
15.5 |
1.6 |
Encore Capital |
ECPG US |
806.6 |
9.2 |
0.0 |
13.3 |
1.6 |
Grenke |
GLJ GY |
2,752.6 |
23.0 |
0.9 |
16.2 |
3.8 |
Hoist Finance |
HOFI SS |
695.4 |
11.9 |
0.9 |
17.1 |
2.6 |
Intrum Justitia |
IJ SS |
2,583.3 |
16.7 |
2.6 |
40.9 |
6.2 |
Kruk |
KRU PW |
1,312.5 |
18.9 |
0.7 |
24.6 |
4.5 |
PRA |
PRAA US |
1,419.4 |
15.5 |
0.0 |
10.2 |
1.8 |
Average |
13.8 |
1.5 |
20.2 |
3.0 |
Source: Bloomberg. Note: Priced at 4 May 2017.
In Exhibit 23 we have charted the price to book and returns on equity for the same peer group. As in the multiple comparison, Banca Sistema appears cautiously valued.
|
Exhibit 23: Comparing ROE and price to book |
|
|
Source: Thomson Datastream |
We have applied a ROE/COE model to Banca Sistema using central assumptions of a cost of equity of 12.4%, a sustainable return on equity of 22.0% (equivalent to our 2018 estimate) and long-term growth of 4%; our valuation comes out at c €3.15/share (implying a price to book ratio of 1.6x and a prospective P/E of 8.9x). The sensitivity of the valuation to return on equity and cost of equity assumptions is shown in Exhibit 24 while sentiment relating to the Italian market could fluctuate significantly modifying the required return and valuation from a macro perspective. Reversing the calculation, the current share price would be consistent with a cost of equity of 15.5%, a cautious assumption. A dividend discount model factoring in a long-term ROE of 18%, an 82% longer-term payout ratio and a cost of equity of 12.4% gives a valuation in line with the ROE/COE model.
Exhibit 24: ROE/COE valuation output variations (value per share, €)
Cost of equity |
||||||
13.4% |
12.9% |
12.4% |
11.9% |
11.4% |
||
Return on equity |
20.0% |
2.50 |
2.64 |
2.80 |
2.97 |
3.17 |
21.0% |
2.66 |
2.81 |
2.97 |
3.16 |
3.37 |
|
22.0% |
2.81 |
2.97 |
3.15 |
3.35 |
3.57 |
|
23.0% |
2.97 |
3.14 |
3.32 |
3.53 |
3.77 |
|
24.0% |
3.13 |
3.30 |
3.50 |
3.72 |
3.97 |
|
Source: Edison Investment Research
Finally, we include a share price performance comparison in Exhibit 25. The different segmental mix and geographical exposure of these companies contributes to the performance differentials and Banca Sistema’s performance has been weaker than the average over all the periods shown, potentially highlighting the scope for a significant re-rating once confidence in the renewed momentum in the factoring business builds.
Exhibit 25: Share price performance comparison
(%) |
1 Month |
3 Months |
1 Year |
YTD |
From 12m high |
Banca Sistema |
-15.0 |
-2.9 |
-14.0 |
5.3 |
-20.8 |
Arrow Global |
3.2 |
12.3 |
37.5 |
21.1 |
-5.9 |
Banca Farmafactoring |
-6.2 |
||||
Banca IFIS |
2.7 |
42.1 |
56.4 |
43.2 |
-6.8 |
Encore Capital |
13.6 |
6.7 |
29.4 |
19.9 |
-4.4 |
Grenke |
9.6 |
18.0 |
7.0 |
25.1 |
-1.5 |
Hoist Finance |
9.2 |
-1.8 |
1.2 |
-1.5 |
-6.7 |
Intrum Justitia |
2.5 |
14.2 |
18.9 |
12.6 |
-8.9 |
Kruk |
16.1 |
25.5 |
56.8 |
24.5 |
-3.3 |
PRA |
6.5 |
-16.4 |
8.8 |
-14.3 |
-21.5 |
Average |
5.4 |
10.9 |
22.4 |
15.1 |
-8.6 |
Source: Bloomberg. Note: Priced at 4 May 2017.
Sensitivities
The discussion of the market background and our forecast assumptions earlier in the note pointed to a number of uncertainties to consider when assessing the outlook for Banca Sistema. Here we summarise a selection of the key sensitivities.
Factoring market growth will be influenced by issues including supplier behaviour, payment patterns in the public sector and the availability of alternative sources of credit. The potential for increased penetration of factoring and the opportunity for Banca Sistema to increase its still relatively small market share are positive factors here. Public sector payment times remain obstinately long and, while contraction is a risk, EU-driven legislation has failed to change payment delays sufficiently to impact the attraction of factoring as a way of managing liquidity. Competitive behaviour will be among the determinants of pricing and with large banks as overall market leaders focused on other parts of their business, this could be detrimental for pricing. Against this Banca Sistema has a particular focus on public sector receivables and benefits from its proprietary database and network of supplier and obligor relationships.
Diversifying investments such as pawnbroking carry a risk but also opportunity for positive surprises in earnings and enhancement of longer-term returns on equity. On our estimates Banca Sistema will have headroom in terms of capital to expand its loan book faster than we have assumed.
Credit risk is mitigated by the fact that most of the loan book has the state or government supported organisations as counterparts. The salary and pension backed loans are primarily to government employed workers and pensioners with additional comfort provided by compulsory insurance cover.
Interest rate risk is likely to prove modest with factoring loans being of short duration. Therefore, repricing could actually outpace changes in funding costs resulting in a favourable temporary impact on profitability once rates do begin to rise.
Exhibit 26: Financial summary
Year end 31 December |
2012 |
2013 |
2014 |
2015 |
2016 |
2017e |
2018e |
2019e |
Income statement |
||||||||
Interest income |
30,161 |
52,273 |
75,793 |
79,019 |
86,321 |
89,010 |
97,884 |
105,493 |
Interest expense |
(17,454) |
(30,543) |
(27,456) |
(21,013) |
(15,321) |
(17,213) |
(18,689) |
(21,110) |
Net interest income |
12,707 |
21,730 |
48,337 |
58,006 |
71,000 |
71,798 |
79,195 |
84,384 |
Net fee and commission income |
1,736 |
8,935 |
11,501 |
11,168 |
9,060 |
9,967 |
11,126 |
11,876 |
Dividends and similar income |
0 |
0 |
33 |
0 |
227 |
0 |
0 |
0 |
Profit on securitisation |
0 |
0 |
0 |
0 |
0 |
4,500 |
5,670 |
6,750 |
Net income from asset sales/purchases and trading |
9,088 |
5,901 |
4,679 |
2,640 |
1,196 |
980 |
1,200 |
1,200 |
Net interest and other banking income |
23,531 |
36,566 |
64,550 |
71,814 |
81,483 |
87,244 |
97,191 |
104,210 |
Net impairment losses on loans |
(901) |
(451) |
(3,520) |
(5,439) |
(9,765) |
(6,270) |
(7,666) |
(8,274) |
Net income from banking activities |
22,630 |
36,115 |
61,030 |
66,375 |
71,718 |
80,974 |
89,524 |
95,936 |
Personnel expenses |
(8,385) |
(9,648) |
(12,107) |
(17,528) |
(15,169) |
(16,511) |
(17,501) |
(18,551) |
Other administrative expenses |
(9,782) |
(12,690) |
(18,385) |
(24,350) |
(22,529) |
(23,595) |
(24,421) |
(25,276) |
Administrative expenses |
(18,167) |
(22,338) |
(30,492) |
(41,878) |
(37,698) |
(40,106) |
(41,922) |
(43,827) |
Other operating income/costs |
(431) |
(190) |
(937) |
59 |
(589) |
116 |
0 |
0 |
Operating expenses |
(18,598) |
(22,528) |
(31,429) |
(41,819) |
(38,287) |
(39,990) |
(41,922) |
(43,827) |
Profit/(loss) from equity investments |
0 |
(1,388) |
71 |
956 |
2,281 |
0 |
0 |
0 |
Pre-tax profit |
4,032 |
12,199 |
29,672 |
25,512 |
35,712 |
40,984 |
47,602 |
52,109 |
Tax |
(1,942) |
(5,197) |
(10,133) |
(7,905) |
(10,399) |
(12,572) |
(14,757) |
(16,154) |
Profit after tax |
2,090 |
7,002 |
19,539 |
17,607 |
25,313 |
28,412 |
32,845 |
35,955 |
Adjustment for normalised earnings |
0 |
0 |
0 |
6106 |
1095 |
0 |
0 |
0 |
Adjusted net income |
2,090 |
7,002 |
19,539 |
23,713 |
26,408 |
28,412 |
32,845 |
35,955 |
Reported earnings per share € |
0.22 |
0.31 |
0.35 |
0.41 |
0.45 |
|||
Normalised earnings per share € |
0.29 |
0.33 |
0.35 |
0.41 |
0.45 |
|||
Dividend per share € |
0.053 |
0.076 |
0.090 |
0.095 |
0.110 |
|||
Balance sheet |
||||||||
Assets |
||||||||
Financial assets available for sale |
540,994 |
847,045 |
858,007 |
925,402 |
514,838 |
571,780 |
571,780 |
571,780 |
Due from banks |
14,475 |
58,814 |
16,682 |
2,076 |
83,493 |
80,171 |
80,171 |
80,171 |
Loans to customers |
484,435 |
1,088,085 |
1,193,754 |
1,457,990 |
1,348,329 |
1,485,508 |
1,605,741 |
1,737,089 |
Property, plant and equipment |
445 |
715 |
1,201 |
1,058 |
23,313 |
23,706 |
23,706 |
23,706 |
Intangible assets |
1,842 |
1,828 |
1,904 |
1,872 |
1,835 |
1,850 |
1,850 |
1,850 |
Tax assets |
4,309 |
2,670 |
2,752 |
7,353 |
10,528 |
10,383 |
10,383 |
10,383 |
Other assets |
7,562 |
4,193 |
6,953 |
15,919 |
17,027 |
100,191 |
100,191 |
100,191 |
Total assets |
1,054,062 |
2,003,350 |
2,081,253 |
2,411,670 |
1,999,363 |
2,273,589 |
2,393,822 |
2,525,170 |
Liabilities and shareholders' funds |
||||||||
Due to banks |
113,923 |
931,580 |
821,404 |
362,075 |
458,126 |
480,152 |
519,014 |
561,469 |
Due to customers |
844,787 |
988,052 |
1,153,797 |
1,878,339 |
1,262,123 |
1,468,021 |
1,523,296 |
1,583,345 |
Securities in issue |
55,242 |
35,216 |
20,109 |
20,102 |
90,330 |
104,971 |
104,971 |
104,971 |
Total tax liabilities |
1,627 |
2,585 |
6,248 |
804 |
8,539 |
10,134 |
10,134 |
10,134 |
Other liabilities |
21,662 |
22,890 |
36,441 |
55,317 |
59,825 |
67,306 |
67,306 |
67,306 |
Employee termination indemnities |
623 |
732 |
1,173 |
1,303 |
1,998 |
2,001 |
2,122 |
2,249 |
Provisions for risks and charges |
5 |
318 |
1,030 |
372 |
4,105 |
4,519 |
4,885 |
5,284 |
Total liabilities |
1,037,869 |
1,981,373 |
2,040,202 |
2,318,312 |
1,885,046 |
2,137,104 |
2,231,727 |
2,334,758 |
Group shareholders' equity |
16,193 |
21,977 |
41,051 |
93,358 |
114,297 |
136,485 |
162,095 |
190,412 |
Minority interests |
0 |
0 |
0 |
0 |
20 |
0 |
0 |
0 |
Total liabilities and equity |
1,054,062 |
2,003,350 |
2,081,253 |
2,411,670 |
1,999,363 |
2,273,589 |
2,393,822 |
2,525,170 |
Capital position |
||||||||
Risk weighted assets |
363,756 |
635,658 |
788,000 |
883,050 |
979,057 |
1,073,178 |
||
Credit risk/customer loans |
25% |
37% |
48% |
49% |
51% |
51% |
||
RWA/total assets |
17% |
26% |
39% |
39% |
41% |
42% |
||
Common equity tier 1 |
37,849 |
86,892 |
104,600 |
127,404 |
152,612 |
179,726 |
||
Total capital |
57,849 |
106,892 |
124,700 |
147,404 |
172,612 |
199,726 |
||
CET1 ratio |
10.4% |
13.7% |
13.3% |
14.4% |
15.6% |
16.7% |
||
Total capital ratio |
15.9% |
16.8% |
15.8% |
16.7% |
17.6% |
18.6% |
||
Leverage ratio |
4.2% |
6.1% |
6.4% |
7.2% |
7.9% |
|||
Other ratios |
||||||||
Net interest margin |
2.8% |
4.2% |
4.4% |
5.1% |
5.1% |
5.1% |
5.0% |
|
Loan loss provision as % of average loans |
0.06% |
0.31% |
0.41% |
0.70% |
0.44% |
0.50% |
0.50% |
|
Total expenses % of interest and fee income |
72.8% |
51.0% |
60.5% |
47.1% |
49.1% |
46.4% |
45.5% |
|
Return on average equity |
36.7% |
62.0% |
26.8% |
25.4% |
22.7% |
22.0% |
20.4% |
|
Tax rate |
48.2% |
42.6% |
34.2% |
31.0% |
29.1% |
30.7% |
31.0% |
31.0% |
Source: Company data, Edison Investment Research
Appendix
Pricing timeline for a factoring transaction
Exhibit 27 is a simplified illustration of the timeline for a factoring transaction that gives an indication of BST’s approach to pricing to ensure that it can earn an attractive return for shareholders.
|
Exhibit 27: Illustration of the pricing of a factoring transaction |
|
|
Source: Banca Sistema, Edison Research |
Taking the steps in the timeline shown in Exhibit 27 in turn:
1.
The invoice is issued by a supplier with a specified payment date.
2.
The invoice payment date, typically 30 days after the invoice date. To put this in context, for Italian public sector invoices the average time to payment, as reported by Intrum Justitia, was 130 days and for commercial transactions 80 days.
3.
The purchase of the receivable in this illustration takes place after the due date. When a supplier approaches BST to sell receivables the bank undertakes a multi-stage appraisal of the portfolio including checks on the nature of supply agreements, the quality of the obligor and a risk evaluation. Pricing is determined with reference to BST’s own database of obligor payment patterns. This proprietary resource allows BST to estimate an expected collection date (5) and a later collection date (6) on which a competitive price (discount to face value) can be based with the aim of generating above the desired minimum return. The transaction is subject to the client agreeing the price and approval by BST’s executive committee.
4.
Collection activities are stepped up 30 days before the expected date, with the aim of at least meeting the target return.
5.
The expected collection date. If money is collected on or before this date BST will secure its target return or better. Banca Sistema reports that since 2011 the vast majority of collections occurred before the expected collection date. From the client’s perspective the extra margin generated at this point is not seen as a cost as it has benefited from faster and certain cash flow generation at an attractive cost given that the collection process has effectively been outsourced to a specialist.
6.
If collection is delayed to the priced collection date then this still generates the target minimum return. Remaining outstandings after this point will be subject to legal collection, including late payment interest which will help support the overall return at the target level.
|
|||||||||||||||||||||||||||||||||||||||||||
|
|
Marlborough Wine Estates Group (MWE), which was formed in March 2015 to acquire vineyard assets comprising the Otuwhero Estate from Min (James) Jia, is targeting the development of premium New Zealand white wine brands in China. MWE notified the market in April 2017 that it expected to fall short of its key operating milestone (KOM) target for international bottled wine sales revenue by more than 10% for the year to June 2017. It is now resetting the target at NZ$1.3m, down from NZ$3.2m.