Last close As at 05/08/2026
—
— 0.00 (0.00%)
Market capitalisation
—
Research: Financials
Against a soft trading background OTC Markets Group (OTCM) delivered FY16 numbers slightly ahead of our expectation and the prior year. While the number of companies on its premium exchanges fell during the year there has been encouraging pick-up in new joiners in Q4 and early 2017. On a medium-term view the increased number of states, now 20, that grant OTCM markets Blue Sky recognition is important in helping draw in additional, good quality, corporate clients.
Written by
OTC Markets Group |
Growing market recognition |
FY16 results |
Financial services |
10 March 2017 |
Share price performance
Business description
Next events
Analysts
OTC Markets Group is a research client of Edison Investment Research Limited |
|||||||||||||||||||||||||||||||||||||||||||||||
Against a soft trading background OTC Markets Group (OTCM) delivered FY16 numbers slightly ahead of our expectation and the prior year. While the number of companies on its premium exchanges fell during the year there has been encouraging pick-up in new joiners in Q4 and early 2017. On a medium-term view the increased number of states, now 20, that grant OTCM markets Blue Sky recognition is important in helping draw in additional, good quality, corporate clients.
Year end |
Revenue ($m) |
PBT* |
EPS* |
DPS** |
P/E |
Yield |
12/15 |
49.9 |
16.9 |
0.88 |
1.08 |
23.7 |
5.2 |
12/16 |
50.9 |
16.9 |
0.90 |
1.16 |
23.2 |
5.6 |
12/17e |
53.3 |
17.9 |
0.93 |
1.20 |
22.4 |
5.8 |
12/18e |
55.7 |
18.7 |
0.96 |
1.22 |
21.7 |
5.9 |
Note: *Fully diluted and calculated after restricted stock awards and excluding exceptional items and amortisation of acquired intangibles. **Including special declared dividends of $0.6 for 2015 and 2016, and an estimated $0.6 for 2017 and 2018.
FY16 held back by subdued volatility
OTCM’s total revenues increased by just below 2% to $50.9m reflecting reduced market volatility that, together with a shrinking number of active brokers and the removal of quote fees, contributed to a 10% decline in the OTC Link ATS business. Market data remains the largest revenue contributor and made a small advance despite a slight reduction in the number of professional data users. The bright spot was corporate services (mainly subscription type revenue from companies on the premium markets) where the full year impact of earlier growth in company numbers at OTCQB in particular and increased fees drove a 10% increase. At the pre-tax profit level there was little change and earnings per share increased 2.4% on a lower tax charge.
Encouraging start to 2017
As noted, there are some encouraging signs for the start of the current year with the rate of new company sign ups running at a higher level and the retention rate at the annual renewal point being up on the prior year despite increased fees. While equity market levels have also shown a positive trend that should be helpful for OTCM, risks do remain in the shape of potential global geopolitical developments including European elections, Brexit and policy development in the Trump administration. Competition and regulatory intervention are other factors to consider, but OTCM’s well-established network and a desire to trim back red tape in Washington should be positive factors on these fronts. Our estimate for FY17 is largely unchanged but may prove conservative given the positive start to the year.
Valuation
While our DCF model would point to a slightly lower valuation than before on unchanged assumptions ($18.00 versus $18.90), taking into account a peer comparison we think it is reasonable to assign a fair value of c $20, similar to the current share price (page 6).
2016 results – weak background, stronger trend in Q4
OTC Markets Group’s fourth quarter revenues were slightly lower year-on-year (1.4%) but were up 2.2% compared with the third quarter and the full year figure showed a gain of 1.9% (see Exhibit 1). This performance was achieved in a year of relatively subdued trading volumes and reduced corporate activity. The operating margin was stable at 35% and profit before tax was little changed at $16.9m while a lower tax charge allowed net earnings to increase by 2.6% and diluted EPS by 2.4%. There was a total dividend of $1.16 (+7%) for FY16 comprising quarterly dividends of $0.14 and a $0.60 special dividend.
Exhibit 1: 2016 full year P&L results summary
2014 |
2015 |
2016 |
FY16/FY15 % change |
|
OTC Link ATS |
12,019 |
11,796 |
10,573 |
(10.4) |
Market data licensing |
20,334 |
20,610 |
21,054 |
2.2 |
Corporate services |
9,862 |
17,503 |
19,254 |
10.0 |
Gross revenues |
42,215 |
49,909 |
50,881 |
1.9 |
Re-distribution fees and rebates |
(2,388) |
(2,379) |
(2,317) |
(2.6) |
Net revenue |
39,827 |
47,530 |
48,564 |
2.2 |
Operating expenses |
(26,925) |
(30,664) |
(31,638) |
3.2 |
Income from operations |
12,902 |
16,866 |
16,926 |
0.4 |
Other income / net interest |
9 |
27 |
9 |
(66.7) |
Income before provision for income taxes |
12,911 |
16,893 |
16,935 |
0.2 |
Taxes |
(5,021) |
(6,635) |
(6,407) |
(3.4) |
Net income |
7,890 |
10,258 |
10,528 |
2.6 |
Diluted EPS $ |
0.69 |
0.88 |
0.90 |
2.4 |
Operating margin |
32% |
35% |
35% |
Source: OTCM Markets Group
OTC Link ATS operating metrics show the total $ value of trading was down 3.4% for FY16 and the number of active brokers continued to contract through a combination of consolidation and withdrawal of participants (by 10% to 104). This reduction reflected muted volumes, competitive pressure on margins and the burden of regulatory requirements. Revenue was down by 10% within which the consolidation and closure of Citigroup’s Automated Trading Desk removed c 4% of revenue on its own (the final contribution to revenue in FY16 was $0.24m, 2.3% of the segment total). The most marked decline was in quote fees (down 25% - see Exhibit 2), where the removal of fees on OTCQX and OTXQB in July 2015 was an important contributor to the reduction. An increase in messaging fees that took place at the same time accounts for the increase in trade message revenue, which was partially offset by lower messaging volumes. Positively, after four quarters of decline, there was a sequential pick up in segmental revenues in Q4 (+4%).
The number of professional market data users was down slightly (1.3%) acting as a modest drag on revenues for the Market data licensing segment, while non-professional users increased sharply (37%). Reflecting the smaller number of professional users licence income was slightly lower but this was more than offset by increases in other revenues arising from newly introduced indirect access fees, data and derived data licences and enterprise licences.
For the corporate services business the overall number of clients was down 8.1%, including a smaller, 6.1%, decline for OTCQX clients. However, the full-year impact of the more than doubling in the number of OTCB clients in 2015 and a 12% increase for OTCQX contributed to an overall 10% increase in revenue including an 18% increase for OTCQB clients. OTCQX revenues also benefited from a price increase from $15,000 to $20,000 applied to new clients; existing clients pay the increased fee this year while OTCQB companies on a promotional rate of $7,500 will see an increase to $10,000. The disclosure and news service sees fluctuating activity according to corporate activity and ended the year up 9%, partly reflecting a price increase implemented in February 2016.
Exhibit 2: Sub-segment revenue analysis
$m unless stated |
2015 |
2016 |
% change |
OTC Link ATS |
|||
Quote fees |
3.05 |
2.29 |
(25.0) |
Trade messages |
3.18 |
3.37 |
6.0 |
Market participant subscriptions |
2.71 |
2.44 |
(10.0) |
Other |
2.85 |
2.47 |
(13.3) |
Total |
11.80 |
10.57 |
(10.4) |
Market data licences |
|||
User licence subscriptions |
14.40 |
14.11 |
(2.0) |
Data licences and other income |
6.21 |
6.94 |
4.2 |
Total |
20.61 |
21.05 |
2.2 |
Corporate services |
|||
OTCQB |
7.78 |
9.18 |
18.0 |
OTCQX |
6.25 |
6.30 |
0.8 |
Disclosure and news service |
3.00 |
3.27 |
9.0 |
Other |
0.48 |
0.51 |
5.9 |
Total |
17.50 |
19.25 |
10.0 |
Source: OTC Markets Group, Edison Investment Research. Note: Indicative as sub-segment figures are mainly based on management commentary giving percentage changes so are subject to rounding errors.
Exhibit 3 provides a longer-term view of the progression of group revenues. Although growth was limited by market conditions last year as detailed above, over the period shown compound annual growth was 13%. The mix has shifted significantly with revenue from corporate services (mainly generated from application and annual charges to companies on the premium OTCQX and OTCQB markets) compounding at a rate of 32%. As a result, the contribution from this segment has increased from 9% to 38% of the total while market data remains the largest contributor at 41% and OTC Link ATS accounts for the 21% balance compared with 36% in 2007.
|
Exhibit 3: Gross revenue evolution and analysis |
|
|
Source: OTC Markets Group |
OTCM has continued to work with US states and the North American Securities Administrators Association to extend the number that accept the disclosure provided by OTCQX and OTCQB securities for the purpose of Blue Sky recognitions that generally allow secondary trading of qualifying securities. This is important in reinforcing the reputation of both as efficient and established public markets and increasing their appeal to companies as venues for public trading. OTCM note that Nasdaq had recognition in 27 states when it floated Apple and, since the time of the H116 announcement, OTCM’s Blue Sky recognitions have risen from five to 201.
1 March 2017: Alaska, Arkansas, Colorado, Georgia, Idaho (OTCQX only), Iowa, Kansas (OTCQX only), Mississippi, Nebraska, New Jersey, New Mexico, Ohio, Oregon, Rhode Island, South Dakota, Texas, Washington, Wisconsin, Wyoming, and Vermont (OTCQX only) recognised OTCQX and OTCQB markets as securities manuals. In total 44 states and jurisdictions maintain manual exemptions.
Initiatives to improve the transparency of the markets and enhance the client experience during FY16 have included: (1) Q Score, which gives liquidity metrics allowing participants in the OTC Link ATS network to identify the better providers of liquidity; (2) Research Marketplace, which gives companies a choice of sources for sponsored research (includes ACF Equity Research, Sidoti & Co and Edison); (3) a collaboration with Morningstar to provide OTCQB and certain OTCQB companies with quantitative research coverage; (4) a rule change at OTCQX (starting January 2017) that removed the burden of the ongoing OTCQX adviser requirement; and (5) the Transfer Agent Verified Shares Program which collates information from transfer agents to give timely information to avoid undisclosed dilution (seven agents have signed up to the program so far).
Current trading environment and outlook
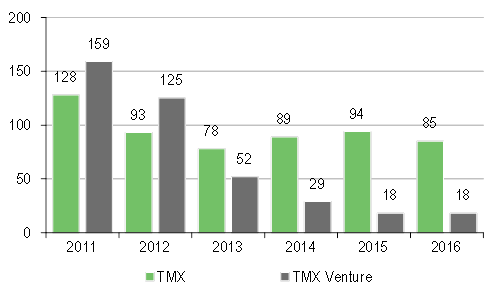
In order to give a sense of equity market background we start by looking at trends in IPOs for Nasdaq, TMX, TMX Venture and AIM as indicators of sentiment that might translate into new client activity for OTCM. As shown in Exhibits 4-6, IPO activity last year was running at levels well below the peaks between three and five (for TMX Ventures) years previously. Other features to note are the particularly severe fall at TMX Ventures reflecting its exposure to resources while activity appears to be stabilising both there and at AIM, where there was a marginal increase in 2016.
|
Exhibit 4: Nasdaq – number of IPOs |
Exhibit 5: TMX and TMX Venture – number of IPOs |
|
|
|
Source: Nasdaq |
Source: TMX |
|
Exhibit 4: Nasdaq – number of IPOs |
|
|
Source: Nasdaq |
|
Exhibit 5: TMX and TMX Venture – number of IPOs |
|
|
Source: TMX |
The recent performance of relevant market indices is shown in exhibit 7, with all of them in positive territory probably reflecting both continued generally positive economic indicators and expectations of a positive environment for US businesses under the Trump administration.
|
Exhibit 6: AIM number of admissions |
Exhibit 7: Six-month index performance |
|
|
|
Source: AIM |
Source: Bloomberg. Note: Total return, to 6 March 2017 |
|
Exhibit 6: AIM number of admissions |
|
|
Source: AIM |
|
Exhibit 7: Six-month index performance |
|
|
Source: Bloomberg. Note: Total return, to 6 March 2017 |
Turning to OTCM itself, the level of new company signings at OTCQX fell from 126 in 2015 to 60 last year. However, the trend improved towards the end of the year with 20 companies added in Q4 and there was a similar pattern at OTCQB where 72 companies joined in Q4 compared with 54 in the same period in 2015. 2017 has started well with retention at OTCQX of 93% versus 89% last year despite fee increases being implemented. Both markets have recorded good levels of new additions in January and February and the pipeline is described as strong.
Exhibit 8 updates the comparison we have shown before between the number of professional users of OTCM’s market data and users of UTP (Nasdaq). UTP numbers have shown growth from 2014 while OTCM data users have been essentially flat and remain small relative to UTP numbers. However, if OTCM can continue to build the reputation of its premium markets and win attractive companies as clients, there should be good potential to increase users and market data revenue.
|
Exhibit 8: OTCM and UTP (Nasdaq) professional users |
|
|
Source: OTCM, UTP Plan, Edison Investment Research |
While the trends in terms of the economy, corporate activity and market levels are encouraging, there is potential for a reversal, perhaps sparked by political developments globally, Brexit-related uncertainties or increased concerns over stability of the eurozone.
Turning to sensitivities specific to OTCM, potential competitive challenges include the possibility that large exchanges such as NYSE and Nasdaq might focus on providing more direct competitive offerings. Global OTC, operated by a subsidiary of the NYSE, is an ATS that provides an automated execution facility for certain OTC securities. It has said that it will remove its quotations from OTC Link ATS in May this year. OTCM has noted that as a result of the changes Global OTC is making it will compete more directly with OTCM, albeit participants offsetting transactions on OTC Link ATS may mitigate the possible negative impact on OTCM’s volumes.
On the regulatory front FINRA has withdrawn its long-standing but inactive QCF proposal that if implemented could have had a significant negative impact on market data revenues. The more recent proposal by FINRA for an ‘over-the-counter display facility’ (ODF, August 2016) to act as a backup to OTCM’s OTC Link ATS appears to have been brought forward in response to concerns at the SEC regarding the availability of alternative channels should there be a system failure. ODF has been subject to an initial consultation eliciting three responses (including OTCM), each arguing against the proposal for a number of reasons including the potential anti-competitive nature of the proposal, the suggestion that it would not achieve its objective and that it would increase costs for broker dealers who would be compelled to connect. The proposal has not been submitted to the SEC and, were this to happen, it would be subject to further consultation. OTCM has indicated that it is at this stage unable to estimate the impact of the proposal were it implemented. It is worth highlighting here that 2016 marked the second full year of 100% trading-hours uptime that OTC Link ATS has achieved reflecting the investment in its systems that was undertaken following difficulties in earlier years.
On a medium-term view OTCM still looks to the development of online and crowdfunding facilitated by the JOBS Act to provide a good flow of companies that are likely to find its offering of cost effective venues for public trading of shares attractive. The first successfully completed Regulation A+ offering began trading on the OTCQX market in February 2016. OTCM expects that additional securities issued in reliance on Regulation A+ will ultimately trade on the OTCQX, OTCQB and Pink markets.
Financials
As shown below, the result for FY16 was just ahead of our expectation for revenues, 2% above estimated pre-tax profits and 1% higher at the earnings per share level. We have only made modest changes in our FY17 estimate while noting the potential for earnings upgrades later in the year if the more positive signals on company additions to OTCQX and OTCQB are continued and if improved equity trading conditions are maintained, reversing some of the headwinds OTC Link ATS experienced during 2016. For 2018, we assume overall revenue growth will match the 5% we assume for 2017, with corporate services still providing the larger share of growth. We expect a maintained operating margin of 35%.
Exhibit 9: Earnings revisions
|
Gross revenue ($m) |
PBT ($m) |
EPS ($) |
Dividend ($) |
||||||||
|
Old |
New |
% change |
Old |
New |
% change |
Old |
New |
% change |
Old |
New |
% change |
2016 |
50.7 |
50.9 |
0 |
16.7 |
16.9 |
2 |
0.90 |
0.90 |
1 |
1.16 |
1.16 |
0 |
2017e |
53.2 |
53.3 |
0 |
17.7 |
17.9 |
1 |
0.93 |
0.93 |
0 |
1.20 |
1.20 |
0 |
2018e |
N/A |
55.7 |
N/A |
18.7 |
N/A |
0.96 |
N/A |
1.22 |
||||
Source: Edison Investment Research. Note: For 2016 new column = actual
At the year end the cash position on the balance sheet was $25.0m, similar to the prior year ($23.4m) and, on our estimates, this broad level will be maintained for FY17 and FY18 after assuming the payment of further special dividends such that the overall level of dividend continues to increase.
Valuation
We have updated our comparative P/E table (Exhibit 10), which includes major information providers MSCI and Markit (to reflect OTCM’s subscription-based fees and market data exposure), together with global exchange averages and values for the S&P 500 index. OTCM trades within the range for the information providers and is modestly below and above the FY17 and FY18 average P/Es for the exchanges respectively. Further Blue Sky recognitions and confirmation of a pick-up in the environment for corporate activity would help underpin this rating and, as noted above, earnings upgrades could change the denominator in the ratio.
Exhibit 10: OTCM comparative multiples
Estimated P/E ratios (x) |
||
FY17 |
FY18 |
|
MSCI |
26.4 |
22.7 |
Markit |
19.8 |
17.0 |
Average information providers |
23.1 |
19.9 |
Average global exchanges |
23.7 |
20.0 |
S&P 500 |
18.3 |
16.3 |
OTCM |
22.5 |
21.7 |
Source: Bloomberg, Edison Investment Research. Note: Prices as at 9 March 2017.
On unchanged central assumptions, including a discount rate of 9%, cash flow growth of 3% and a terminal value multiple of 10x our discounted cash flow model gives a value of c $18.00 ($18.90 previously) reflecting minor changes in cash flow estimates. A terminal multiple of c 14x (arguably not excessive in comparison to the current year value of c 17x) would be required to approximately match the current share price ($20.85).
Taking into account both the comparative valuations shown above and the potential DCF outputs on a range of assumptions, we see a fair value of c $20 as reasonable (previously $18.90).
Exhibit 11: Financial summary
$000s |
(US GAAP) |
2014 |
2015 |
2016 |
2017e |
2018e |
|
Year end 31 December |
|||||||
PROFIT & LOSS |
|||||||
OTC Link ATS |
12,019 |
11,796 |
10,573 |
10,700 |
11,021 |
||
Market Data Licensing |
20,334 |
20,610 |
21,054 |
21,400 |
22,042 |
||
Corporate Services |
9,862 |
17,503 |
19,254 |
21,179 |
22,662 |
||
Revenue |
42,215 |
49,909 |
50,881 |
53,279 |
55,725 |
||
Re-distribution fees and rebates |
(2,388) |
(2,379) |
(2,317) |
(2,475) |
(2,550) |
||
Net revenue |
|
|
39,827 |
47,530 |
48,564 |
50,804 |
53,175 |
Operating expenses |
(25,382) |
(28,972) |
(30,032) |
(31,233) |
(32,795) |
||
EBITDA |
|
|
14,445 |
18,558 |
18,532 |
19,571 |
20,380 |
Depreciation |
(1,543) |
(1,692) |
(1,606) |
(1,675) |
(1,710) |
||
Operating Profit |
12,902 |
16,866 |
16,926 |
17,896 |
18,670 |
||
Net Interest |
9 |
27 |
9 |
10 |
10 |
||
Profit Before Tax (norm) |
|
|
12,911 |
16,893 |
16,935 |
17,906 |
18,680 |
Tax |
(5,021) |
(6,635) |
(6,407) |
(6,804) |
(7,098) |
||
Profit After Tax (FRS 3) |
7,890 |
10,258 |
10,528 |
11,102 |
11,582 |
||
Profit After Tax (norm) |
7,638 |
9,971 |
10,252 |
10,826 |
11,306 |
||
Fully diluted av. No. of shares (m) |
11.1 |
11.3 |
11.3 |
11.7 |
11.8 |
||
EPS - normalised fully diluted ($) |
|
|
0.69 |
0.88 |
0.90 |
0.93 |
0.96 |
Fully diluted EPS - FRS 3 ($) |
|
|
0.71 |
0.91 |
0.92 |
0.95 |
0.98 |
Dividend per share ($) |
0.82 |
1.08 |
1.16 |
1.20 |
1.22 |
||
EBITDA Margin (%) |
36 |
39 |
38 |
39 |
38 |
||
Operating profit margin (%) |
32 |
35 |
35 |
35 |
35 |
||
BALANCE SHEET |
|||||||
Non-current assets |
|
|
|
|
|
|
|
Intangible Assets |
291 |
291 |
291 |
291 |
291 |
||
Property and other |
4,844 |
4,187 |
3,267 |
2,294 |
1,284 |
||
Current Assets |
|
|
|
|
|
|
|
Debtors |
5,674 |
6,082 |
6,262 |
6,400 |
6,400 |
||
Cash & cash investments |
20,272 |
23,925 |
25,034 |
24,827 |
25,066 |
||
Other current assets |
2,095 |
1,729 |
1,789 |
1,808 |
1,808 |
||
Current Liabilities |
|
|
|
|
|
|
|
Deferred revenues |
(9,521) |
(12,737) |
(14,664) |
(14,500) |
(14,500) |
||
Other current liabilities |
(4,450) |
(5,063) |
(5,372) |
(5,430) |
(5,430) |
||
Long Term Liabilities |
|
|
|
|
|
|
|
Tax, rent and other |
(954) |
(867) |
(1,101) |
(1,087) |
(1,087) |
||
Net Assets |
|
|
18,251 |
17,547 |
15,506 |
14,603 |
13,832 |
NAV per share ($) |
|
|
1.62 |
1.55 |
1.36 |
1.27 |
1.19 |
CASH FLOW |
|||||||
Operating Cash Flow |
|
|
16,985 |
22,400 |
21,752 |
20,967 |
22,031 |
Net Interest |
9 |
27 |
9 |
10 |
10 |
||
Tax |
(4,492) |
(5,320) |
(6,021) |
(6,829) |
(7,098) |
||
Capex |
(1,582) |
(940) |
(415) |
(700) |
(700) |
||
Financing / investments |
(475) |
(420) |
(1,157) |
0 |
0 |
||
Dividends |
(9,109) |
(12,094) |
(13,059) |
(13,655) |
(14,004) |
||
Net Cash Flow |
1,336 |
3,653 |
1,109 |
(207) |
238 |
||
Opening net (debt)/cash |
|
|
18,936 |
20,272 |
23,925 |
25,034 |
24,827 |
Closing net (debt)/cash |
|
|
20,272 |
23,925 |
25,034 |
24,827 |
25,066 |
Source: OTC Markets Group accounts, Edison Investment Research
|
|
Research: Industrials
Cohort’s MCL operation has announced the award of an additional £9.9m four-year contract for the provision of hearing protection systems to the UK MoD. With Cohort having completed the minority buyout on 1 February, the increased visibility from the hearing protection revenue stream now provides greater support for MCL’s medium-term forecasts, increasing earnings quality. Cohort has continued to outperform the market so far this year, continuing to trend towards our fair value of 485p.