Last close As at 05/08/2026
GBP4.30
▲ −8.00 (−1.83%)
Market capitalisation
GBP527m
Research: Investment Companies
VinaCapital Vietnam Opportunity Fund (VOF) is a large, well-established Vietnam specialist investment fund, differentiated by its focus on private deal sourcing. NAV total returns have been particularly strong over the last three years, and are ahead of VN Index and peer returns over the last 12 months, when markets have been volatile. VOF’s share price discount to NAV has narrowed, but it remains wider than the peer group average. The board has taken steps to address the discount, moving VOF’s listing to the LSE’s Main Market in 2016, starting a dividend programme in 2017, and agreeing a reduced management and incentive fee structure in 2018. The board recommends that shareholders vote against discontinuation at the forthcoming AGM, highlighting the promising outlook suggested by market fundamentals, as well as the manager’s strong track record.
Written by
VinaCapital Vietnam Opportunity Fund |
Fundamentals suggest promising outlook |
Investment companies |
5 December 2018 |
Share price/discount performance
Three-year performance vs index
Gearing
Analysts |
||||||||||||||||||||||||||||||||||||||||||||||||||||||||||||||||||||||||
VinaCapital Vietnam Opportunity Fund (VOF) is a large, well-established Vietnam specialist investment fund, differentiated by its focus on private deal sourcing. NAV total returns have been particularly strong over the last three years, and are ahead of VN Index and peer returns over the last 12 months, when markets have been volatile. VOF’s share price discount to NAV has narrowed, but it remains wider than the peer group average. The board has taken steps to address the discount, moving VOF’s listing to the LSE’s Main Market in 2016, starting a dividend programme in 2017, and agreeing a reduced management and incentive fee structure in 2018. The board recommends that shareholders vote against discontinuation at the forthcoming AGM, highlighting the promising outlook suggested by market fundamentals, as well as the manager’s strong track record.
12 months ending |
Share price |
NAV |
Vietnam VN |
MSCI AC Asia ex-Japan (GBP %) |
MSCI World |
FTSE All-Share |
30/11/14 |
23.4 |
14.8 |
19.8 |
11.0 |
14.5 |
4.7 |
30/11/15 |
(6.6) |
1.4 |
3.7 |
(6.8) |
3.9 |
0.6 |
30/11/16 |
57.6 |
55.9 |
42.5 |
29.5 |
25.0 |
9.8 |
30/11/17 |
30.1 |
18.0 |
36.3 |
25.1 |
14.8 |
13.4 |
30/11/18 |
8.0 |
4.9 |
2.5 |
(3.8) |
6.8 |
(1.5) |
Source: Thomson Datastream, Bloomberg. Note: All % on a total return basis in GBP.
Investment strategy: Private equity-style approach
VOF invests across three main asset class segments – listed equity, unlisted equity and private equity, with the manager focusing on privately negotiated deals to secure higher potential returns. Listed equities comprise 70% of the portfolio, but most holdings are sizeable minority stakes originating from private equity or privatisation deals, which VOF is often able to sell on to a strategic investor at a premium to the market price. The manager takes a medium-term view, favouring a concentrated, high-conviction approach to investment selection. The portfolio is focused on the domestic economy and is well diversified by sector.
Market outlook: Fundamentals appear promising
Vietnam’s c 20% stock market correction in 2018 and strong earnings growth have reduced its forward P/E multiple to 13.7x – broadly in line with the world market and at c 4–14% discounts to its regional peers Indonesia, Malaysia, Thailand and the Philippines. Corporate earnings growth prospects are supported by projections for Vietnam’s GDP to grow at a steady c 6.5% per year over the next five years, outpacing slowing growth in China and major advanced economies. Vietnam’s potential to benefit from a US-China trade war and prospective market reforms may further encourage investors to consider adding exposure to the country.
Valuation: Narrowing discount; above-average yield
After briefly widening to 25.6% in October 2018, VOF’s share price discount to NAV has narrowed to 13.7%, which is lower than its 18.9%, 20.6% and 21.5% averages over one, three and five years, respectively. VOF started paying regular dividends in 2017, and its 2.4% yield is the highest in the peer group.
Gavin Wood |
+44 (0)20 3681 2503 |
Sarah Godfrey |
+44 (0)20 3681 2519 |
VinaCapital Vietnam Opportunity Fund is a research client of Edison Investment Research Limited |
|
Exhibit 1: Company at a glance
Investment objective and fund background |
Recent developments |
||||||||||||||||||||||||||||||||||||||||||||||||||||||||||
VinaCapital Vietnam Opportunity Fund (VOF) is a closed-end investment company that seeks to achieve medium- to long-term capital appreciation through investment in assets in Vietnam or in companies with a substantial majority of their assets, operations, revenues or income in, or derived from, Vietnam. The portfolio includes listed and unlisted equities, as well as debt instruments, covering a broad range of sectors. |
■ 16 November 2018: divestment of Green Park Estate project for c US$18.9m, reducing VOF’s direct real estate projects exposure almost to zero. ■ 24 October 2018: final results to end-June 2018 – NAV TR +16.9% in US$; +15.1% in £ vs VN Index +22.4% in US$; +24.0% in £. ■ 24 October 2018: US$0.055 per share second interim dividend declared for FY18. ■ 24 October 2018: Martin Adams to step down from the board at the 2018 AGM. ■ 30 August 2018: US$25m private equity investment in Tam Tri Medical, a growing network of private hospitals throughout Vietnam. ■ 9 August 2018: US$32.5m investment in Ba Huan ceased (agreed February 2018). |
||||||||||||||||||||||||||||||||||||||||||||||||||||||||||
Forthcoming |
Capital structure |
Fund details |
|||||||||||||||||||||||||||||||||||||||||||||||||||||||||
AGM |
10 December 2018 |
Ongoing charges |
1.8% (3.9% incl. perf fee) |
Group |
VinaCapital Investment Management |
||||||||||||||||||||||||||||||||||||||||||||||||||||||
Interim results |
March 2019 |
Net cash |
2.6% (at end-October 2018) |
Manager |
Andy Ho |
||||||||||||||||||||||||||||||||||||||||||||||||||||||
Year end |
30 June |
Annual mgmt fee |
1.50%-0.50% of NAV (see page 7) |
Address |
PO Box 656, East Wing, Trafalgar Court, Les Banques, St. Peter Port, Guernsey GY1 3PP |
||||||||||||||||||||||||||||||||||||||||||||||||||||||
Dividend paid |
April, December |
Performance fee |
12.5% above 8% pa hurdle (capped at 1.5% of average NAV) |
||||||||||||||||||||||||||||||||||||||||||||||||||||||||
Launch date |
30 Sept 2003 |
Company life |
Indefinite (subject to vote) |
Phone |
+84 28 3821 9930 |
||||||||||||||||||||||||||||||||||||||||||||||||||||||
Continuation vote |
Five yearly; next at 2018 AGM |
Loan facilities |
None |
Website |
|||||||||||||||||||||||||||||||||||||||||||||||||||||||
Dividend policy and history (financial years) |
Share buyback policy and history (financial years) |
||||||||||||||||||||||||||||||||||||||||||||||||||||||||||
The board intends to declare semi-annual dividends, each representing c 1% of NAV. Sterling value of US$ dividends declared shown. |
VOF has an ongoing share buyback programme to return capital to shareholders and to support a narrowing of the discount. |
||||||||||||||||||||||||||||||||||||||||||||||||||||||||||
|
|
||||||||||||||||||||||||||||||||||||||||||||||||||||||||||
Shareholder base (as at 31 October 2018) |
Portfolio exposure by asset class* (as at 31 October 2018) |
||||||||||||||||||||||||||||||||||||||||||||||||||||||||||
|
|
||||||||||||||||||||||||||||||||||||||||||||||||||||||||||
Top 10 holdings (as at 31 October 2018) |
|||||||||||||||||||||||||||||||||||||||||||||||||||||||||||
|
|||||||||||||||||||||||||||||||||||||||||||||||||||||||||||
Source: VinaCapital Vietnam Opportunity Fund, Edison Investment Research, Bloomberg, Morningstar. Note: *Excluding cash and other working capital; **N/A where not in end-October 2017 top 10.
Market outlook: Promising fundamental drivers
In spite of a c 20% market decline during 2018, Vietnamese equities have performed strongly over the last five years, with the VN Index significantly outpacing the MSCI AC Asia ex-Japan and MSCI World indices (see Exhibit 2). While valuations appeared stretched at the April 2018 market peak, the subsequent correction has reduced Vietnam’s forward P/E multiple to 13.7x, which is similar to the 13.8x multiple of the world market. Although it is at a c 13% premium to the 12.1x multiple for Asia ex-Japan, this multiple is depressed by China’s low market rating, and Vietnam is trading at a discount to its regional peers, including the Philippines, Indonesia, Malaysia and Thailand.
|
Exhibit 2: Market performance and valuation |
|||||||||||||||||||||||||||||||||||||||||||||||||||||||||||||
VN Index performance vs MSCI AC Asia ex-Japan and World indices |
Datastream market 12 months forward P/E multiples |
||||||||||||||||||||||||||||||||||||||||||||||||||||||||||||
|
|
||||||||||||||||||||||||||||||||||||||||||||||||||||||||||||
|
Source: Thomson Datastream, Bloomberg, Edison Investment Research. Note: Data as at 3 December 2018. |
|||||||||||||||||||||||||||||||||||||||||||||||||||||||||||||
Corporate earnings growth prospects in Vietnam are supported by a favourable economic outlook, reflected in the International Monetary Fund’s projections for steady c 6.5% per year GDP growth through to 2023. This compares to declines in annual GDP growth over the next five years forecast for China and the G7 major advanced economies; from 6.6% to 5.6% and from 2.2% to 1.2% respectively. The prospect of continuing market reforms and Vietnam’s potential to benefit from a US-China trade war may further encourage investors to consider adding exposure to the country.
Fund profile: Vietnam private investment specialist
Launched in 2003, VOF is one of the oldest and largest UK-listed investment companies focusing exclusively on Vietnam. Listed on the LSE main market since March 2016, VOF’s shares joined the FTSE All-Share index in June 2016 and the FTSE 250 index in March 2018. The manager seeks to take advantage of market inefficiencies by investing in public and private equity, primarily via privately sourced deals. VOF’s portfolio provides broad exposure to Vietnam’s domestic economy and growth prospects, via investments across three main asset class segments – listed equity, unlisted equity and private equity. The manager focuses on sectors that he believes will benefit most from Vietnam’s economic growth, notably consumption, construction, infrastructure, real estate, financials and healthcare. Exposure to international trade is limited, which reduces the risks from macroeconomic uncertainties such as currency volatility and international trade policy.
VOF’s investments are mainly sourced as pre-IPO, privately negotiated, private equity-type deals, including government privatisations, and include a degree of downside protection. The manager typically seeks to acquire super-minority stakes, enabling VOF to secure performance commitments for up to three years with associated financial penalties; drag along rights, which enable VOF to ensure that a majority shareholder participates on equal terms if a business is sold to a third party; and board representation, giving influence over company management. VOF’s portfolio manager is VinaCapital’s chief investment officer Andy Ho, who has 18 years’ investment experience.
The fund manager: Andy Ho
The manager’s view: Private deals offer the best opportunities
Andy Ho emphasises that, while listed equities currently make up c 70% of the portfolio, VOF’s focus continues to be on investment opportunities that are not normally available to general market participants. Ho notes that by far the largest source of portfolio investments has been private equity transactions – including Hoa Phat Group (HPG) and Phu Nhuan Jewelry (PNJ) – followed by the equitisation of state-owned enterprises (SOEs) – including Vinamilk (VNM) and Airports Corporation of Vietnam (ACV) – and private placements, including Cotec Construction (CTD). Only c 10% of the portfolio has been sourced via market stock purchases (Exhibit 3, left-hand chart).
Ho notes that historically VOF sourced more investments through market purchases, but observes that fewer attractive investment opportunities have arisen in listed equities in recent years, with stock purchases now typically accounting for less than 15% of new investments (Exhibit 3, right-hand chart). This reflects increasing participation by domestic and overseas investors in Vietnam’s stock market, which has been accompanied by a significant rise in listed equity valuations. While representing c 25% of new investments in FY14 and FY15, Ho points out that direct real estate investment no longer forms a core part of VOF’s strategy, with exposure to this segment now primarily via capital markets (c 18% allocation at end-October 2018).
|
Exhibit 3: Analysis of VOF’s portfolio and investment transactions by deal source |
|
Split of NAV at end-June 2018 by investment entry transaction |
Five-year average (FY14 to FY18) split of investment transactions by source |
|
|
|
Source: VinaCapital Vietnam Opportunity Fund, Edison Investment Research |
|
While VOF’s NAV total return lagged the VN Index over the last financial year, Ho points out that the 29.4% return of VOF’s capital markets portfolio was higher than the index’s 25.7% return. Ho comments that VOF’s bottom-up, valuation-focused approach to equity investing has been very successful over the last three financial years, with the listed portfolio achieving a 27.9% annualised return compared with 15.3% for the index over this period. Looking forward, Ho does not expect the exceptional stock market returns (underpinned by c 20% annual average earnings growth) of the past two financial years to be repeated. He sees a strong likelihood of global stock markets remaining volatile, influenced by rising US interest rates and the US administration’s focus on trade protection. In this environment, he believes that a focus on privately negotiated deals will be even more important to generate attractive returns across listed, unlisted and private equity investments.
Asset allocation
Investment process: Focus on private deal sourcing
VOF takes a bottom-up approach to portfolio construction, making investments opportunistically across a range of industry sectors and asset classes where the manager sees value on a three- to five-year view. After detailed analysis, investments are selected to target the best risk-adjusted returns and the manager prefers to invest where VOF can influence the strategic direction of a business. Investments are selected without reference to index weightings and the manager favours a concentrated, private equity-like approach, which is considered to be a key differentiator for VOF compared with funds that are more index-orientated. VOF typically holds sizeable minority stakes in listed companies, which often enables the manager to divest holdings at a premium to the market price where a strategic investor is seeking to acquire a controlling stake.
Historically, VOF has generated superior returns from unlisted and private equity investments, and this is where the manager continues to focus his efforts. Although VOF’s more recent private equity investments have moved quite quickly into the listed equity segment, the manager expects VOF’s private equity exposure to rise over the medium term from its relatively low current level. Private equity comprises off-market investments in tightly held businesses, which VOF typically holds for around four years as a strategic partner. Unlisted equity investments are holdings in companies that are progressing towards a main exchange listing – allotting sufficient shares to have at least 100 shareholders and then listing within six months on the Unlisted Public Company Market (UPCoM). Companies are often rewarded with a substantial valuation premium upon listing on UPCoM, as well as subsequent listing on a main exchange, but the manager stresses that VOF invests based on fundamental prospects, not potential IPO upside. Thorough due diligence is performed, with the manager identifying and evaluating potential exit routes prior to investing, and typically seeking to invest at a discount to equivalent listed-company valuation multiples, with the aim of achieving an internal rate of return (IRR) of 20% or more. Prospective new investments are reviewed by a risk committee, prior to submission to a six-member investment committee for approval.
Current portfolio positioning
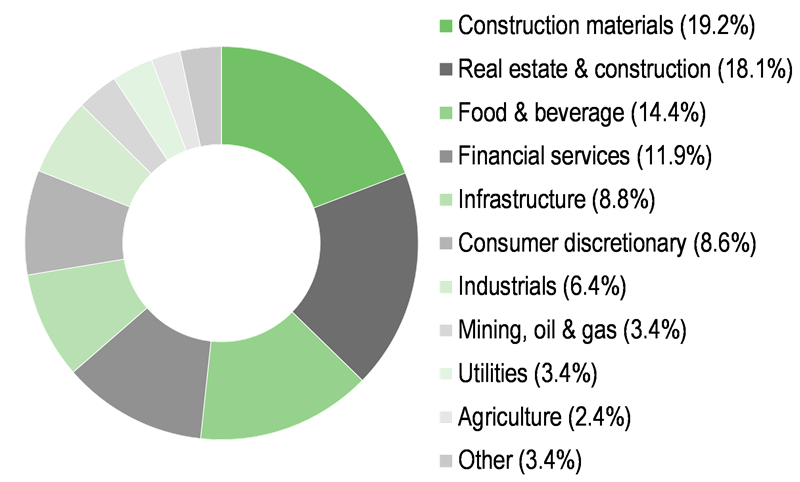
VOF is invested in three main asset class segments – listed equity, unlisted equity and private equity (see Exhibit 4). In line with its strategy to reduce direct real estate exposure in a controlled and orderly manner, VOF sold its last sizeable real estate project, Green Park Estate, in November 2018, leaving operating assets as its only significant direct real estate investment. As intended by management, net cash declined from 8.9% to 2.6% of NAV over the year to end-October 2018, with a number of new investments completed during the period. Private equity declined slightly to 8.5% of NAV at end-October 2018 from 8.8% a year earlier. The manager aims to increase exposure to this segment to c 20% over the medium term, but he notes that more recently, these investments have tended to move quite quickly into the listed equity segment of VOF’s portfolio, thus masking VOF’s predominant focus on private equity-like investment. Overall, the portfolio is well diversified by sector. Exposures reflect a focus on domestic segments of the economy that the manager expects to benefit most from Vietnam’s continuing urbanisation and economic development, notably consumption, construction, infrastructure, real estate, financials and healthcare.
|
Exhibit 4: VOF asset class and sector exposures at end-October 2018 |
|||||||||||||||||||||||||||||||||||||
Asset class exposures (including cash and other working capital) |
Capital markets (listed and unlisted equity) exposure by sector* |
||||||||||||||||||||||||||||||||||||
|
|
||||||||||||||||||||||||||||||||||||
|
Source: VinaCapital Vietnam Opportunity Fund, Edison Investment Research. Note: *Excludes cash and other working capital. |
|||||||||||||||||||||||||||||||||||||
Performance: Strong medium- and long-term returns
As illustrated in Exhibit 5 (left-hand chart), VOF’s NAV total return lagged the VN Index during the market’s exceptionally strong performance from early February to early April 2018, but showed some resilience in the market correction over the following three months – only weakening appreciably in June – and then broadly matched the market recovery over the next three months. Exhibit 5 (right-hand chart) shows that, while VOF’s NAV total return underperformed the VN Index over six months to end-November 2018 when the market declined, it still outpaced the index’s gain over one year. VOF’s NAV total return has been moderately lower than the VN Index over nearly all periods shown in Exhibit 6, but its longer-term returns have been strong in absolute terms, with a 12.7% annualised sterling return over the 10 years to end-November 2018. Exhibit 7 illustrates VOF’s differentiated performance relative to the VN Index over three years, with the higher volatility of the index a key contributory factor. Over this period, VOF produced a 24.5% annualised NAV total return in sterling terms, broadly similar to the VN Index’s 25.8% annualised return.
|
Exhibit 5: Investment company performance to 30 November 2018 in sterling terms |
|||||||||
Share price, NAV and index total return performance, one-year rebased |
Share price, NAV and index total return performance (%) |
||||||||
|
|
||||||||
|
Source: Thomson Datastream, Edison Investment Research. Note: Three, five and 10-year performance figures annualised. |
|||||||||
|
Exhibit 6: Share price and NAV total return performance, relative to indices (%) |
|||||||||
|
One month |
Three months |
Six months |
One year |
Three years |
Five years |
10 years |
||
Price relative to Vietnam VN Index |
0.2 |
5.0 |
6.9 |
5.3 |
11.2 |
3.3 |
63.9 |
||
NAV relative to Vietnam VN Index |
(2.3) |
(0.3) |
(1.9) |
2.3 |
(3.2) |
(9.2) |
(8.7) |
||
Price relative to MSCI AC Asia ex-Japan |
(3.7) |
6.1 |
14.2 |
12.3 |
42.2 |
58.4 |
62.9 |
||
NAV relative to MSCI AC Asia ex-Japan |
(6.1) |
0.7 |
4.9 |
9.0 |
23.8 |
39.2 |
(9.3) |
||
Price relative to MSCI World |
0.2 |
4.1 |
2.2 |
1.1 |
44.5 |
40.0 |
66.3 |
||
NAV relative to MSCI World |
(2.3) |
(1.1) |
(6.2) |
(1.8) |
25.8 |
23.1 |
(7.4) |
||
Price relative to FTSE All-Share |
1.0 |
12.8 |
2.1 |
14.1 |
65.6 |
91.7 |
112.2 |
||
NAV relative to FTSE All-Share |
0.6 |
10.4 |
2.2 |
17.4 |
63.7 |
75.2 |
37.3 |
||
|
Source: Thomson Datastream, Edison Investment Research. Note: Data to end-November 2018. Geometric calculation. |
|||||||||
|
Exhibit 7: NAV total return performance relative to Vietnam VN Index over three years |
|||||||||
|
|||||||||
|
Source: Thomson Datastream, Edison Investment Research |
|||||||||
Discount: Longer-term narrowing trend
Since 2016, the board has taken a number of measures to support the narrowing of VOF’s share price discount to NAV. These include changing the company’s domicile from the Cayman Islands to Guernsey, moving its listing from AIM to the LSE’s Main Market, and transferring management of its assets to a regulated entity to make the shares eligible for investment by UCITS funds. VOF shares joined the FTSE All-Share index in June 2016 and the FTSE 250 index in March 2018, which is believed to have helped improve liquidity, alongside the ongoing share buyback programme. In July 2018, a reduced management and incentive fee structure was introduced.
|
Exhibit 8: Share price discount to NAV over five years (%) |
|
|
Source: Thomson Datastream, Edison Investment Research |
As shown in Exhibit 8, VOF’s share price discount to NAV has moved in a 13% to 26% range since November 2016 and has been less volatile in this period than over the prior three years. After briefly widening to 25.6% in October 2018, the discount has narrowed to 13.7% at 3 December 2018 (based on estimated NAV at 30 November 2018). This is lower than its 18.9%, 20.6% and 21.5% averages over one, three and five years, respectively, which highlight a long-term narrowing trend.
Capital structure and fees
As at 3 December 2018, VOF had 186.5m ordinary shares in issue, with a further 15.7m shares held in treasury. Under its ongoing share buyback programme, VOF repurchased 6.6m shares in FY18 (c 3.3% of shares in issue) and has repurchased 7.6m to date in FY19 at a cost of £25.2m (see Exhibit 1). Gearing is permitted up to 10% of total assets but none is employed at a corporate level, although some underlying investments use leverage.
The board has agreed reduced investment management and incentive fees payable to VinaCapital, effective from 1 July 2018. Replacing the previous 1.50% annual fee rate, a tiered management fee structure has been introduced, with the following annual rates applied to net assets: 1.50% up to US$500m, then 1.25% up to US$1.0bn, 1.00% up to US$1.5bn, 0.75% up to US$2.0bn, and 0.50% thereafter. The incentive fee has been reduced from 15.0% to 12.5% of any increase in NAV above an 8% per annum hurdle rate, with the cap on incentive fees paid out in any year remaining at 1.5% of average net assets. Excess fees are still carried forward, but can be clawed back if NAV declines after the year end. A further condition is that the investment manager uses 25% of any incentive fee paid to buy VOF shares via open market purchases, subject to a minimum holding period.
The new fee structure recognises that extensive resources are required to manage the fund, with the majority of VOF’s new investments entailing a private equity-like approach. The board believes that these changes will deliver significant cost savings, while retaining a strong incentive for the manager to deliver returns to shareholders. The FY18 ongoing charge was 1.8% (3.9% including performance fees), which compares with 1.9% (4.6% including performance fees) for FY17.
At the AGM on 10 December 2018, VOF will hold its five-yearly discontinuation vote, whereby the company will continue in operation unless more than 75% of voting shareholders elect in favour of discontinuation. This means shareholders who wish the company to continue should vote against the resolution. In light of prospective investment opportunities and the capability of the manager, the directors unanimously believe that VOF should continue in operation. The board has therefore recommended that shareholders vote against the discontinuation resolution at the AGM.
Dividend policy and record
VOF’s board started a dividend programme in 2017, intending to declare semi-annual dividends, each equivalent to c 1% of VOF’s prevailing NAV per share. Interim and full-year dividends of 4.8 US cents were declared in relation to FY17, with the 9.6 US cents total dividend equating to c 2% of VOF’s year-end (30 June 2017) NAV per share. In respect of FY18, an interim dividend of 5.5 US cents per share was paid in April 2018, and a full-year dividend of 5.5 US cents per share has been declared, for payment on 30 November 2018. In US dollar terms, the total FY18 dividend was 14.6% higher than the prior year, reflecting the strong NAV growth in the first half of the year, while NAV held fairly steady in the second half. The 4.25p sterling value of the second FY18 dividend is c 9% higher than the 3.90p first dividend payment, as sterling has declined versus the US dollar (from c US$1.41 to c US$1.29) since April 2018. The 8.15p FY18 total dividend equates to a dividend yield of c 2.4% based on the current share price.
Peer group comparison
Exhibit 9 shows a comparison of funds in the AIC Country Specialists – Asia Pacific sector with market caps over £100m. There are two other Vietnam specialist funds, which arguably provide a more relevant subgroup for comparison with VOF, as variations across the wider peer group largely reflect performance differences between stock markets across the Asia Pacific region. VOF’s NAV total return leads the peer group over one year and is clearly ahead of the average over three and five years, but trails the peer group over 10 years – a period that includes a strong rebound in listed equity markets following the 2008 global financial crisis. Within the Vietnam funds, VOF’s NAV total return is above average over one and three years, while lower than average over five and 10 years.
Exhibit 9: AIC Country Specialists – Asia Pacific selected peer group as at 3 December 2018 in sterling terms*
% unless stated |
Market cap £m |
NAV TR |
NAV TR |
NAV TR |
NAV TR |
Discount (cum-fair) |
Ongoing charge |
Perf. |
Net gearing |
Dividend yield |
VinaCapital Vietnam Opportunity Fund |
636.7 |
4.9 |
92.8 |
124.4 |
231.2 |
(13.7) |
1.8 |
Yes |
100 |
2.4 |
Aberdeen New India |
262.3 |
4.4 |
55.9 |
125.5 |
327.8 |
(16.0) |
1.2 |
No |
104 |
0.0 |
Fidelity China Special Situations |
1,134.9 |
(12.2) |
47.1 |
110.3 |
|
(12.3) |
1.1 |
No |
125 |
1.7 |
JPMorgan Chinese |
186.1 |
(16.4) |
47.3 |
62.2 |
253.0 |
(12.7) |
1.4 |
No |
121 |
0.6 |
JPMorgan Indian |
713.2 |
(3.1) |
43.5 |
109.9 |
246.2 |
(14.6) |
1.2 |
No |
102 |
0.0 |
Vietnam Enterprise Investments |
1,029.8 |
1.2 |
114.3 |
170.6 |
235.4 |
(7.1) |
2.2 |
No |
106 |
0.0 |
VietNam Holding |
127.4 |
(1.5) |
50.0 |
109.0 |
252.9 |
(16.3) |
2.2 |
Yes |
100 |
0.0 |
Weiss Korea Opportunity |
125.7 |
(17.1) |
15.4 |
51.5 |
|
(7.1) |
1.9 |
No |
100 |
2.3 |
Average |
527.0 |
(5.0) |
58.3 |
107.9 |
257.8 |
(12.5) |
1.6 |
107 |
1.2 |
|
Rank in peer group |
4 |
1 |
2 |
3 |
6 |
5 |
4 |
6= |
1 |
Source: Morningstar, Edison Investment Research. Note: *Performance to end-November 2018. TR=total return. Net gearing is total assets less cash and equivalents as a percentage of net assets (100 = ungeared).
In spite of its relatively strong recent performance and offering the highest yield of the four dividend-paying funds in the group, VOF’s share price discount to NAV is wider than the peer group average. Although VOF’s ongoing charge is above average and it is one of only two funds that charge a performance fee, its charges appear competitive within the Vietnam subgroup of funds. Additionally, new fee arrangements took effect on 1 July 2018, which include a lower tiered management fee and a reduced performance fee. VOF has no corporate-level gearing, similar to three of its peers.
The board
Julian Healy’s appointment in July 2018 enlarged VOF’s board to five independent non-executive directors, a number considered appropriate for a company of VOF’s size. The other directors are Steven Bates (appointed in February 2013), who has served as chairman since May 2013, Thuy Bich Dam (appointed in March 2014), Huw Evans (appointed in May 2016) and Martin Adams (appointed in February 2013), who intends to retire from the board at the December 2018 AGM. Further board changes are expected in due course, but the increase in the number of directors takes VOF close to its aggregate board remuneration cap. Shareholders will therefore be asked to approve an increase in the cap from US$0.50m to US$0.65m at 2018 AGM. The board notes that it is not proposing to increase the fees paid to individual directors at this time.
|
|
Investment Companies
Research: Consumer
Treatt has reported yet another set of strong results in FY18. The company remains in the sweet spot of current consumer trends, with ingredients that help to deliver better-for-you products with clean labels and without compromising on taste. The US expansion is on track and on budget, and will be fully operational in H119. The UK relocation is progressing well, although it is more complex and the timetable has slipped by about six months. FY19 has started well, and at this stage we leave our estimates broadly unchanged. Our DCF-derived fair value remains 510p.