Last close As at 05/08/2026
—
— 0.00 (0.00%)
Market capitalisation
—
Research: Investment Companies
Fidelity China Special Situations (FCSS) provides exposure to a diversified, actively managed portfolio of Chinese equities. The manager takes a bottom-up approach to stock selection, focusing on the faster-growing consumer-orientated sectors of China’s economy. FCSS’s NAV returns have been strong over the last two years, although modestly lagging its MSCI China index benchmark. This is attributed to FCSS’s tilt to small- and mid-cap stocks, which underperformed large-caps, partly due to passive capital flows into index funds. Over five years, FCSS has significantly outperformed the benchmark, as well as its open- and closed-ended peers. A new variable management fee structure, with a lower base level and no performance fee, will take effect from July 2018.
Written by
Fidelity China Special Situations |
Focused on China’s domestic opportunity |
Investment trusts |
15 June 2018 |
Share price/discount performance
Three-year performance vs index
Gearing
Analysts
|
|||||||||||||||||||||||||||||||||||||||||||||||||||||||||||||||||||||||||||||||||||||||
Fidelity China Special Situations (FCSS) provides exposure to a diversified, actively managed portfolio of Chinese equities. The manager takes a bottom-up approach to stock selection, focusing on the faster-growing consumer-orientated sectors of China’s economy. FCSS’s NAV returns have been strong over the last two years, although modestly lagging its MSCI China index benchmark. This is attributed to FCSS’s tilt to small- and mid-cap stocks, which underperformed large-caps, partly due to passive capital flows into index funds. Over five years, FCSS has significantly outperformed the benchmark, as well as its open- and closed-ended peers. A new variable management fee structure, with a lower base level and no performance fee, will take effect from July 2018.
12 months ending |
Share price |
NAV |
MSCI China |
MSCI China Small Cap (%) |
MSCI World |
FTSE All-Share (%) |
31/05/14 |
8.6 |
12.6 |
(5.4) |
(6.8) |
8.0 |
8.9 |
31/05/15 |
69.9 |
78.9 |
50.1 |
62.3 |
16.8 |
7.5 |
31/05/16 |
(19.1) |
(16.4) |
(24.8) |
(32.9) |
1.3 |
(6.3) |
31/05/17 |
50.6 |
40.5 |
47.5 |
26.5 |
32.0 |
24.5 |
31/05/18 |
28.3 |
30.8 |
27.2 |
23.1 |
8.8 |
6.5 |
Source: Thomson Datastream. Note: All % on a total return basis in GBP.
Investment strategy: Focused, bottom-up approach
FCSS maintains a diversified portfolio of 130–140 holdings, with no restrictions over sector weightings. The manager focuses on structurally faster-growing areas of the economy, targeting companies with robust cash flows and strong management. Detailed company research is conducted by Fidelity’s extensive analyst team. Risk management is a priority, making site visits and company meetings an essential part of the investment process. There is a small- and mid-cap bias, as these stocks tend to be under-researched and can often provide better opportunities. Futures, options and contracts for difference (CFDs) are used to add gearing, as well as to take short positions. Limited to 10%, unlisted securities currently represent c 5% of the portfolio.
Market outlook: Superior growth and lower valuations
Strong corporate earnings growth has driven Chinese market strength over the last two years, leaving its forward P/E multiple at a small premium to emerging markets, but at a meaningful discount to developed markets. IMF projections for 6.1% pa medium-term Chinese GDP growth, versus 4.1% pa for other emerging markets and 1.9% pa for advanced economies, underpin corporate earnings growth prospects. This supports a positive market outlook alongside relatively attractive valuations, with the Chinese market trading on a 12.5x forward P/E multiple compared to 11.6x for emerging markets and 15.4x for developed markets.
Valuation: Broadly stable discount; growing dividend
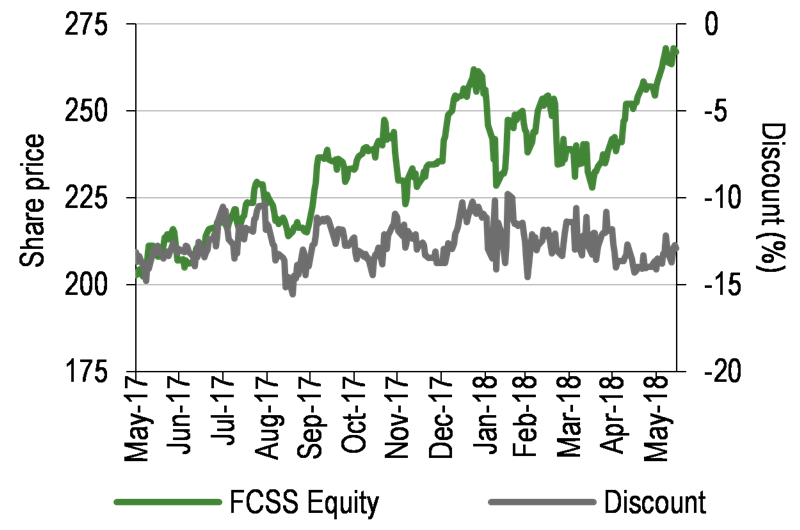
FCSS’s share price discount to NAV including income has broadly stayed in a 10% to 15% range since October 2016. The current 12.9% discount compares with its 12.6%, 14.7% and 13.0% averages over one, three and five years, respectively. A 3.50p dividend has been proposed for FY18, equating to a 40.0% increase on FY17.
Exhibit 1: Trust at a glance
Investment objective and fund background |
Recent developments |
||||||||||||||||||||||||||||||||||||||||||||||||||||||||||||||||||||||||||||||||||||||||||||||
Fidelity China Special Situations aims to achieve long-term capital growth from an actively managed portfolio made up primarily of securities issued by companies listed in China or Hong Kong and Chinese companies listed elsewhere. It may also invest in listed companies with significant interests in China and Hong Kong. Futures, options and CFDs are used to provide gearing, as well as to take short positions. |
■ 12 June 2018: New variable 0.70-1.10% management fee, replacing fixed management fee and performance fee structure, effective from 1 July 2018. ■ 12 June 2018: Full-year results to 31 March 2018 – NAV TR +22.2% versus benchmark TR +23.8%; share price TR +23.6%. ■ 12 June 2018: 3.50p dividend recommended for FY18 versus 2.50p for FY17. ■ 31 December 2017: John Ford departed Fidelity, so will not seek reelection as an FCSS board director at the 2018 AGM. |
||||||||||||||||||||||||||||||||||||||||||||||||||||||||||||||||||||||||||||||||||||||||||||||
Forthcoming |
Capital structure |
Fund details |
|||||||||||||||||||||||||||||||||||||||||||||||||||||||||||||||||||||||||||||||||||||||||||||
AGM |
25 July 2018 |
Ongoing charges |
1.16% (FY17) |
Group |
Fidelity International |
||||||||||||||||||||||||||||||||||||||||||||||||||||||||||||||||||||||||||||||||||||||||||
Interim results |
November 2018 |
Net market gearing* |
18.5% |
Manager |
Dale Nicholls |
||||||||||||||||||||||||||||||||||||||||||||||||||||||||||||||||||||||||||||||||||||||||||
Year end |
31 March |
Annual mgmt fee |
0.90% of net assets |
Address |
Beech Gate, Millfield Lane, Lower Kingswood, Tadworth, KT20 6RP |
||||||||||||||||||||||||||||||||||||||||||||||||||||||||||||||||||||||||||||||||||||||||||
Dividend paid |
30 July 2018 |
Performance fee |
±0.20% variation fee |
||||||||||||||||||||||||||||||||||||||||||||||||||||||||||||||||||||||||||||||||||||||||||||
Launch date |
April 2010 |
Trust life |
Indefinite |
Phone |
0800 41 41 10 |
||||||||||||||||||||||||||||||||||||||||||||||||||||||||||||||||||||||||||||||||||||||||||
Continuation vote |
No |
Loan facilities |
US$150m revolving |
Website |
|||||||||||||||||||||||||||||||||||||||||||||||||||||||||||||||||||||||||||||||||||||||||||
Dividend policy and history (financial years) |
Share buyback policy and history (financial years) |
||||||||||||||||||||||||||||||||||||||||||||||||||||||||||||||||||||||||||||||||||||||||||||||
Although focused on capital growth, as an investment trust FCSS pays out at least 85% of income received as an annual dividend. |
FCSS has annually renewed authority to buy back up 14.99% of its shares at a discount to NAV and allot up to 10% of issued capital at a premium to NAV. There is no rigid discount control mechanism. |
||||||||||||||||||||||||||||||||||||||||||||||||||||||||||||||||||||||||||||||||||||||||||||||
|
|
||||||||||||||||||||||||||||||||||||||||||||||||||||||||||||||||||||||||||||||||||||||||||||||
Shareholder base (as at 13 June 2018) |
Portfolio exposure by market cap (as at 30 April 2018) |
||||||||||||||||||||||||||||||||||||||||||||||||||||||||||||||||||||||||||||||||||||||||||||||
|
|
||||||||||||||||||||||||||||||||||||||||||||||||||||||||||||||||||||||||||||||||||||||||||||||
Top 10 holdings (as at 30 April 2018) |
|||||||||||||||||||||||||||||||||||||||||||||||||||||||||||||||||||||||||||||||||||||||||||||||
|
|||||||||||||||||||||||||||||||||||||||||||||||||||||||||||||||||||||||||||||||||||||||||||||||
Source: Fidelity China Special Situations, Edison Investment Research, Bloomberg, Thomson, Morningstar. Note: *Gearing net of short positions. **N/A where not in April 2017 top 10.
Market outlook: Superior growth underpins prospects
As illustrated by the chart in Exhibit 2, in spite of the major market correction during 2015, the Chinese stock market, represented by the MSCI China index, has broadly matched the performance of world markets and outpaced the UK market over the last three years. While market strength has pushed Chinese equity valuation multiples higher, this effect has been tempered by strong underlying corporate earnings growth. As shown in the table in Exhibit 2, the Chinese market forward P/E multiple is at a small premium to emerging markets, but at a meaningful discount to developed markets, with no account taken of China’s superior growth prospects.
|
Exhibit 2: Market performance and valuation |
|||||||||||||||||||||||||
Chinese market performance vs World and UK indices (£ terms) |
Chinese market valuation metrics vs World and UK indices |
||||||||||||||||||||||||
|
|
||||||||||||||||||||||||
|
Source: Thomson Datastream, Edison Investment Research, MSCI. Note: Valuation data as at end-May 2018. |
|||||||||||||||||||||||||
The latest IMF projections are for 6.1% annualised Chinese GDP growth from 2018 to 2023, compared with 4.1% for other emerging market economies and 1.9% for advanced economies. China’s superior economic growth outlook underpins medium-term corporate earnings prospects, which contributes to a positive market outlook. In addition, with the Chinese market forward P/E multiple appearing relatively moderate in comparison with other markets, there appears to be scope for re-rating to push the market higher, in combination with strong earnings growth.
Fund profile: Actively managed Chinese equity portfolio
Launched in April 2010, FCSS is an LSE-listed investment trust with the objective to generate long-term capital growth from an actively managed portfolio of Chinese equities. The portfolio primarily comprises companies listed in China or Hong Kong and Chinese companies listed on other recognised exchanges, but may also include non-Chinese listed companies with significant operations in China and Hong Kong. FCSS’s performance benchmark is the MSCI China index (sterling adjusted), but sector exposures are not constrained by index weightings. Fidelity International is FCSS’s investment manager, and Hong Kong-based Dale Nicholls has acted as portfolio manager since April 2014. Nicholls has 23 years’ investment experience and has managed the open-ended Fidelity Funds Pacific Fund, which has significant exposure to China, since 2003.
FCSS’s portfolio typically comprises 130-140 stocks, with CFDs used to add gearing as well as to take short positions on individual stocks. CFDs are also used to hedge market exposure, in addition to index futures and options. Individual holdings are restricted to 15% of the portfolio at the time of acquisition, and a 10% limit applies to the total value of unlisted investments. Total short exposure is restricted to 15% of gross assets. Borrowing is permitted up to 25% of net assets, with total gearing from borrowings and derivatives restricted to 30% of net assets. China ‘A’ shares are purchased using Fidelity’s Qualified Foreign Institutional Investor (QFII) licence, as well as via brokers who hold a QFII.
The fund manager: Dale Nicholls
The manager’s view: Limited exposure to global trade sanctions
Nicholls notes that overall Chinese stock market valuation multiples have moved higher than for the broader Asia ex-Japan region over the last year. However, he believes that valuations are attractive relative to world markets, given China’s superior growth prospects. He also highlights that gradually increasing index inclusion is likely to underpin capital flows into Shanghai-listed ‘A’ shares over the medium term. While market volatility has increased in 2018, Nicholls remains broadly positive on the market outlook and has started to increase net gearing in the last few months to invest in areas of the market he views as unduly punished in the February 2018 market correction. This follows two years during which he steadily trimmed FCSS’s net gearing, which declined from a peak of 27.1% at end-March 2016 to 15.4% at end-February 2018.
In Nicholls’s view, FCSS is relatively insulated from the risks associated with global trade sanctions due to its focus on consumer and technology sectors, with low exposure to exporters. While credit growth is still strong in China, Nicholls observes that the rate of growth is slowing, with tighter regulations on shadow banking being enforced, and non-performing loan formation is improving. However, he still sees issues remaining for banks and does not hold any in the portfolio.
Nicholls still sees consumption growing faster than overall GDP, and maintains his strong focus on the information technology and consumer discretionary sectors. He notes that Chinese disposable income continues to rise strongly and emphasises consumers’ greater focus on ‘experiences’, such as travel. This theme is reflected in a number of portfolio holdings, including China Lodging, China’s leading budget hotel operator, and Galaxy Entertainment, the largest mass gaming operator in Macau (which saw 2.8m Chinese visitors in 2017, with considerable scope seen for visitor growth). Other larger portfolio holdings exposed to travel growth are online travel services provider Ctrip, luxury hotel group Shangri-La Asia, and airport operator Shanghai International Airport.
Among consumer stocks, Nicholls highlights home appliance manufacturer Midea, which has a strong record of product innovation in small appliances, such as kettles and rice cookers, with management maintaining a focus on cost control alongside steady sales growth. He remains committed to top holdings Tencent and Alibaba, believing that the market is undervaluing their growth prospects, and explains that FCSS’s underweight positions reflect the number of other attractive opportunities in the market. He is still confident in the outlook for FCSS’s four existing unlisted holdings, Xiaoju Kuaizhi (Didi Chuxing), China Internet Plus Holdings (formerly Meituan), Shanghai Yiguo E-commerce and Aurora Mobile (Jiguang), and has recently added two new positions (undisclosed), taking unlisted investments to c 5% of the portfolio.
Asset allocation
Investment process: Fundamentally-driven, bottom-up selection
The manager takes a bottom-up approach to portfolio construction, with no top-down restrictions on sector allocations. The focus is on industries with structural growth prospects above that of the broader Chinese economy, with the manager seeking to invest in highly cash generative companies run by capable management teams. Supported by Fidelity’s team of 23 analysts researching Chinese equities (based in Hong Kong, Singapore and Shanghai), the portfolio manager analyses companies in detail prior to investment, and company meetings are a key element in assessing prospective new investments, as well as monitoring existing holdings. The portfolio has a bias to small- and mid-cap stocks, where the manager finds more companies with market valuations that do not reflect their long-term growth prospects. Investing in small-cap stocks can present higher risks, so risk management is an important part of the process.
Current portfolio positioning
FCSS’s portfolio comprises 130-140 holdings but is relatively concentrated in the top 10 positions, which represented 38.9% at end-April 2018, up from 36.9% a year earlier, with FCSS’s holding in Tencent increasing from 10.5% to 12.8%, while remaining an underweight position (see Exhibit 1). The manager’s focus on faster growing areas of the Chinese economy, largely driven by rising domestic consumption and ongoing structural reforms, is reflected in FCSS’s sector exposures, which are highly differentiated from the benchmark index (see Exhibit 3). Information technology is now the portfolio’s largest sector exposure, although this sector remains one of the trust’s most significant underweight positions. The largest underweight is to financials, where FCSS does not hold any bank stocks, although exposure to this sector has seen the largest increase over the year. The portfolio’s most significant overweights are to consumer discretionary and industrials, although these sectors have seen the largest declines in exposure over the year.
Exhibit 3: Portfolio sector exposure vs benchmark (% unless stated)
Portfolio end- April 2018 |
Portfolio end- April 2017 |
Change (pp) |
Index weight |
Active weight vs index (pp) |
Trust weight/ index weight (x) |
|
Information technology |
31.8 |
28.0 |
3.7 |
39.7 |
(7.9) |
0.8 |
Consumer discretionary |
24.4 |
28.4 |
(4.0) |
8.8 |
15.5 |
2.8 |
Financials |
12.6 |
7.8 |
4.8 |
23.5 |
(10.9) |
0.5 |
Industrials |
11.4 |
13.9 |
(2.4) |
3.9 |
7.5 |
2.9 |
Healthcare |
6.8 |
4.8 |
2.0 |
2.6 |
4.2 |
2.6 |
Consumer staples |
6.0 |
7.1 |
(1.1) |
2.1 |
3.9 |
2.8 |
Energy |
2.6 |
3.0 |
(0.4) |
5.2 |
(2.6) |
0.5 |
Telecommunication services |
1.7 |
1.7 |
0.0 |
4.6 |
(2.9) |
0.4 |
Real estate |
1.4 |
1.1 |
0.3 |
5.3 |
(3.9) |
0.3 |
Utilities |
0.9 |
2.1 |
(1.2) |
2.5 |
(1.7) |
0.3 |
Materials |
0.4 |
2.2 |
(1.8) |
1.7 |
(1.3) |
0.2 |
100.0 |
100.0 |
100.0 |
Source: Fidelity China Special Situations, Edison Investment Research. Note: Adjusted for gearing.
Performance: Ahead of benchmark over most periods
As shown in Exhibit 4, FCSS’s share price and NAV total returns have outperformed its MSCI China index benchmark over one, three and five years to end-May 2018, as well as since its inception in 2010. While affected by stock market volatility, FCSS delivered a strong one-year performance, with its 28.3% and 30.8% share price and NAV total returns both ahead of the 27.2% benchmark return. Since inception, which includes a period of weaker NAV performance (-32.1%) in 2011, FCSS has achieved a 15.4% pa NAV total return, compared with 9.2% pa for the MSCI China index.
|
Exhibit 4: Investment trust performance to 31 May 2018 |
||||||||
Price, NAV and benchmark total return performance, one-year rebased |
Price, NAV and benchmark total return performance (%) |
|||||||
|
|
|||||||
|
Source: Thomson Datastream, Edison Investment Research. Note: Three-year, five-year and SI (since inception) performance figures annualised. Inception date is 16 April 2010. |
||||||||
|
Exhibit 5: Share price and NAV total return performance, relative to indices (%) |
||||||||
|
One month |
Three months |
Six months |
One year |
Three years |
Five years |
Since inception |
|
Price relative to MSCI China |
0.7 |
3.1 |
2.6 |
0.9 |
10.8 |
44.1 |
34.1 |
|
NAV relative to MSCI China |
3.0 |
5.9 |
7.0 |
2.9 |
9.0 |
54.6 |
56.2 |
|
Price relative to MSCI World |
1.9 |
1.7 |
6.1 |
17.9 |
7.4 |
57.2 |
12.0 |
|
NAV relative to MSCI World |
4.1 |
4.5 |
10.7 |
20.2 |
5.6 |
68.6 |
30.5 |
|
Price relative to FTSE All-Share |
3.3 |
(2.1) |
3.3 |
20.5 |
25.8 |
98.5 |
44.1 |
|
NAV relative to FTSE All-Share |
5.6 |
0.5 |
7.8 |
22.8 |
23.7 |
112.9 |
67.8 |
|
|
Source: Thomson Datastream, Edison Investment Research. Note: Data to end-May 2018. Geometric calculation. Inception date is 16 April 2010. |
||||||||
As shown in Exhibit 5, FCSS’s share price and NAV total returns have outperformed both the MSCI World and FTSE All-Share indices over one, three and five years, and since the trust’s inception in April 2010, with a particularly strong relative performance over one year, largely reflecting the strength of Chinese equities relative to world markets over this period. Exhibit 6 shows FCSS’s substantial outperformance of the benchmark over five years, giving a longer-term context for the modest underperformance since May 2016.
|
Exhibit 6: NAV total return performance relative to benchmark over five years |
|
|
Source: Thomson Datastream, Edison Investment Research |
Discount: Moving in a stable range
As shown in Exhibit 7, after widening from c 5.0% in August 2013 to c 20% in early 2016, FCSS’s share price discount to NAV including income has recovered some ground, broadly moving within a 10% to 15% range since October 2016. The current 12.9% discount is similar to its 12.6% and 13.0% averages over one and five years, and narrower than its 14.7% average over three years. Since its launch in 2010, FCSS’s shares have traded between a 13.2% premium and a 23.4% discount, strongly influenced by swings in sentiment towards the fund and Chinese equities.
|
Exhibit 7: Share price discount to NAV (including income) over five years (%) |
|
|
Source: Thomson Datastream, Edison Investment Research |
Capital structure and fees
FCSS currently has 551.1m ordinary shares in issue, with a further 20.2m shares held in treasury, following the repurchase of 0.3m shares in May and June 2018. FCSS has annually renewed authority to buy back up 14.99% of its shares at a discount to NAV and allot up to 10% of issued capital at a premium to NAV, but there is no rigid discount control mechanism, and buybacks have been very modest in recent years (see Exhibit 1). FCSS has a fully-drawn US$150m three-year revolving credit facility, maturing in February 2020, which equates to c 7% gearing. Further gearing is achieved through long CFDs on a number of portfolio holdings. To a lesser extent, CFDs are also used to take short positions on individual stocks as well as to provide a market hedge, alongside index futures and options positions. Gross gearing is permitted up to 30% of net assets and FCSS had 28.1% gross gearing, with net gearing of 18.5% (net of short positions), at end-April 2018.
A new variable management fee has been agreed with investment manager Fidelity International, replacing the current 1.00% pa management fee and 15% performance fee structure. From 1 July 2018, FCSS will pay a reduced 0.90% pa management fee on net assets plus a ±0.20% variation fee, based on NAV per share performance relative to the benchmark index. This brings the range of potential fees payable down from 1.0-2.0% of net assets to 0.7-1.1%. In addition, the annual administration fee paid to the manager has been reduced from £0.6m to £0.1m from 1 April 2018. For FY17, ongoing charges were 1.16% of net assets. The FY18 ongoing charge has not yet been published, but we estimate that it will show a slight decline, on an equivalent calculation basis, with no performance fee payable. Performance was strong in absolute terms, but FCSS modestly underperformed the benchmark over the 12 months to end-March 2018.
From April 2017, management fees and finance costs have been allocated 75% to capital and 25% to revenue, compared with the previous 50:50 allocation. This change was made to reflect the historical capital and revenue contributions to total returns. While total returns are unaffected, the amount available for dividend distributions from revenue reserves is increased.
Dividend policy and record
FCSS has a capital growth objective, but pays an annual dividend in July/August each year. The dividend has been increased every year since FCSS’s inception (see Exhibit 1), compounding at a rate of c 28% pa over the last five years. A 3.50p dividend has been recommended for FY18, representing a 40.0% increase on FY17. The proposed 3.50p dividend is 1.09x covered by revenue earnings and equates to a 1.3% dividend yield, based on the current share price. After payment of this dividend, FCSS will retain accumulated revenue reserves equating to 2.06p per share, which could be used to smooth future dividend payouts.
Peer group comparison
Exhibit 8 shows a comparison of FCSS with other funds that have significant exposure to Chinese equities. JPMorgan Chinese is the only other AIC Country Specialists: Asia Pacific fund focused on China, so we show averages for the AIC Asia Pacific ex-Japan sector, which has 38% aggregate exposure to China & Greater China. Also included are IA China/Greater China open-ended funds larger than £500m with more than five years’ track record. FCSS’s NAV total return is the highest of all funds shown over five years, substantially outperforming both open- and closed-ended peer group averages. Although lower than JPMorgan Chinese over one and three years, FCSS’s NAV total return is ahead of the AIC Asia Pacific ex-Japan and the IA China/Greater China sector averages over both periods. FCSS’s ongoing charge is slightly higher than the AIC Asia Pacific ex-Japan sector average, but is one of the lowest among single country fund peers. Gearing is higher than average among closed-ended peers, but FCSS’s discount is one of the narrowest in the AIC Country Specialists: Asia Pacific sector. FCSS’s dividend yield is above average among single country fund peers, although lower than the AIC Asia Pacific ex-Japan sector average.
Exhibit 8: Selected peer group investing in Chinese equities as at 14 June 2018*
% unless stated |
Market cap/ fund size £m |
NAV TR |
NAV TR |
NAV TR |
Discount (ex-par) |
Ongoing charge |
Perf. fee |
Net gearing |
Dividend yield (%) |
Fidelity China Special Situations |
1,471.5 |
29.4 |
58.6 |
245.6 |
(12.6) |
1.16 |
Yes** |
124 |
1.3 |
JPMorgan Chinese |
234.1 |
35.3 |
66.6 |
148.5 |
(15.9) |
1.38 |
No |
115 |
0.5 |
Asia Pacific ex-Japan average |
384.9 |
9.2 |
52.2 |
78.7 |
(7.1) |
1.05 |
102 |
2.1 |
|
Open-ended funds |
|||||||||
Baring Hong Kong China |
1,445.2 |
21.5 |
38.3 |
108.4 |
1.70 |
No |
0.1 |
||
Fidelity China Focus |
3,510.5 |
20.0 |
42.9 |
137.5 |
1.93 |
No |
0.5 |
||
First State Greater China Growth |
510.9 |
24.2 |
55.9 |
104.6 |
1.84 |
No |
0.7 |
||
GAM Star China Equity |
716.8 |
21.7 |
29.6 |
112.7 |
1.10 |
No |
0.8 |
||
HSBC GIF Chinese Equity |
1,231.1 |
22.2 |
36.8 |
110.6 |
2.40 |
No |
|
||
Invesco PRC Equity |
699.2 |
24.1 |
46.0 |
103.9 |
2.22 |
No |
|
||
Janus Henderson China Opps |
1,392.9 |
23.7 |
66.1 |
150.9 |
1.72 |
No |
0.4 |
||
JPM Greater China |
506.8 |
24.5 |
54.6 |
119.4 |
1.82 |
No |
0.1 |
||
Schroder ISF Greater China |
838.3 |
20.4 |
60.6 |
138.6 |
1.86 |
No |
1.7 |
||
Open-ended funds average |
1,205.8 |
22.5 |
47.9 |
120.7 |
1.84 |
0.6 |
Source: Morningstar, Edison Investment Research. Note: *Performance data to 13 June 2018. **No performance fee from 1 July 2018. TR = total return. Net gearing is total assets less cash and equivalents as a percentage of net assets (100 = ungeared).
The board
FCSS’s board comprises six directors, five of whom are independent. Nicholas Bull (appointed director February 2010, chairman July 2016) was a director of De Vere hotels group from 2010 to 2015, previously working for 30 years in corporate finance. Senior independent director Elisabeth Scott (appointed November 2011) worked in asset management in Hong Kong from 1992 to 2008, and is chairman of India Capital Growth Fund and a director of Pacific Horizon Investment Trust, Dunedin Income Growth Investment Trust and Allianz Technology Trust. David Causer (appointed February 2010) has held a number of senior positions within financial services organisations, including Mercury Asset Management Group and Merrill Lynch Investment Managers. Peter Pleydell-Bouverie (appointed February 2010) has over 30 years’ investment experience, particularly in the Far East and emerging markets. Vera Hong Wei (appointed March 2016) has over 18 years’ experience in the Chinese financial industry spanning central bank, commercial bank and asset management sectors. Non-independent director John Ford (appointed July 2016) acted as Fidelity International’s global CIO, fixed income, solutions and real estate until 31 December 2017. Following his departure from Fidelity, he will not be standing for re-election at the July 2018 AGM.
|
|
Investment Companies
Aladdin Blockchain Technologies (Aladdin) is an early-stage software company seeking to use big data, blockchain, artificial intelligence (AI) and machine-learning technologies to improve preventative medicine and the efficiency of delivering healthcare. Although the long-term goal is to be a big data analytics play, the shorter-term focus is on developing applications to build a healthcare ecosystem in order to gain access to patient data. Aladdin’s first operations are in China, it has just announced entry into the Indian healthcare market and it plans to expand into other Asian markets.