Last close As at 05/08/2026
—
— 0.00 (0.00%)
Market capitalisation
—
Research: Investment Companies
Fidelity European Values
Written by
Fidelity European Values |
Finding opportunities among large caps |
Investment trusts |
21 June 2016 |
Share price/discount performance
Three-year cumulative perf. Graph
Gearing
Analysts
|
|||||||||||||||||||||||||||||||||||||||||||||||||||||||||||||||||||||||||||||||||||||
Fidelity European Values (FEV) aims to achieve long-term capital growth through investing primarily in continental European equities. The manager follows a consistent bottom-up approach, seeking to identify companies able to grow dividends over a three- to five-year horizon. FEV’s NAV total return performance has been ahead of its FTSE World Europe ex-UK benchmark over three, five and 10 years, although investments in out-of-favour areas of the market have given the portfolio a slightly contrarian large-cap bias relative to peers, which has been unhelpful during recent small-cap outperformance. The portfolio’s historically high relative dividend yield and superior growth prospects are seen by the manager as a positive indicator for future performance.
12 months ending |
Total share price return (%) |
Total NAV return (%) |
FTSE World Eur ex-UK (%) |
MSCI Europe (%) |
MSCI World |
31/05/12 |
(18.1) |
(17.0) |
(24.2) |
(18.3) |
(4.3) |
31/05/13 |
50.5 |
42.4 |
43.3 |
37.7 |
30.5 |
31/05/14 |
8.0 |
7.6 |
13.4 |
11.9 |
8.0 |
31/05/15 |
20.4 |
12.8 |
4.7 |
5.2 |
16.8 |
31/05/16 |
(6.8) |
(3.8) |
(3.7) |
(5.0) |
1.3 |
Source: Thomson Datastream. Note: Total returns in sterling terms.
Investment strategy: Focused on dividend growers
The manager employs a fundamental bottom-up approach, seeking to identify cash-generative companies able to deliver above-average dividend growth over a three- to five-year horizon. Focusing on structural growth prospects and balance sheet strength, stock selection is guided by comparing market values to an assessment of fair value. Unconstrained by top-down allocations, the manager aims to hold a well-diversified portfolio with sector weightings within five percentage points of the benchmark. Although a total shareholder return (TSR) ranking analysis is used to indicate opportunities for portfolio rebalancing, turnover remains low.
Market outlook: Longer-term opportunities
European economic growth expectations remain modest, but European market valuations do not appear overstretched relative to other developed markets, and further quantitative easing by the ECB may act to support market valuation levels. While economic uncertainties including the UK’s EU referendum could lead to periods of elevated market volatility, these may create opportunities for longer-term investors. In this low-growth and uncertain economic environment, a fund with a slightly contrarian approach, selecting stocks across European markets based on medium- to long-term growth prospects may appeal to investors.
Valuation: Scope for discount to narrow
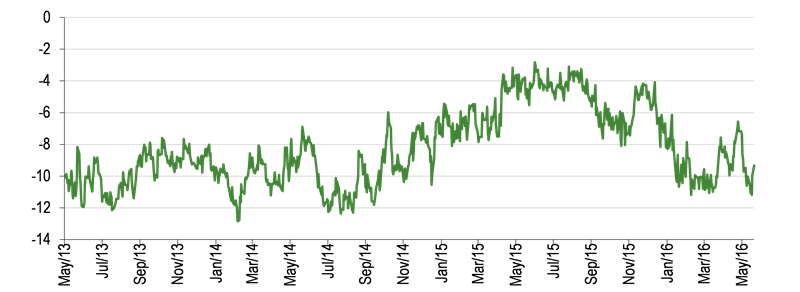
Concerns over the outcome of the UK’s EU referendum appear to have contributed to the recent widening of FEV’s share price discount to NAV including income towards the wider end of its 2.8% to 12.9% three-year range, suggesting significant scope for it to narrow when market sentiment improves.
Fidelity European Values is a research client of Edison Investment Research Limited
Exhibit 1: Trust at a glance
Investment objective and fund background |
Recent developments |
|||||||||||||||||||||||||||||||||||||||||||||||||||||||||||||||||||||||||||||||||||||||||||||||||||||||||||||
FEV’s investment objective is to achieve long-term capital growth from a portfolio of primarily continental European securities. Permitted exposure to stocks listed outside continental Europe of 20% gives the manager investment flexibility. FEV’s performance benchmark is the FTSE World Europe ex-UK Index. |
■ 12 May 2016: Vivian Bazalgette took over as chairman from Humphrey van der Klugt, who stepped down from the board. ■ 14 March 2016: Full-year results to 31 December 2015 – NAV total return +6.9% versus benchmark total return +5.3%. ■ 14 March 2016: 3.33p per share final dividend recommended. |
|||||||||||||||||||||||||||||||||||||||||||||||||||||||||||||||||||||||||||||||||||||||||||||||||||||||||||||
Forthcoming |
Capital structure |
Fund details |
||||||||||||||||||||||||||||||||||||||||||||||||||||||||||||||||||||||||||||||||||||||||||||||||||||||||||||
AGM |
May 2017 |
Ongoing charges |
0.94% |
Group |
FIL Investments International |
|||||||||||||||||||||||||||||||||||||||||||||||||||||||||||||||||||||||||||||||||||||||||||||||||||||||||
Interim results |
July 2016 |
Gearing |
3.1% (through CFDs) |
Managers |
Sam Morse |
|||||||||||||||||||||||||||||||||||||||||||||||||||||||||||||||||||||||||||||||||||||||||||||||||||||||||
Year end |
31 December |
Annual mgmt fee |
0.85% of net assets |
Address |
Beech Gate, Millfield Lane, Lower Kingswood, Tadworth, KT20 6RP |
|||||||||||||||||||||||||||||||||||||||||||||||||||||||||||||||||||||||||||||||||||||||||||||||||||||||||
Dividend paid |
May |
Performance fee |
None |
|||||||||||||||||||||||||||||||||||||||||||||||||||||||||||||||||||||||||||||||||||||||||||||||||||||||||||
Launch date |
November 1991 |
Trust life |
Indefinite |
Phone |
+44 (0)800 41 41 10 |
|||||||||||||||||||||||||||||||||||||||||||||||||||||||||||||||||||||||||||||||||||||||||||||||||||||||||
Continuation vote |
Two-yearly (next 2017) |
Loan facilities |
None – CFDs used |
Website |
||||||||||||||||||||||||||||||||||||||||||||||||||||||||||||||||||||||||||||||||||||||||||||||||||||||||||
Dividend policy and history |
Share buyback policy and history |
|||||||||||||||||||||||||||||||||||||||||||||||||||||||||||||||||||||||||||||||||||||||||||||||||||||||||||||
FEV pays an annual dividend in May in respect of the previous financial year. Revenue earnings are distributed in full. |
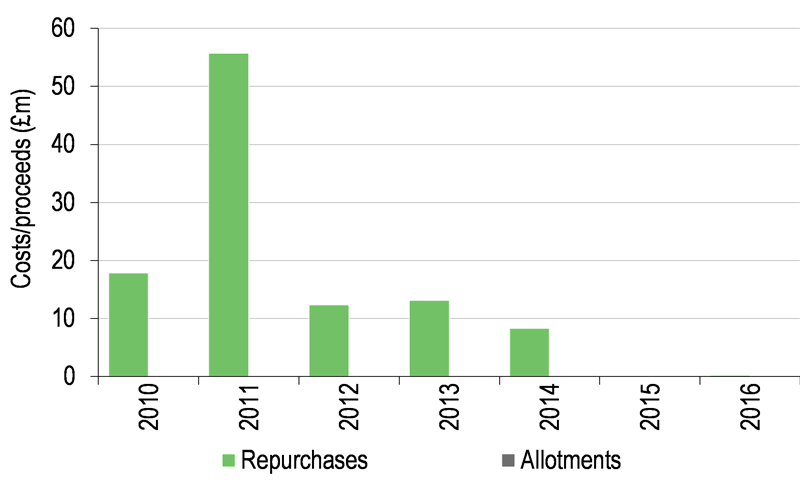
FEV has authority (renewed annually) to purchase up to 14.99% and allot up to 5% of issued share capital. |
|||||||||||||||||||||||||||||||||||||||||||||||||||||||||||||||||||||||||||||||||||||||||||||||||||||||||||||
|
|
|||||||||||||||||||||||||||||||||||||||||||||||||||||||||||||||||||||||||||||||||||||||||||||||||||||||||||||
Shareholder base (as at 20 June 2016) |
Portfolio exposure by market cap (as at 31 May 2016) |
|||||||||||||||||||||||||||||||||||||||||||||||||||||||||||||||||||||||||||||||||||||||||||||||||||||||||||||
|
|
|||||||||||||||||||||||||||||||||||||||||||||||||||||||||||||||||||||||||||||||||||||||||||||||||||||||||||||
Top 10 holdings (as at 31 May 2016) |
||||||||||||||||||||||||||||||||||||||||||||||||||||||||||||||||||||||||||||||||||||||||||||||||||||||||||||||
|
||||||||||||||||||||||||||||||||||||||||||||||||||||||||||||||||||||||||||||||||||||||||||||||||||||||||||||||
Source: Fidelity European Values, Edison Investment Research, Morningstar, Bloomberg. Note: *N/A where not in May 2015 top 10.
Market outlook: Uncertainties creating opportunities
European stockmarket valuations peaked in mid-2015, with the Datastream (DS) EU market forward P/E multiple reaching 16.5x, placing it at a 3% premium to the world market (see Exhibit 2 left-hand chart). Arguably due to a weaker economic growth outlook, European markets have subsequently de-rated faster than other markets, with the DS EU market forward P/E multiple declining to 13.8x, representing a 5% discount to the world market and an 18% discount to the US market, a similar level to its 10-year average 16% discount. This suggests that, while European market valuations remain higher than average levels over the last 10 years, they do not appear overstretched relative to other developed markets.
|
Exhibit 2: European market valuation and economic sentiment |
|
DS EU market forward P/E multiple vs World and US over 10 years |
European economic sentiment indicator over 30 years |
|
|
|
Source: Thomson Datastream, Eurostat, Edison Investment Research |
|
European economic growth expectations remain modest, with IMF GDP growth projections of 1.5% and 1.6% for 2016 and 2017, affected by low investment, high unemployment and weak corporate balance sheets. However, after declining at the start of the year, the European economic sentiment indicator has moved higher in the last two months (Exhibit 2 right-hand chart), which may signal an improving outlook. Global economic uncertainties including the UK’s EU referendum, the timing of US interest rate hikes and the pace of growth in China could lead to periods of elevated market volatility, but there appears scope for European markets to move higher and further quantitative easing by the ECB could support higher market valuation levels. In this low-growth and uncertain economic environment, a largely unconstrained fund with a slightly contrarian approach, selecting stocks across European markets based on longer-term growth prospects may appeal to investors.
Fund profile: Continental European focus
FEV is an LSE-listed investment trust, launched in November 1991, with the objective of achieving long-term capital growth from an actively managed portfolio of primarily continental European securities. Performance is benchmarked against the FTSE World Europe ex-UK Index, but bottom-up stock selection guides portfolio construction and sector and geographic allocations are not set by reference to the benchmark index. The portfolio typically comprises 55 to 60 investments and the investment approach is to focus on companies believed to be capable of delivering consistent dividend growth over a three- to five-year time horizon. FEV has been managed by Fidelity since launch, with Sam Morse acting as portfolio manager since January 2011.
Exposure to companies listed outside continental Europe is permitted up to 20%, which has given the manager flexibility to invest in UK stocks. FEV’s investment policy also permits derivatives to be used, allowing investment returns to be protected or enhanced. While this gives the manager scope to take short positions in stocks, these types of investment are not a current feature of the portfolio.
The fund manager: Sam Morse
The manager’s view: Large-cap valuations relatively attractive
Sam Morse sees the relatively elevated valuations of European stock markets as a feature that is likely to constrain overall market progression, with a general lack of earnings momentum across the region also contributing to a subdued broader market outlook. However, Morse sees pockets of opportunity, particularly in out-of-favour segments of the market such as companies exposed to commodities and emerging markets. He has been identifying attractive stock-picking opportunities among larger companies where valuations look appealing relative to small and medium-sized companies, and this has given FEV a slightly contrarian large-cap bias compared with its peers. While modestly underweight in large caps (market cap > £10bn) versus its benchmark, FEV has overweight exposure to mega caps (market cap > £100bn).
The manager highlights that FEV’s portfolio remains focused on attractively valued companies able to grow dividends consistently, taking into account the current uncertain and low-growth economic environment. As a positive indicator for FEV, he points to the portfolio’s dividend yield relative to the MSCI Europe ex-UK Index standing at 91% (historical range: 70% to 95%), suggesting that market valuations may not fully reflect the superior dividend growth prospects of portfolio companies.
DNB is a portfolio holding that the manager sees as a good example of the contrarian opportunities on offer. DNB has been out of favour due to its relatively large exposure to the oil and gas sector. However, as the leading Norwegian bank with a c 35% market share, proven lending expertise, a cash-generative business, a low c 7% leverage ratio and an attractive c 5% dividend yield, it ranks highly on the manager’s investment criteria. The portfolio also has direct oil and gas sector exposure through Total and Royal Dutch Shell, seen as financially sound companies with unappreciated long-term earnings and dividend growth prospects, trading at attractive valuations.
While portfolio turnover remains relatively low at c 25% pa, FEV’s UK exposure was increased through the switch of part of the Shell holding to the UK listing, which was trading at a discount to its Dutch listing. Other recent changes to the portfolio include the sale of Norwegian media group Schibsted on valuation grounds and a new investment in German software company SAP. The previous holding in SAP was sold due to concerns over competitive pressures, but subsequent analysis showed that new SAP products were performing well and the manager sees the repurchase as a reflection of the investment discipline that is maintained in running the portfolio.
Asset allocation
Investment process: Selecting for dividend growth
The manager seeks to identify companies that he believes are capable of delivering consistent dividend growth over a three- to five-year horizon and looks for the following main characteristics:
■
positive fundamentals – proven business models in markets with structural growth prospects;
■
ability to generate cash – free cash flow forecasts providing scope for dividend growth;
■
strong balance sheet – funding requirements unlikely to restrict dividend payments; and
■
attractive valuation – relative to peers and history, taking growth prospects into account.
The manager is able to draw on Fidelity’s pan-European analyst team in assessing stocks and a strong emphasis is placed on meeting company management to gain a more qualitative insight.
Bottom-up stock selection drives portfolio construction. Stocks are screened by comparing yield against dividend growth prospects, while portfolio holdings are ranked using a more comprehensive total shareholder return (TSR) analysis, which considers earnings growth, dividend yield,
re-/de-rating potential, liquidity and volatility, as well as Fidelity’s internal analyst rating. Differences between TSR rankings and stock weightings indicate where portfolio rebalancing may be appropriate. While TSR analysis may lead to increased portfolio turnover, it is expected that the effect of this will be more than compensated by improved execution of the investment process.
Top-down geographic allocations are not imposed, but countries represented in the benchmark index should comprise at least 80% of the portfolio, with up to 20% invested in companies listed elsewhere that have some European exposure. The manager aims to keep sector weightings within five percentage points of the benchmark. Up to 10% can be invested in any one quoted company at the time of acquisition and aggregate exposure to unquoted securities is limited to 5%.
Current portfolio positioning
FEV maintains a relatively concentrated portfolio of c 60 holdings with the top 10 representing 37.7% of the portfolio at 31 May 2016, very similar to a year earlier (see Exhibit 1). As shown in Exhibit 3, FEV’s largest active sector exposures are overweight positions in healthcare and technology and underweight positions in basic materials and telecoms, with industrials seeing the greatest increase in exposure over the last year. While financials and consumer goods represent the largest portfolio weightings, these sectors have seen the greatest decrease in exposure over the last 12 months and FEV is underweight in both sectors.
Exhibit 3: Portfolio sector exposure vs benchmark (%)
Portfolio |
Portfolio |
Change |
Benchmark |
Active weight vs index |
Trust weight/ index weight |
|
Financials |
20.8 |
23.8 |
(3.0) |
21.6 |
(0.8) |
1.0 |
Consumer goods |
17.9 |
19.7 |
(1.8) |
19.6 |
(1.7) |
0.9 |
Healthcare |
17.7 |
16.8 |
0.9 |
14.0 |
3.6 |
1.3 |
Industrials |
16.5 |
13.4 |
3.1 |
14.8 |
1.8 |
1.1 |
Technology |
6.5 |
5.8 |
0.7 |
4.5 |
2.0 |
1.4 |
Consumer services |
6.4 |
7.6 |
(1.2) |
5.7 |
0.7 |
1.1 |
Oil & gas |
5.2 |
3.9 |
1.3 |
4.2 |
1.0 |
1.2 |
Utilities |
3.9 |
3.3 |
0.6 |
3.8 |
0.1 |
1.0 |
Basic materials |
3.6 |
4.0 |
(0.4) |
7.6 |
(3.9) |
0.5 |
Telecommunications |
1.5 |
1.7 |
(0.2) |
4.2 |
(2.7) |
0.3 |
100.0 |
100.0 |
100.0 |
Source: Fidelity European Values, Edison Investment Research
FEV’s portfolio is broadly diversified by geography but, with allocations not constrained, individual country weightings can differ appreciably from the benchmark. At end-May 2016, the portfolio had notable overweight exposures to the UK and France with an underweight exposure to Germany (see Exhibit 4). The greatest shifts in exposure compared with a year earlier were increases in France and Spain and decreases in Switzerland and Germany.
Exhibit 4: Portfolio geographic exposure vs benchmark (%)
Portfolio |
Portfolio |
Change |
Benchmark |
Active weight vs index |
Trust weight/ index weight |
|
France |
27.1 |
24.5 |
2.6 |
21.4 |
5.7 |
1.3 |
Switzerland |
20.0 |
22.3 |
(2.3) |
19.8 |
0.2 |
1.0 |
Germany |
12.0 |
13.9 |
(2.0) |
19.6 |
(7.6) |
0.6 |
United Kingdom |
7.4 |
5.6 |
1.7 |
0.2 |
7.2 |
43.5 |
Belgium |
6.4 |
6.9 |
(0.5) |
3.3 |
3.2 |
2.0 |
Spain |
5.9 |
3.3 |
2.6 |
7.0 |
(1.1) |
0.8 |
Denmark |
5.4 |
5.9 |
(0.5) |
4.4 |
1.0 |
1.2 |
Finland |
5.0 |
4.7 |
0.4 |
2.3 |
2.7 |
2.2 |
Norway |
3.2 |
4.8 |
(1.6) |
1.3 |
1.9 |
2.5 |
Netherlands |
2.7 |
N/A |
N/A |
6.2 |
(3.5) |
0.4 |
Sweden |
N/A |
2.6 |
N/A |
N/A |
N/A |
N/A |
Other Countries |
4.8 |
5.4 |
(0.5) |
14.7 |
(9.8) |
0.3 |
100.0 |
100.0 |
100.0 |
Source: Fidelity European Values, Edison Investment Research
Performance: Outperformance over three to 10 years
As shown in Exhibit 6, FEV’s share price and NAV total return have outperformed its FTSE World Europe ex-UK index benchmark over three, five and 10 years. While NAV performance has been similar to the benchmark over one year, a widening of the discount is reflected in the weaker share price performance. Financials made the strongest contribution to relative performance over the last year, particularly FEV’s lack of exposure to Banco Santander, Deutsche Bank and Credit Suisse, which outweighed the negative effect of overweight holdings in GAM and Zurich Insurance. Industrials also made a strong contribution, driven by holdings in Intertek (UK-listed), Kone, Schindler Holding and Flughafen Zurich Airport. Consumer discretionary was the main detractor from performance relative to the benchmark, primarily due to FEV’s overweight holding in Volkswagen. Within healthcare, FEV’s lack of exposure to Novartis largely offset the drag on performance from its overweight holding in Sanofi. During the last five years, FEV achieved its strongest period of outperformance between October 2011 and April 2012 (see Exhibit 7), particularly noticeable while the market declined in March and April 2012, reflecting a tendency for the manager’s investment style to create a defensively-positioned portfolio.
|
Exhibit 5: Investment trust performance to 31 May 2016 |
||||||||
Price, NAV and benchmark total return performance, one-year rebased |
Price, NAV and benchmark total return performance (%) |
|||||||
|
|
|||||||
|
Source: Thomson Datastream, Edison Investment Research. Note: Three-, five- and 10-year performance figures annualised. |
||||||||
|
Exhibit 6: Share price and NAV total return performance, versus indices (percentage points) |
||||||||
|
One month |
Three months |
Six months |
One year |
Three years |
Five years |
10 years |
|
Price relative to FTSE World Eur ex-UK |
2.0 |
2.0 |
1.7 |
(3.2) |
6.0 |
20.2 |
9.4 |
|
NAV relative to FTSE World Eur ex-UK |
(0.1) |
(0.9) |
1.4 |
(0.1) |
2.1 |
11.2 |
11.1 |
|
Price relative to MSCI Europe |
1.8 |
2.4 |
2.2 |
(1.9) |
8.5 |
18.7 |
12.5 |
|
NAV relative to MSCI Europe |
(0.3) |
(0.6) |
1.9 |
1.3 |
4.5 |
9.9 |
14.2 |
|
Price relative to MSCI World |
0.7 |
1.8 |
(1.0) |
(8.0) |
(5.1) |
(6.4) |
(11.7) |
|
NAV relative to MSCI World |
(1.3) |
(1.1) |
(1.3) |
(5.0) |
(8.6) |
(13.4) |
(10.3) |
|
Source: Thomson Datastream, Edison Investment Research. Note: Data to end-May 2016. Geometric calculation.
|
Exhibit 7: NAV performance relative to benchmark over five years |
|
|
Source: Thomson Datastream, Edison Investment Research |
Capital structure and fees
FEV has 416.3m shares in issue, having repurchased 0.2m shares since restarting share buybacks in March 2016. Prior to this, no shares had been repurchased since July 2014. FEV has authority to repurchase up to 14.99% of its outstanding shares and buybacks have been a regular feature in previous years (see Exhibit 1). The board’s view is that gearing can enhance long-term returns and FEV’s normal policy is to maintain a modest level of gearing using contracts for difference (CFDs). While gearing of up to 30% is permitted, the current range set by the board is 0% to 10% and at end-May 2016, gross and net effective gearing stood at 3.1%. FEV pays a management fee of 0.85% pa of net assets and from 2015 no performance fee is payable. All management fees and expenses are charged to revenue rather than capital. For 2015 the ongoing charge was 0.94%.
FEV is subject to a two-yearly continuation vote, with the next scheduled at the May 2017 AGM.
Dividend policy
FEV pays an annual dividend in May, distributing in full the prior financial year’s revenue earnings. The trust’s objective is to achieve long-term capital growth, but the manager’s focus on companies able to grow dividends has provided a rising income, leading to the ordinary dividend increasing in each of the last five years (see Exhibit 1) with a 7.4% gain to 3.33p for FY15. Special dividends are paid exceptionally; the 0.54p paid for FY14 related to the recovery of £2.3m of French withholding tax and interest. There is no certainty that dividend payments will continue to rise in future years, but the manager sees potential for portfolio companies to deliver high single-digit dividend growth in 2016. At end-2015, FEV’s revenue reserves in excess of the FY15 dividend payment equated to 1.8p per share; these may be used to smooth the progression of future dividends.
Peer group comparison
Exhibit 9 shows a comparison of FEV with AIC Europe sector peers. The only trusts with over 5% UK exposure are FEV (7%) and Jupiter European Opportunities (24%), which are also the largest funds in the sector with market caps over £500m. FEV’s NAV total return performance, while ahead of the benchmark over most time periods, is lower than the peer group averages over the periods shown. The manager notes that recent small-cap outperformance has been unhelpful to FEV given its large-cap bias relative to peers. In terms of risk-adjusted returns, FEV’s one- and three-year Sharpe ratios are similar to the peer group average and reflect increased market volatility over the last year. FEV’s share price discount to NAV is slightly wider than the peer group average, while its ongoing charge is similar to the average and its gearing is modestly below average. FEV’s 2.1% dividend yield is moderately lower than the peer group average, but in line with the average excluding JPMorgan European Income, the only income-focused trust in the peer group.
Exhibit 9: AIC Europe sector peer group comparison as at 20 June 2016
% unless stated |
Market cap £m |
NAV TR 1 Year |
NAV TR 3 Year |
NAV TR 5 Year |
NAV TR 10 Year |
Sharpe 1y (NAV) |
Sharpe 3y (NAV) |
Discount (ex-par) |
Ongoing charge |
Perf. fee |
Net gearing |
Dividend yield (%) |
Fidelity European Values |
673.6 |
(1.8) |
20.4 |
40.4 |
95.1 |
(0.5) |
0.5 |
(7.1) |
0.94 |
No |
103 |
2.1 |
BlackRock Greater Europe |
251.8 |
3.1 |
24.5 |
40.9 |
112.8 |
(0.2) |
0.6 |
(3.0) |
0.89 |
No |
100 |
2.0 |
European Investment |
271.4 |
(10.4) |
11.8 |
21.8 |
35.5 |
(0.9) |
0.3 |
(10.6) |
0.61 |
No |
100 |
2.3 |
Henderson European Focus Trust |
191.3 |
(1.7) |
34.5 |
63.4 |
149.1 |
(0.4) |
0.7 |
(4.7) |
0.88 |
Yes |
109 |
2.6 |
Henderson EuroTrust |
173.9 |
4.5 |
32.7 |
58.2 |
140.1 |
(0.1) |
0.7 |
(5.9) |
0.86 |
Yes |
107 |
2.3 |
JPMorgan European Growth |
171.0 |
1.5 |
28.4 |
37.2 |
75.9 |
(0.2) |
0.6 |
(11.8) |
1.04 |
No |
109 |
2.8 |
JPMorgan European Income |
111.4 |
2.3 |
34.3 |
53.0 |
|
(0.3) |
0.7 |
(7.6) |
1.08 |
No |
111 |
4.0 |
Jupiter European Opportunities |
559.6 |
2.7 |
39.5 |
87.5 |
239.4 |
(0.0) |
0.8 |
(3.8) |
1.09 |
Yes |
116 |
0.8 |
Average |
300.5 |
0.0 |
28.3 |
50.3 |
121.1 |
(0.3) |
0.6 |
(6.8) |
0.92 |
107 |
2.4 |
Source: Morningstar, Edison Investment Research. Note: TR=total return. Sharpe ratio is a measure of risk-adjusted return. The ratios shown are calculated by Morningstar for the past 12- and 36-month periods by dividing a fund’s annualised excess returns over the risk-free rate by its annualised standard deviation. Net gearing is total assets less cash and equivalents as a percentage of net assets.
The board
Humphrey van der Klugt stepped down from the board in May 2016 after nine years’ service, including six years as chairman, leaving the board comprising five non-executive directors, four of whom are independent. Vivian Bazalgette (appointed December 2015) has taken over as chairman. The other independent directors are James Robinson (senior independent director, appointed June 2007), Robin Niblett (appointed January 2010) and Marion Sears (appointed January 2013). Simon Fraser (appointed July 2002) spent 27 years at Fidelity before retiring in 2008, including six years as CIO for Fidelity International, and is therefore deemed not to be an independent director.
|