Last close As at 05/08/2026
—
— 0.00 (0.00%)
Market capitalisation
—
Research: Energy & Resources
The Colombian, Caribbean Coast gas market is expected to move into gas deficit in the absence of LNG imports, incremental piped gas or the development of recent deepwater discoveries. We expect Canacol’s market share to increase materially in 2019 and 2020, with management expecting production to ramp-up to 215mmscfd by mid-2019 (+89% from FY18). This is currently underpinned by a YE18 2P reserve base of c 559bcf, implying a reserve life index (RLI) of 7.1 years at 215mmscfd. High exploration and appraisal success rates (historically above 80%) and over 2.6tcf of unrisked prospective resource should enable Canacol to enhance RLI and provide the basis for further production expansion. Realised gas prices are largely fixed (forecast FY19 c US$4.75/mcf post-transport and pre-tax netback of US$3.73/mcf), providing visibility of free cash flows. Our 2P + risked exploration NAV stands at C$6.28/share.
Written by
Canacol Energy |
FCF to drive growth in RLI and cash returns |
Initiation of coverage |
Oil & gas |
14 May 2019 |
Share price performance
Business description
Next event
Analysts
Canacol Energy is a research client of Edison Investment Research Limited |
|||||||||||||||||||||||||||||||||||||||||||||||||
The Colombian, Caribbean Coast gas market is expected to move into gas deficit in the absence of LNG imports, incremental piped gas or the development of recent deepwater discoveries. We expect Canacol’s market share to increase materially in 2019 and 2020, with management expecting production to ramp-up to 215mmscfd by mid-2019 (+89% from FY18). This is currently underpinned by a YE18 2P reserve base of c 559bcf, implying a reserve life index (RLI) of 7.1 years at 215mmscfd. High exploration and appraisal success rates (historically above 80%) and over 2.6tcf of unrisked prospective resource should enable Canacol to enhance RLI and provide the basis for further production expansion. Realised gas prices are largely fixed (forecast FY19 c US$4.75/mcf post-transport and pre-tax netback of US$3.73/mcf), providing visibility of free cash flows. Our 2P + risked exploration NAV stands at C$6.28/share.
Year-end |
Revenue* (US$m) |
Adj EBITDAX** |
Cash from operations (US$m) |
Net cash/ |
Capex**** (US$m) |
12/17 |
156.6 |
130.2 |
65.3 |
(255.5) |
(106.0) |
12/18 |
204.5 |
138.6 |
94.0 |
(288.1) |
(75.5) |
12/19e |
243.2 |
196.6 |
170.0 |
(266.8) |
(119.0) |
12/20e |
321.8 |
269.0 |
227.1 |
(97.3) |
(27.8) |
Note: *Revenue net of transport expense and royalty **Adj EBITDAX is before non-recurring or non-cash charges and exploration expense ***cash and equivalents minus short- and long-term debt ****forecasts based on 2P production profile.
Growing RLI to extend production plateau
With over 2.6tcf of net unrisked prospective resource (Gaffney Cline estimated Pmean), Canacol has sufficient acreage to continue to replace produced reserves while extending and enhancing production plateau. Additions are likely to be key drivers of NAV, as prospective resource is converted to behind-pipe reserves.
FCF funds growth and shareholder returns
At forecast FY20 215mmscfd plateau production, we estimate that Canacol will be generating annual free cash flow (FCF) of US$170m after interest and maintenance capex (capex required to replace produced reserves). With our net debt forecast at 1.5x EBITDA at end FY19, capacity exists to expand the exploration programme, in addition to potential shareholder cash returns. Indicatively, assuming Canacol pursues a policy of shareholder distributions broadly in line with peers, this would imply a cash return yield of c 3.7% for FY20.
Valuation: DCF-based and relative valuation
Edison has valued Canacol using a conventional E&P risked NAV approach, with a base case valuation of C$6.28/share. Canacol currently trades at FY20 (post-ramp-up) P/CF 3.8x, versus its Canadian peers on 2.5x. We believe this premium is driven by certainty of price realisations, strong FCF yield and high production growth relative to peers. Key risks are around Canacol’s ability to replace reserves, somewhat mitigated by its strong track record of exploration success. Colombian geopolitical risk will drive differentiated views on cost of capital; we provide sensitivities to this key valuation input using 12.5% in our base case.
Investment summary
Company description: Colombian gas pure play
Canacol offers investors a pure-play on the Colombian, Caribbean coast gas market, a market expected to move into gas deficit over the course of the next decade in the absence of LNG imports, incremental piped gas or the development of recent deepwater discoveries. Canacol is a key component of regional demand with an estimated c 50% market share. This is expected to increase materially in 2019 and 2020, with management forecasting production to ramp-up to 215mmscfd by mid-2019. Based on 215mmscfd of plateau production, Edison estimates a reserve life index (RLI) of 7.1 years based on a year-end 2018 559bcf 2P reserve base. High exploration and appraisal success rates (historically above 80%) and over 2.6tcf of unrisked prospective resource should enable RLI expansion. Low well costs at sub US$5m, excellent reservoir quality and high unconstrained flow rates combined with largely fixed gas pricing (we forecast a realised price post-transport of US$4.75/mcf for FY19) provide for a company that has material FCF generation potential after investment in new well inventory. We expect to see increasing shareholder returns (dividend and buyback) after Canacol reaches a target 215mmscfd in June 2019.
Valuation: Expanding behind-pipe resource to enhance 2P value
Canacol currently trades at a premium to our 2P NAV, with the market ascribing some value to risked prospective resource. We expect the continued conversion of prospective resource to behind-pipe reserves to drive 2P NAV as Canacol leverages a historical exploration success rate of over 80%. We estimate the market is ascribing only 200bcf of incremental discovered resource, despite c 2.6tcf of unrisked prospective resource. In 2019, a planned six-well exploration and appraisal campaign should continue to expand the company’s reserve base. Edison’s risked NAV of C$6.28/share (C$6.90/share using a 10% WACC relative to Edison’s base case 12.5%) includes an estimated five-year exploration drilling programme with 800bcf unrisked prospective and assumes a post-3D commercial success rate of 45%. We also look at valuation scenarios based on a sustained 215mmscfd and 315mmscfd plateau, which stand at C$7.62/share and C$9.22/share respectively.
|
Exhibit 1: Edison valuation scenarios versus share price (base case at 12.5% WACC) |
|
|
Source: Edison Investment Research. Note: Priced at 13 May 2019. |
Financials: Fixed-price gas contracts provide visibility of FCF
Canacol sells c 90% of its gas based on fixed-price contracts, with realisations forecast to average c US$4.75/mcf post-transport in FY19. With production expected to ramp up to 215mmscfd by mid-2019, we forecast that this provides visibility of post-tax operating cash flow after interest at US$227m in FY20 (US$170m in FY19). After maintenance capital required to replenish and grow Canacol’s reserve base, we believe management will direct capital to growth opportunities including incremental acreage acquisition, increasing shareholder returns, and debt reduction. Indicatively, based on Edison’s FY20 FCF forecasts and assuming a cash return to shareholders in line with Canacol’s dividend-paying peers, we could expect a cash return yield (dividend and buyback) of 3.7%. Net debt/EBITDA stands at forecast 1.5x at end FY19 and well within covenant limits, implying capacity to fund inorganic growth and shareholder returns.
Risks and sensitivities
We see the key risk as infrastructure access: Canacol is reliant on Promigas pipeline infrastructure to transport its gas to end-users. While an unforeseeable event limiting gas transport capacity would have a material impact on cash flows, this is mitigated by the fact that pipeline availability has been in excess of 95% since operations began and through comprehensive business insurance. Other key risks include Colombian geopolitical risk and exploration success rates. A minor valuation uncertainty includes unit operating expense. In the short-term, rising production over a predominantly fixed cost base should ensure unit opex falls. This is likely to be offset by higher unit royalty rates as production shifts to higher royalty paying licences such as VIM-5.
Caribbean Coast gas macro and pricing
Government estimates of Caribbean Coast gas demand stand at c 450mmscfd growing at 3–4% per annum. Meeting this demand are several historical large gas discoveries, most notably the Chevron-operated assets in the Guajira Basin, which are in decline. Canacol Energy is a now a key contributor to regional gas supply at 130mmscfd in 2018, and anticipates this will grow to 215mmscfd by mid-2019.
Our estimates of regional gas supply and demand imply an increasing supply gap, which will likely be met through a combination of new gas discoveries, LNG imports and the potential development of deepwater gas discoveries.
|
Exhibit 2: Edison forecasts of Caribbean Coast gas supply and demand |
|
|
Source: Edison Investment Research |
Over US$7/mcf required to attract spot LNG at current US gas prices
Competing gas supply from the existing 3Mtpa (c 400mmscfd) of regas capacity at Cartagena LNG FSRU comes at a cost indexed to US Henry Hub pricing. We estimate that a landed cost of US$5.0–6.0/mcf at Cartagena based on a Henry Hub price of US$3.00/mcf would be achievable, but for importers that have the option of greater margins from Asian spot markets, there is little incentive to direct cargoes to Cartagena unless prices are materially higher. For example, if we were to adjust Japan spot LNG prices for transport from the US to Colombia (rather than Japan), we estimate that a price of over US$7.00/mcf would be required to attract spot cargoes.
|
Exhibit 3: LNG pricing versus Canacol realised price post transport |
|
|
Source: Edison Investment Research. Note: *Adjusted for shipping costs to Colombia rather than Japan. |
LNG operations started in late 2016 when Colombia received its first import cargo. It received a second cargo in mid-2017, but reports suggest minimal volumes have been passing through the facility since inception.
Development of deepwater gas discoveries
Ecopetrol and Anadarko have made sizeable gas discoveries in the deep waters of the Colombian Caribbean Coast, in particular, the 2015 Kronos discovery, and 2017 Purple Angel and Gorgon discoveries. The 2017 Gorgon-1 exploratory well showed presence of gas 27km away from the Purple Angel-1 well, which had confirmed an extension of the gas reservoir discovered at Kronos-1. Thick gas sands confirmed material in place volumes, but estimates of gas-in-place or recoverable gas have yet to be released publicly. Given the lack of infrastructure, an offshore development would require significant investment in pipeline and onshore receival/processing facilities in order to be monetised. We estimate that gas supply from this deepwater gas ‘cluster’ would take at least five to six years to engineer and develop. We estimate that break-even gas prices are likely to be higher than both the cost of importer US LNG and Canacol’s post-transport pricing. As an analogue, BP and Reliance Industries’ development of the Block KG D6 deepwater gas is estimated by BP to cost c US$6bn, based on 3tcf field development with gas to be sold at a regulated price of c US$6.50/mcf.
Canacol gas price realisations
Canacol sells gas under long-term, fixed-price gas contracts, typically of five to 10 years’ duration and include inflation clauses. Based on current contracted volumes, Edison’s forecasts of average realisations (post-transport) are shown in the table below. These are based on company guidance and as provided in the company’s last published reserve report. This forms the basis of our medium-term price forecasts, beyond which we use US$5.50/mcf and 2.5% inflation.
Exhibit 4: Canacol contracted gas prices – FY18 reserve report
Five-year gas price forecast |
2019 |
2020 |
2021 |
2022 |
2023 |
|
Canacol 2018 reserve report (US$/mmBtu) |
4.84 |
5.15 |
5.13 |
5.24 |
5.34 |
|
Edison forecasts (US$/mcf) |
4.75 |
4.87 |
4.99 |
5.12 |
5.24 |
Source: Edison Investment Research, Canacol Energy
While there is high visibility of short-term realisations, there is some uncertainty on the pricing of new contracts, hence we provide a valuation sensitivity to gas pricing beyond 2023 in the table below within a US$4.00/mcf to US$7.00/mcf range.
Exhibit 5: Core NAV valuation sensitivities to gas price assumption
Long-term gas price (2023+) US$/mcf |
4.00 |
4.50 |
5.00 |
5.50 |
6.00 |
6.50 |
7.00 |
|
2P valuation |
3.54 |
3.67 |
3.79 |
3.92 |
4.05 |
4.18 |
4.31 |
|
215mmscfd valuation |
5.70 |
6.34 |
6.98 |
7.62 |
8.26 |
8.90 |
9.54 |
|
315mmscfd valuation |
7.02 |
7.75 |
8.49 |
9.22 |
9.96 |
10.70 |
11.43 |
Source: Edison Investment Research
Asset overview and exploration running room
Canacol Energy was launched as a private company in February 2008, initially involved in the exploration of oil assets onshore Colombia with the Capella field discovery and acquisition of the Rancho Hermoso Field in the Llanos basin. The acquisition of Shona Energy in December 2012 provided a gas leg to Canacol, leading to a series of successful gas discoveries in the Lower Magdalena, Colombia. Continued consolidation of gas assets, exploration success and licence awards enabled Canacol to amass a leading onshore position in the basin making the company a key supplier of gas along the Caribbean coast.
Canacol’s gas is sold to a range of customers and transported to customers via three main pipeline routings: 1) Promigas-owned pipeline infrastructure, notably two major trunk lines from Jobo to Cartagena with combined capacity of c 160mmscfd available to Canacol; 2) the privately owned Sabanas pipeline with 40mmscfd of capacity installed in 2017; and 3) a pipeline routed south from Jobo supplying 15–20mmscfd to a ferronickel mine.
Canacol’s YE18 2P reserve base at 559bcf equates to a reserve life of 7.1 years based on gas sales of 215mmscfd. While current contracts are typically five to 10 years in duration and are underpinned by existing reserves, Canacol is looking to add to its reserve base in order to provide the basis for expanding production capacity and extending existing gas contracts.
|
Exhibit 6: 2P gas reserve growth bcf |
|
|
Source: Edison Investment Research, Canacol Energy |
2019 capital commitments include an eight-well exploration, appraisal and development programme. This includes the Acordeon-1, Arandala-1 and Saxofon-1 exploration wells. Management has not disclosed prospective resources for these well locations, but conservatively assuming c 20bcf recoverable (mid-case) per appraisal/exploration location (six in total) and a 45% chance of exploration success, we estimate that this programme has the potential to add c 60bcf of reserves, and significantly higher if exploration success rates are in line with recent historical averages at c 80%.
|
Exhibit 7: Canacol existing gas field, prospects and leads |
|
|
Source: Canacol Energy |
The direction of exploration capital is likely to be driven by a combination of factors, including seismic data access/quality, block fiscal terms and available tax offsets/losses. A summary of key royalty terms is provided below by exploration block. The government posted tax rate is currently 33%, reducing annually by 1% before reaching a rate of 30% by 2022. This rate is before applicable offsets.
Exhibit 8: Royalty rates by exploration block with existing discoveries
Canacol equity interest |
Production based royalty rate |
Overriding royalty |
X-Factor |
|
VIM-5 |
100% |
6.4% to 20% |
3.5% |
13.0% |
VIM-21 |
100% |
6.4% to 20% |
2.0% |
0.0% |
Esperanza |
100% |
6.4% to 20% |
2.0% |
0.0% |
Source: Edison Investment Research
Lower Magdalena Valley overview
The Lower Magdalena Valley (LMV) Basin is located in the north-west of Colombia and has a history of gas exploration going back to the 1950s. The LMV is a forearc basin created by the convergence of the Pacific and South American plates and is limited by the Bucaramanga–Santa Marta fault system to the east, the Central Cordillera to the south and the Romeral fault system to the west. The primary reservoir in the basin is the Cienaga de Oro (CDO) formation, which consists of thick (up to 5,000ft) marginal marine clastics of Eocene to Lower Miocene age. Rivers deposited the sands in deltaic systems, which sit directly on basement and are overlain by thick marine shales of the Porquero formation, providing an effective seal. The source of the dry gas is generally thought to be source rocks in the Porquero and the CDO. The area has experienced a complex tectonic evolution since the Cretaceous, which has produced areas of faulting and compartmentalisation.
|
Exhibit 9: Exploration prospects and leads |
|
|
Source: Canacol Energy |
The company produces from the CDO in the Nelson, Palmer, Trombon, Nispero and Canahuate gas fields in the Esperanza block and Clarinete and Oboe in VIM-5, while Pandereta and Chirimia are expected to come onstream imminently. Canacol also produces gas from the shallower, lower-pressured Porquero sandstones in Toronja and Breva in VIM-21 and from the Nelson-6 well. Canacol confirmed the commerciality of this new exploration play type across its acreage with the drilling of Nelson 6 in 2016, designed to assess the deliverability of interpreted by‐passed gas pay in the Porquero, as seen in offset wells within the Nelson gas field. The well encountered 41ft net gas pay with an average porosity of 19% in the primary Porquero reservoir target and flowed gas at a stable rate of 23mmscfd.
High historical exploration success rates
Canacol has achieved a high exploration success rate by identifying gas charged reservoirs from seismic data where possible. The company has benefited from the availability of extensive 2D and 3D seismic data, extending in vintage from the late 1990s to 2012 and acquired by previous operators in the region: Pacific Rubiales, OGX and Shona Energy. Canacol uses AVO methodology to look for the difference between gas-bearing and water-bearing sandstones on logs, and, once calibrated with seismic, believes it can identify gas sands down to a minimum thickness of 35ft. This process has limits, however, depending on the availability and quality of the older acquired seismic data. The company has refined this technique mainly for application in the CDO, with the Porquero at a less mature stage due to the smaller number of data points available to date.
|
Exhibit 10: Historical exploration and development well success rates |
|
|
Source: Canacol Energy, Edison Investment Research |
Exploration success rate dropped to 67% in 2018, with two out of the three exploration wells drilled that year producing disappointing results. Gaiteros-1 was targeting a large structure to the north of Pandereta. Although the prospect did not exhibit a fluid factor attribute, it was considered worthwhile drilling due to the very large prospect size. Despite encountering a very thick sand section, gas was not found and this lack of gas has confirmed the company’s amplitude versus offset (AVO) model. Borojo-1 did exhibit a fluid factor event, but was dry. Canacol now believes that the prospect, which was located in a downthrown fault block, had suffered due to historical production from the offset productive horst block. This has resulted in a re-prioritisation of the portfolio to avoid targeting downthrown blocks that have seen historical production updip.
Eight-well programme in 2019
In 2019, the company is planning an eight-well programme of exploration, appraisal (six wells) and development wells (two wells). The first of the exploration wells, Acordeon-1, is due to commence drilling in Q119.
|
Exhibit 11: Acordeon prospect depth structure and seismic section highlighting AVO event |
|
|
Source: Canacol Energy |
Acordeon-1 is located 3km from the Clarinete and Chirimia discoveries in VIM-5. The well is in a crestal position and, if successful, the company intends to immediately drill follow-up locations in nearby downthrown fault blocks (shown as A-2 and A-3 in Exhibit 11). Three further targets along the crest (Acordeon-A,-B,-C in Exhibit 11) would also be de-risked by success in Acordeon-1, and would be drilled at a later date as these would need to be from a separate drill pad that has yet to be constructed.
In the event of follow-on drilling at Acordeon, it is likely that the remaining 2019 exploration wells would be delayed into 2020. Arandala-1 sits in VIM-21 and was de-risked by 2018’s Breva-1 discovery in the Porquero. Saxofon-1 will target the CDO in VIM-5.
While Canacol already has an extensive acreage position, extending to more than 593,000 hectares, an opportunity exists to participate in upcoming licence rounds in order to expand this footprint, providing the basis for further production expansion as well as a forecast gas deficit along the Caribbean Coast.
Unconventional assets in portfolio
Canacol also holds a 20% WI in two blocks, VMM-2 and VMM-3, in the Middle Magdalena Valley Basin (MMVB), a north-south trending basin in central Colombia. The MMVB is Colombia’s most explored conventional oil and gas producing basin, with over 40 discovered oil fields that produce from Tertiary sandstone reservoirs. However, the principal source rock for the basin, the Cretaceous La Luna, is now the main focus for shale exploration in the region.
The La Luna shale is similar in age to the Niobrara shale play in the US and is organic rich, with an average TOC of 5% and also highly overpressured. In 2018 DeGolyer & MacNaughton independently assessed P50 resources of 168mmbbl in VMM-2, VMM-3 and Santa Isabel, with an upside of 263mmbbl. Operator ConocoPhillips applied for a licence to drill and frack six horizontal wells in VMM-2 and VMM-3 in late 2017 and expects permission to be granted in early 2019. Any activity will take place once ConocoPhillips is able to evaluate the experience of Ecopetrol, which is due to carry out the first multi-stage fracks in the region in 2019.
DCF-based valuation scenarios
In this section, we look at three DCF-based valuation scenarios. Our 2P valuation incorporates discounted cash flows reflecting the monetisation of the company’s existing reserve base, adjusting for overheads, net debt and decommissioning provisions to arrive at an NAV. We also look at two additional valuation scenarios that include incremental reserves over and above 2P; here we include ‘maintenance’ capex (largely 3D seismic, exploration wells and tie-in costs) required to add reserves to sustain production plateau. Our DCFs utilise a standardised discount rate of 12.5%, but we provide sensitivities to this key assumption later in this note. Key model inputs for our valuation scenarios are described in the table below.
Exhibit 12: Valuation scenarios and inputs
2P base case |
215mmscfd sustained plateau |
315mmscfd sustained plateau |
|
Gas monetised (bcf) |
559* |
1,675 |
1,659 |
Additional gas recovered above 2P (bcf) |
0 |
1,116 |
1,100 |
Life of field average opex (US$/mcf) |
0.34 |
0.40 |
0.37 |
Average well cost (US$m) |
4.2 |
4.2 |
4.2 |
Tie-in and compression cost per location 2019 costs (US$m) |
4.3 |
4.3 |
4.3 |
Annual 3D seismic 2019 costs (US$m) |
0.0 |
17.0 |
30.0 |
Plateau production (mmscfd)** |
215 |
215 |
315 |
Realised price post-transport 2019 prices (US$/mcf)*** |
4.75 |
4.75 |
4.75 |
Source: Edison Investment Research. Note: *2P of 559bcf at YE18. **Production profiles provided later in this report. ***Realised price post-transport at US$4.75/mcf FY19 and US$5.50/mcf in 2024 escalated by 2.5% thereafter.
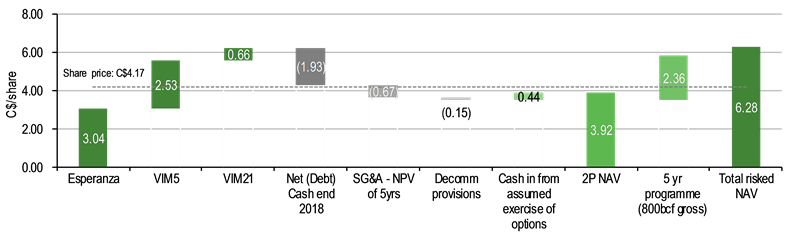
The graph below shows our estimates of NAV per share, at varying scenarios, compared to the current share price. We include an additional scenario (risked exploration NAV) that adds the estimated value of risked prospective resource (800bcf risked at 45% commercial chance of success) to our 2P base case. 800bcf broadly equates to a five-year programme of around eight wells per year, with an average target size of 20bcf. Our estimate of a 45% chance of commercial success is higher than Gaffney Cline & Associates’ (GCA) estimate of c 36% as we assume wells are drilled on 3D seismic, rather than 2D. The cost of incremental 3D seismic acquisition is incorporated into our valuation scenarios.
We believe the market is currently fully valuing Canacol’s 2P reserve base but is potentially undervaluing prospective resource despite historically high E&A success rates. We estimate a market implied exploration success rate of just 8% based on 2.6tcf of net unrisked prospective resource.
|
Exhibit 13: Edison valuation scenarios versus share price (base case at 12.5% WACC) |
|
|
Source: Edison Investment Research. Note: Priced at 13 May 2019. |
Base case: 2P valuation plus risked prospective resource
In our 2P valuation case, we use reported year-end 2018 reserves of 559bcf, based on a Canacol estimated 59bcf of reserve additions to July 2018, and an estimated 13bcf of discoveries in H218 less an annual production decline of c 47bcf. Our 2P valuation assumes a relatively short production plateau of 215mmscfd sales (based on 230mmscfd of pipeline capacity) prior to terminal decline, assuming minimal incremental drilling beyond planned development wells and zero value for acreage and prospective resource.
|
Exhibit 14: Forecast 2P production profile |
Exhibit 15: 2P operating cash flows |
|
|
|
Source: Edison Investment Research |
|
Exhibit 14: Forecast 2P production profile |
|
|
Source: Edison Investment Research |
|
Exhibit 15: 2P operating cash flows |
|
|
Source: Edison Investment Research |
Clearly, given Canacol’s historical exploration success rate across the Esperanza, VIM-5 and VIM-21 blocks plus acreage with a total GCA estimated unrisked prospective resource of 2.6tcf, there is material value in the company’s ability to replace produced reserves and add to behind pipe resource.
Discount rate sensitivity
A key sensitivity when considering the value of Canacol’s asset base is the discount rate, and within this, the country risk applicable to a company with 100% of cash flows from a single asset in Colombia. We have used a generic discount rate of 12.5% in our valuation; this is in line with that used for funded, cash-generative E&Ps with operations in emerging markets. We provide a sensitivity to this key input below.
Exhibit 16: 2P and risked exploration NAV sensitivity (C$/share) to WACC
WACC |
8.0% |
10.0% |
12.5% |
15.0% |
|
2P NAV |
5.10 |
4.53 |
3.92 |
3.40 |
|
Risked NAV (800bcf risked @ 45%) |
7.46 |
6.90 |
6.28 |
5.76 |
Source: Edison Investment Research
There is potential justification for the use of a slightly lower discount rate based on Cancaol’s current fixed coupon (bullet repayment in 2025) bond priced at 7.25% with the company fully funded for its share of future drilling expense. Canacol is therefore not reliant on expensive sources of capital such as heavily discounted equity issues or industry capital in the form of farm-out.
|
Exhibit 17: Valuation sensitivity to WACC |
Exhibit 18: Valuation sensitivity to prospective resource potential |
|
|
|
Source: Edison Investment Research |
|
Exhibit 17: Valuation sensitivity to WACC |
|
|
Source: Edison Investment Research |
|
Exhibit 18: Valuation sensitivity to prospective resource potential |
|
|
Source: Edison Investment Research |
Valuation of prospective resource
GCA estimates over 2.6tcf of net unrisked prospective resource across Canacol’s existing acreage. Given the contiguous acreage position incorporating Esperanza, VIM-5, VIM-21 and SSJN-7, VIM-19 discoveries are likely to be easily tied-in to existing processing and pipeline facilities. Management estimates a fully tied-in well cost of c US$7.5m; we include additional compression costs in our estimated all-in well costs of US$8.2m. Much of this prospective resource is mapped on 2D seismic but not covered by 3D data, therefore we would expect a wider uncertainty range around the 2.6tcf (Pmean) unrisked prospective resource estimate provided by GCA than suggested in Canacol’s 2017 CPR (P90 unrisked prospective resource of 2.0tcf and P10 3.3tcf).
Typically, for our E&P coverage, we value a company’s 2P reserve base and risk the potential of committed, funded exploration. In the case of Canacol, which has a rolling 3D seismic and E&A programme, we have included 800bcf of unrisked prospective resource (we estimate this would broadly equate to a five-year 3D seismic and drilling programme assuming an average prospect size of 20bcf) and conservatively assumed a 45% success rate. GCA estimates a c 36% exploration success rate based on 2D data, and, given Canacol’s ability to locate gas-bearing sand using 3D AVO data we believe a success rate of closer to 45% is possible post-3D. Our assumption is lower than Canacol’s six-year historical rate of over 80% and reflects the fact that prospects move further away from ‘known-gas’.
Our base case valuation is highly sensitive to assumptions around risked exploration potential, therefore we provide sensitivities to our key inputs below.
Exhibit 19: Risked valuation sensitivity to prospective resource assumptions C$/share
Unrisked prospective resource (bcf) |
|||||||
Commercial chance of success (%) |
400 |
800 |
1,200 |
1,600 |
2,000 |
2,400 |
2,800 |
15% |
4.32 |
4.71 |
5.10 |
5.50 |
5.89 |
6.28 |
6.68 |
30% |
4.71 |
5.50 |
6.28 |
7.07 |
7.86 |
8.65 |
9.43 |
45% |
5.10 |
6.28 |
7.47 |
8.65 |
9.83 |
11.01 |
12.19 |
60% |
5.50 |
7.07 |
8.65 |
10.22 |
11.80 |
13.37 |
14.95 |
75% |
5.89 |
7.86 |
9.83 |
11.80 |
13.77 |
15.73 |
17.70 |
90% |
6.28 |
8.65 |
11.01 |
13.37 |
15.73 |
18.10 |
20.46 |
Source: Edison Investment Research
Assuming a full 2.6tcf and historical success rates of c 80%, Canacol could be worth significantly more than the current share price.
Exhibit 20: Base case NAV breakdown
Number of shares: 193.6m* |
Recoverable reserves |
Net risked value (@12.5%) |
||||||
Asset |
Country |
Diluted WI |
CoS |
Gross |
Net |
NPV per mcf |
NPV |
|
% |
% |
Bcf |
bcf |
US$/mcf |
US$m |
C$/share |
||
Net (debt)/cash end 2018 |
(288.1) |
(1.93) |
||||||
SG&A - NPV of 5yrs |
(100.4) |
(0.67) |
||||||
Decomm provisions |
(22.9) |
(0.15) |
||||||
Cash in from assumed exercise of options |
65.6 |
0.44 |
||||||
Producing assets |
||||||||
Esperanza |
Colombia |
100% |
100% |
259.7 |
259.7 |
1.75 |
454.9 |
3.05 |
VIM-21 |
Colombia |
100% |
100% |
47.6 |
47.6 |
2.07 |
98.4 |
0.66 |
VIM-5 |
Colombia |
100% |
100% |
251.9 |
251.9 |
1.50 |
378.2 |
2.53 |
Core NAV |
559.2 |
559.2 |
585.7 |
3.92 |
||||
Exploration/development upside |
||||||||
5yr programme (800bcf unrisked) |
Colombia |
100% |
45% |
800.0 |
800.0 |
0.98 |
352.8 |
2.36 |
Total NAV |
1,359.2 |
1,359.2 |
|
938.5 |
6.28 |
|||
Source: Edison Investment Research. Note: *Includes dilution from all share options.
|
Exhibit 21: Valuation waterfall 2P case |
|
|
Source: Edison Investment Research. Note: Priced at 13 May 2019. |
215mmscfd sustained plateau scenario: C$7.62/share
We assume Canacol is able to maintain an annual average rate of 215mmscfd from mid-2019 (pipeline capacity of 230mmscfd). As described above, we cap total recoverable gas at year-end 2018 2P reserves at a 559bcf, but assume a full 2.6tcf of prospective resource (in line with GCA’s Pmean estimate) and a point-forward success rate of 45%. This equates to 1.2tcf of risked recoverable gas through exploration. The cash flow profiles below include the cost of ongoing seismic surveys, development and exploration well costs.
|
Exhibit 22: 215mmscfd case production profile |
Exhibit 23: 215mmscfd operating cash flows |
|
|
|
Source: Edison Investment Research |
|
Exhibit 22: 215mmscfd case production profile |
|
|
Source: Edison Investment Research |
|
Exhibit 23: 215mmscfd operating cash flows |
|
|
Source: Edison Investment Research |
For this scenario we arrive at a NAV of C$7.62/share.
Exhibit 24: 215mmscfd scenario NAV breakdown
Number of shares: 193.6m* |
Recoverable reserves |
Net risked value (@12.5%) |
||||||
Asset |
Country |
Diluted WI |
CoS |
Gross |
Net |
NPV per mcf |
NPV |
|
% |
% |
bcf |
bcf |
US$/mcf |
US$m |
C$/share |
||
Net (Debt)/Cash end 2018 |
(288.1) |
(1.93) |
||||||
SG&A - NPV of 5yrs |
(100.4) |
(0.67) |
||||||
Decomm provisions |
(22.9) |
(0.15) |
||||||
Cash in from assumed exercise of options |
65.6 |
0.44 |
||||||
Producing assets |
||||||||
Esperanza |
Colombia |
100% |
100% |
678.1 |
678.1 |
1.10 |
742.8 |
4.97 |
VIM-21 |
Colombia |
100% |
100% |
78.1 |
78.1 |
1.30 |
101.2 |
0.68 |
VIM-5 |
Colombia |
100% |
100% |
913.3 |
913.3 |
0.70 |
639.5 |
4.28 |
Core NAV |
1,669.5 |
1,669.5 |
1,137.8 |
7.62 |
||||
Source: Edison Investment Research Note: *Includes dilution from all share options.
315mmscfd sustained plateau scenario
This represents an upside case with a production plateau of 315mmscfd from 2022 (this assumes Promigas pipeline capacity expansion to 330mmscfd). As in our base case, we use 559bcf of year-end 2018 2P reserves plus risked prospective resource additions of 1.2tcf. This scenario includes the incremental costs of 3D seismic and exploration well costs in order to sustain this higher level of output.
|
Exhibit 25: 315mmscfd case production profile |
Exhibit 26: 315mmscfd operating cash flows |
|
|
|
Source: Edison Investment Research |
|
Exhibit 25: 315mmscfd case production profile |
|
|
Source: Edison Investment Research |
|
Exhibit 26: 315mmscfd operating cash flows |
|
|
Source: Edison Investment Research |
For this scenario we arrive at an NAV of C$9.22/share.
Exhibit 27: 315mmscfd scenario NAV breakdown
Number of shares: 193.6m* |
Recoverable reserves |
Net risked value (@12.5%) |
||||||
Asset |
Country |
Diluted WI |
CoS |
Gross |
Net |
NPV per mcf |
NPV |
|
% |
% |
bcf |
bcf |
US$/mcf |
US$m |
C$/share |
||
Net (Debt)/Cash end 2018 |
(288.1) |
(1.93) |
||||||
SG&A - NPV of 5yrs |
(100.4) |
(0.67) |
||||||
Decomm provisions |
(22.9) |
(0.15) |
||||||
Cash in from assumed exercise of options |
65.6 |
0.44 |
||||||
Producing assets |
||||||||
Esperanza |
Colombia |
100% |
100% |
651.6 |
651.6 |
1.33 |
863.6 |
5.78 |
VIM-21 |
Colombia |
100% |
100% |
100.0 |
100.0 |
1.48 |
148.4 |
0.99 |
VIM-5 |
Colombia |
100% |
100% |
901.4 |
901.4 |
0.79 |
711.3 |
4.76 |
Core NAV |
1,653.0 |
1,653.0 |
1,377.6 |
9.22 |
||||
Source: Edison Investment Research Note: *Includes dilution from all share options.
Management
Charle Gamba – president & CEO
Mr Gamba founded Canacol Energy in 2008. He has held a variety of technical and management roles with major and mid-sized international oil companies, with the majority of his professional career focused on E&P in South America. Prior to creating Canacol, Mr Gamba was vice president of exploration for Occidental Oil & Gas Company based in Bogota, Colombia. In his eight years with Occidental, he lived and worked in Ecuador, Qatar, Colombia and the United States, working in a variety of technical and management roles. Mr Gamba has also worked for Alberta Energy Company in Argentina and Ecuador, and for Canadian Occidental in Australia, Canada, and Indonesia. He started his career as a geologist with Imperial Oil in Calgary, and holds an MSc and PhD in geology.
Jason Bednar – CFO
Mr Bednar is a chartered accountant with more than 18 years of direct professional experience in the financial and regulatory management of oil and gas companies listed on the Toronto Stock Exchange, TSX Venture Exchange and American Stock Exchange. Mr Bednar has been the CFO of several international oil and gas exploration companies, most notably the founding chief financial officer of Pan Orient Energy Corp, a South-East Asia exploration company, which during his tenure grew organically to operate 15,000bbl/d and reached a market cap of C$700m. He has previously sat on the board of directors of several internationally focused E&P companies, including being the past chairman of Gallic Energy. Mr Bednar began his career in the chartered accountancy firm of Brown Smith Owen in 1993 before moving into financial controller roles at oil production companies. Mr Bednar holds a bachelor of commerce degree from the University of Saskatchewan.
Ravi Sharma – COO
Mr Sharma joined Canacol in October 2015. He is a reservoir engineer with 30 years of oil and natural gas experience in the Americas, Middle East, Russia, Australasia and Africa. He has held progressively senior management roles at major E&P companies worldwide, most recently head of production & operations with Afren where he was responsible for production, development and operations activities in West Africa. Prior to this, Mr Sharma was global petroleum engineering manager for BHP Billiton Petroleum. Mr Sharma also held the position of worldwide chief reservoir engineer for Occidental Oil and Gas. Mr Sharma holds a BSc and MSc in mechanical engineering from the University of Alberta.
Mark Teare – SVP exploration
Mr Teare joined Canacol Energy in early 2009. Previously, he was at AEC International and EnCana where he held a series of senior management positions in Ecuador and Brazil. Over his 30-year career, he has had extensive experience with a number of senior international Canadian energy companies operating in North America, South America and Australasia. He holds an MSc degree in geology.
Risks and sensitivities
We see the risks below as representative of all independent E&Ps focused on exploration and appraisal.
Company-specific risks
■
Fiscal/country risk – Canacol’s operations are geographically concentrated. On a standalone basis the company is exposed to changes in fiscal terms and perceived country risk. Fiscal terms are viewed as compelling relative to other comparable jurisdictions, with low royalty rates and tax offsets.
■
Geological – Canacol is focused on a proven basin with proven play types and high historical exploration and appraisal success rates across its core area (VIM-21, VIM-5, Esperanza and SSJN-7, VIM-19). Geological risk is typical of an exploration-biased independent E&P, but reduced through the company’s historical success and ability to tie AVO anomalies to gas-bearing sands.
■
Pipeline risk – A key risk for Canacol is the company’s access to Promigas-owned pipeline infrastructure. Canacol is the largest supplier of gas into the Promigas Caribbean Coast pipeline network, and as such we see little risk in Promigas restricting access. Gas pipeline infrastructure has not been affected by attacks or theft to date, and Canacol has both business interruption insurance and contingent business insurance in order to mitigate against infrastructure-related risks.
■
Financial – Canacol Energy is well financed with an Edison-estimated net debt of US$258m in FY19 and net debt/EBITDA of 1.5x. Forecast net debt is expected to fall as the company generates FCF from higher gas sales. Fitch Ratings rates Canacol’s senior secured bonds at BB- and Moody’s B1.
■
Major shareholder – Cavengas has a c 18.4% stake in Canacol Energy, which is represented by two board seats. Canacol see Cavengas as a long-term shareholder with which it has a close working relationship. Cavengas’s largest shareholder is Oswaldo Cisneros Fajardo, a 78-year-old Venezuelan billionaire.
Generic sector risks
■
Commodity price – As with all companies operating in the upstream oil and gas sector, returns are driven by underlying commodity prices. Canacol is not immune, with the bulk of the company’s gas sales leveraged to contracted gas prices. Over 90% of gas is currently contracted, with average pricing after transport of c US$4.75/mcf.
■
Supply chain – Upstream project returns are driven by a combination of commodity price, project operating and capital costs and fiscal regimes. An important consideration is the availability and cost of equipment and personnel.
■
Political – Risks are largely specific to the country of operation. Moody’s provides a Baa2 negative credit rating for Colombia, but this is likely to be revised after Iván Duque’s government has had sufficient time to embed its campaign of cutting the fiscal deficit and boosting growth. The Colombian oil industry continues to be affected by pipeline attacks, with reports suggesting that the Canon Limon pipeline (210kbod capacity) was out of service for most of 2018. In most instances, operators find alternative routes for production and exports. Gas pipeline attacks appear to be far less common, and Canacol has not experienced any instances of the Promigas operated export line to Sincelejo being unavailable due to such events.
Relative valuation: FY20e represents steady-state
Canacol currently trades at a premium to our valuation of the company’s 2P reserve base, reflecting its ability to continue to replace production and grow its reserve base. We feel this is justified given the company’s historical exploration and appraisal success rates as well as installed infrastructure capable of supporting plateau production well beyond that implied by current reserves.
Other supporting factors include limited exposure to commodity price volatility, low levels of debt and high netbacks, which could help justify a lower cost of capital than our assumed 12.5%. We provide a sensitivity to this driver earlier in this note.
Relative to Canacol’s peer group, FCF yield post FY20 (based on 215mmscfd plateau production and after maintenance capex) is high at 18.9%. This has potential to support shareholder cash returns. Looking at dividends across the peer group, and assuming a linear relationship between dividend yield and FCF yield as shown in Exhibit 28, we estimate that based on our FY20 FCF forecasts Canacol could return a dividend yield of over 3.7%, which would equate to 16.1% of FCF. As it stands, the timing and form of any cash returns remain uncertain, however we expect further clarity once plateau production is achieved in 2019.
Canacol trades at P/CF of 5.3x in FY19 and 3.8x in FY20, compared to its Canadian E&P intermediate peers on 2.6x and 2.4x, and its Canadian E&P peers with Colombian operations on 3.2x and 2.9x, respectively.
|
Exhibit 28: FCF yield versus dividend yield |
Exhibit 29: P/CF vs netback US$/boe |
|
|
|
Source: Edison Investment Research, Thomson Reuters, Bloomberg |
|
Exhibit 28: FCF yield versus dividend yield |
|
|
Source: Edison Investment Research, Thomson Reuters, Bloomberg |
|
Exhibit 29: P/CF vs netback US$/boe |
|
|
Source: Edison Investment Research, Thomson Reuters, Bloomberg |
|
Exhibit 30: Peer group valuation table |
|
|
Source: Edison Investment Research, Thompson Reuters, Bloomberg. Note: Priced at 13 May 2019. |

Financials
Canacol generated strong netbacks per unit of production at a reported FY18 US$3.80 pre-tax, with cash flow from operations after interest forecast to rise from US$58m in FY18 to US$197m in FY20 based on a 215mmscfd production plateau. Over our forecast period royalties on a unit basis increase from US$0.61/mcf in FY18 to US$0.77/mcf by FY20 as production shifts from lower royalty paying blocks to VIM-5. This is partly offset by operating costs, which are largely fixed, being spread across a growing production base.
Exhibit 31: Netbacks (2P scenario)
2018 |
2019 |
2020 |
2021 |
|
Realised price post-transport (US$/mcf) |
4.83 |
4.75 |
4.87 |
4.99 |
Royalty (US$/mcf) |
0.61 |
0.71 |
0.77 |
0.79 |
Opex (US$/mcf) |
0.42 |
0.31 |
0.31 |
0.32 |
Pre-tax netback (US$/mcf) |
3.80 |
3.73 |
3.79 |
3.88 |
Production (mmscfd) |
113.9 |
165.0 |
215.0 |
215.0 |
Royalty (%) |
12.6% |
15.0% |
15.8% |
15.8% |
Source: Edison Investment Research
Our 2P case forecasts a material reduction in net debt and gearing, assuming that cash generated is kept within the business. Excess cash is, in our view, likely to be directed to expanding the company’s footprint, possibility through acquisition or further licence rounds, but will still offer significant capacity for returns to shareholders. Key risks and uncertainties are described earlier in this note, but Canacol benefits from fixed-price 5- to 10-year gas contracts for the bulk of its production.
|
Exhibit 32: Pre-tax netbacks US$/mcf (2P scenario) |
Exhibit 33: Gearing and net debt/EBITDA (2P scenario)* |
|
|
|
Source: Edison Investment Research |
Source: Edison Investment Research. Note:*Excludes cash returns to shareholders. |
|
Exhibit 34: Gearing and net debt/EBITDA (215mmscfd scenario)* |
Exhibit 35: Gearing and net debt/EBITDA (315mmscfd scenario)* |
|
|
|
Source: Edison Investment Research. Note:*Excludes cash returns |
|
Exhibit 32: Pre-tax netbacks US$/mcf (2P scenario) |
|
|
Source: Edison Investment Research |
|
Exhibit 34: Gearing and net debt/EBITDA (215mmscfd scenario)* |
|
|
Source: Edison Investment Research. Note:*Excludes cash returns |
|
Exhibit 33: Gearing and net debt/EBITDA (2P scenario)* |
|
|
Source: Edison Investment Research. Note:*Excludes cash returns to shareholders. |
|
Exhibit 35: Gearing and net debt/EBITDA (315mmscfd scenario)* |
|
|
Source: Edison Investment Research. Note:*Excludes cash returns |
Below we look at FCF generation under our 2P, 215mmscfd, and 315mmscfd development scenarios, and also what shareholder returns could potentially look like if management were to move to a model of returning FCF to shareholders; and assuming an estimated cash yield in line with peer dividend payers. Our cash yield forecast is provided in Exhibit 37.
|
Exhibit 36: FCF forecasts |
Exhibit 37: Estimated cash yield |
|
|
|
Source: Edison Investment Research. Note: Labels refer to 2P numbers. |
|
Exhibit 36: FCF forecasts |
|
|
Source: Edison Investment Research. Note: Labels refer to 2P numbers. |
|
Exhibit 37: Estimated cash yield |
|
|
Source: Edison Investment Research. Note: Labels refer to 2P numbers. |
Exhibit 38: Financial summary (2P scenario before cash distributions)
|
|
US$m |
2016 |
2017 |
2018 |
2019e |
2020e |
2021e |
Year-end December |
|
|
IFRS |
IFRS |
IFRS |
IFRS |
IFRS |
IFRS |
PROFIT & LOSS |
||||||||
Revenue net of royalty and transport expense* |
|
148.3 |
156.6 |
204.5 |
243.2 |
321.8 |
329.9 |
|
Cost of sales (opex) |
(8.6) |
(25.0) |
(28.9) |
(18.5) |
(24.7) |
(25.3) |
||
Gross profit |
139.7 |
131.6 |
175.6 |
224.8 |
297.2 |
304.6 |
||
General & admin |
(21.6) |
(26.5) |
(28.2) |
(28.2) |
(28.2) |
(28.2) |
||
Share based payments |
(9.6) |
(11.6) |
(8.5) |
(8.7) |
(8.9) |
(9.1) |
||
Exploration expense |
(17.5) |
(27.1) |
(13.7) |
(14.0) |
(14.4) |
(14.7) |
||
EBITDA |
|
|
51.3 |
(54.3) |
86.1 |
173.9 |
245.7 |
252.6 |
Adjusted EBITDAX (before non-cash items, exploration expense, one-offs) |
130.2 |
138.6 |
196.6 |
269.0 |
276.4 |
|||
Depreciation |
(26.5) |
(35.8) |
(44.2) |
(58.9) |
(76.7) |
(76.7) |
||
Operating Profit (before amort. and except.) |
|
24.8 |
(90.0) |
41.9 |
115.0 |
169.0 |
175.8 |
|
Intangible amortisation |
- |
- |
- |
- |
- |
- |
||
Exceptionals |
- |
- |
- |
- |
- |
- |
||
Other |
- |
- |
- |
- |
- |
- |
||
EBIT |
24.8 |
(90.0) |
41.9 |
115.0 |
169.0 |
175.8 |
||
Net interest |
(22.7) |
(26.3) |
(34.5) |
(28.9) |
(28.7) |
(26.1) |
||
Profit Before Tax (norm) |
|
|
2.1 |
(116.4) |
7.3 |
86.0 |
140.3 |
149.7 |
Profit Before Tax (FRS 3) |
|
|
2.1 |
(116.4) |
7.3 |
86.0 |
140.3 |
149.7 |
Tax |
34.1 |
(32.4) |
(29.2) |
(27.4) |
(43.0) |
(47.9) |
||
Profit After Tax (norm) |
36.2 |
(148.8) |
(21.8) |
58.7 |
97.3 |
101.9 |
||
Profit After Tax (FRS 3) |
36.2 |
(148.8) |
(21.8) |
58.7 |
97.3 |
101.9 |
||
Average Number of Shares Outstanding (m) |
165.6 |
175.2 |
177.2 |
177.5 |
177.5 |
177.5 |
||
EPS - normalised (US$) |
|
|
0.22 |
(0.85) |
(0.12) |
0.33 |
0.55 |
0.57 |
EPS - normalised fully diluted (US$) |
|
|
0.22 |
(0.85) |
(0.12) |
0.33 |
0.55 |
0.57 |
EPS - (IFRS) (US$) |
|
|
0.22 |
(0.85) |
(0.12) |
0.33 |
0.55 |
0.57 |
Dividend per share (US$) |
- |
- |
- |
- |
- |
- |
||
Gross margin (%) |
94.21 |
84.01 |
85.87 |
92.41 |
92.34 |
92.34 |
||
EBITDA margin (%) |
34.59 |
(34.65) |
42.12 |
71.48 |
76.35 |
76.56 |
||
Operating margin (before GW and except.) (%) |
16.72 |
(57.49) |
20.48 |
47.28 |
52.50 |
53.30 |
||
BALANCE SHEET |
||||||||
Non-current assets |
|
|
670.8 |
499.8 |
580.3 |
626.4 |
563.1 |
504.1 |
Intangible assets |
151.1 |
43.9 |
39.6 |
85.5 |
71.2 |
56.4 |
||
Tangible assets |
364.3 |
383.4 |
480.4 |
480.5 |
431.6 |
387.4 |
||
Investments |
155.4 |
72.5 |
60.3 |
60.3 |
60.3 |
60.3 |
||
Current assets |
|
|
133.4 |
196.7 |
124.7 |
146.0 |
315.5 |
485.5 |
Stocks |
0.8 |
0.6 |
0.3 |
0.3 |
0.3 |
0.3 |
||
Debtors |
46.6 |
50.4 |
68.2 |
68.2 |
68.2 |
68.2 |
||
Cash |
66.3 |
39.1 |
51.6 |
72.9 |
242.4 |
412.3 |
||
Other/ restricted cash |
19.7 |
106.6 |
4.6 |
4.6 |
4.6 |
4.6 |
||
Current liabilities |
|
|
(97.5) |
(86.3) |
(69.3) |
(69.3) |
(69.3) |
(69.3) |
Creditors |
(75.3) |
(86.3) |
(69.3) |
(69.3) |
(69.3) |
(69.3) |
||
Short-term borrowings |
(22.2) |
- |
- |
- |
- |
- |
||
Long-term liabilities |
|
|
(330.3) |
(371.0) |
(430.3) |
(430.3) |
(430.3) |
(430.3) |
Long-term borrowings |
(228.4) |
(294.6) |
(339.7) |
(339.7) |
(339.7) |
(339.7) |
||
Other long-term liabilities (inc. decomm.) |
(101.9) |
(76.4) |
(90.6) |
(90.6) |
(90.6) |
(90.6) |
||
Net assets |
|
|
376.4 |
239.1 |
205.4 |
272.8 |
379.0 |
490.0 |
CASH FLOW |
||||||||
Operating cash flow |
|
|
73.6 |
65.3 |
94.0 |
170.0 |
227.1 |
232.2 |
Capex inc acquisitions** |
(76.2) |
(106.0) |
(75.5) |
(119.0) |
(27.8) |
(32.5) |
||
Finance expense |
(17.4) |
(21.2) |
(36.0) |
(29.7) |
(29.8) |
(29.7) |
||
Equity issued |
43.0 |
(1.9) |
(3.7) |
- |
- |
- |
||
Dividends |
- |
- |
- |
- |
- |
- |
||
Net cash flow |
23.0 |
(63.8) |
(21.2) |
21.3 |
169.5 |
170.0 |
||
Opening net debt/(cash) |
|
|
205.0 |
184.4 |
255.5 |
288.1 |
266.8 |
97.3 |
HP finance leases initiated |
- |
- |
- |
- |
- |
- |
||
Other |
(2.4) |
(7.4) |
(11.4) |
0.0 |
- |
- |
||
Closing net debt/(cash) |
|
|
184.3 |
255.5 |
288.1 |
266.8 |
97.3 |
(72.7) |
Source: Edison Investment Research, Canacol Energy accounts. Note:*Edison revenue forecast net of royalties and transport expenses; Canacol reports revenues net of royalties before transport expenses **215mmscfd and 315mmscfd plateau scenarios include materially higher capex.
|
|||||||||||||||||||||||||||||||||||||||||||||||||||||||
|
|
Research: TMT
Although a slowdown in demand for Vectron’s traditional point-of-sale (POS) systems had a negative effect on revenue growth and profitability in FY18, the company has made good progress in extending its offering into the digital domain. By supporting Vectron POS owners to offer loyalty and online services, partnerships with DeutschlandCard (DC) and Metro promise to deliver recurring revenues once the schemes are launched.