Evotec
Written by
Evotec |
Solid H116, 2016 EBITDA guidance upped |
Q216 results |
Pharma & biotech |
16 August 2016 |
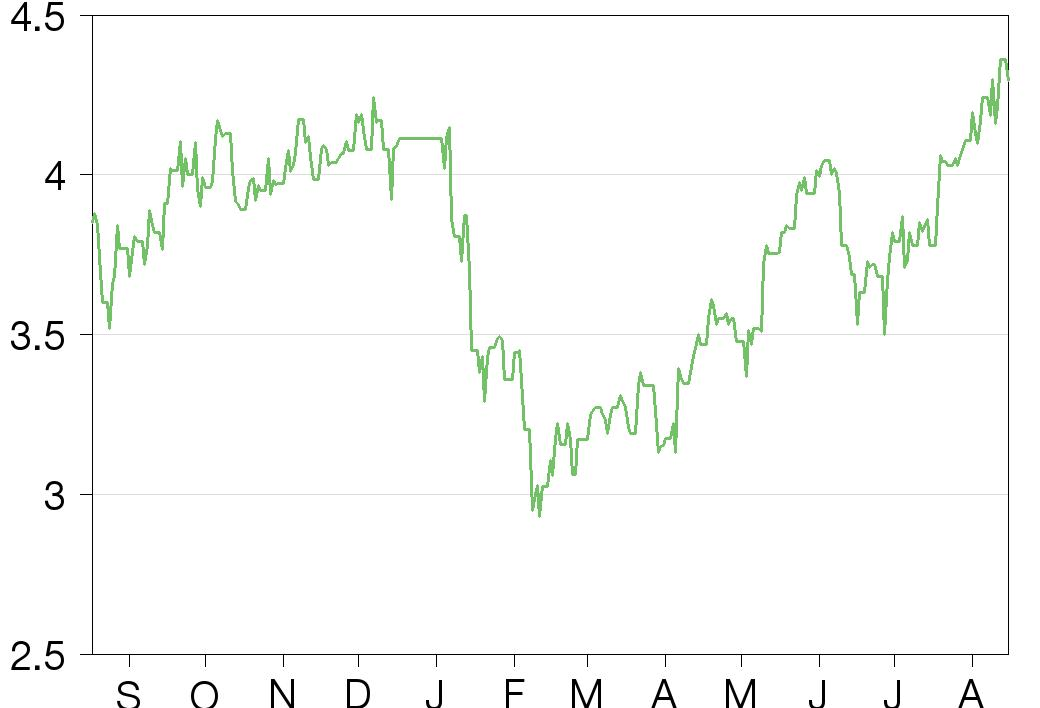
Share price performance
Business description
Next events
Analysts
Evotec is a research client of Edison Investment Research Limited |
|||||||||||||||||||||||||||||||||||||||||||||||||
Evotec delivered its Q216 and full H116 results last week, with sales largely in line with our expectations, while profits were boosted by lower than expected operating costs and higher other income. The company has raised its guidance and now expects adjusted EBITDA to more than double in 2016. Bayer’s move to Phase I with endometriosis is the most prominent news recently. Healthy cash flows and a maturing preclinical pipeline should support the share price in 2016 and 2017, in our view. We have increased our valuation to €620m from €575m.
Year |
Revenue (€m) |
PBT* |
EPS* |
DPS |
P/E |
Yield |
12/14 |
89.5 |
(0.7) |
(0.02) |
0.0 |
N/A |
N/A |
12/15 |
127.7 |
1.2 |
(0.01) |
0.0 |
N/A |
N/A |
12/16e |
157.4 |
15.0 |
0.07 |
0.0 |
61.4 |
N/A |
12/17e |
177.4 |
21.2 |
0.11 |
0.0 |
39.1 |
N/A |
Note: *PBT and EPS are normalised, excluding amortisation of acquired intangibles, exceptional items and share-based payments.
Sales in line, better profits, decent H216 ahead
Evotec’s Q216 revenues were largely in line with our expectations and grew 13.6% y-o-y to €38.0m driven by a strong performance in both segments: EVT Execute, the drug discovery services business, and EVT Innovate, the collaborative academic/pharma drug discovery business. Q216 also included Sanofi revenues, consolidated from Q215 and thus more reliably reflecting organic y-o-y growth. Adjusted Q216 EBITDA of €8.6m was better than our forecast of €4.2m, mainly due to lower operating costs and significant net other income. Evotec has raised its guidance for FY16 adjusted EBITDA and now expects it to more than double y-o-y.
Eventful H116, Bayer moves to Phase I
Evotec delivered a flurry of news in H116 from its existing partnerships or newly established ones. Most recently a major achievement was the decision of Evotec’s partner Bayer to progress with the endometriosis project into Phase I, which also triggered an undisclosed milestone payment. Both companies contributed to preclinical development, while Bayer will be solely responsible for clinical development. The deal with Bayer is valued at c €590m, with additional up to double-digit royalties, and centres around the endometriosis indication, which is a highly complex disease – difficult to manage, severely affecting women’s quality of life and therefore still representing a high unmet need, in our view.
Valuation: Increased to €620m or €4.7/share
We have increased our valuation of Evotec from €575.2m or c €4.3/share to €620.3m or c €4.7/share as a result of upgrading our earnings estimates, rolling our model forward by one quarter and Bayer’s progress with the endometriosis project into Phase I, as we have raised the probability of success from 5% to 10%. Healthy cash flows and a maturing preclinical pipeline should support the share price in 2016 and 2017, in our view.
Partner Bayer moves to Phase I with endometriosis
During H116 Evotec achieved a number of milestones from existing drug discovery partnerships within EVT Execute and EVT Innovate (Bayer and the endometriosis project, Padlock Therapeutics, Janssen), established new ones (Antibiotic Research UK, access to CRISPR-Cas9, Ellersbrook investment in TargetNASH, drug discovery in immuno-oncology with ex scientia, compound management for Pierre Fabre and UCB, Topas Therapeutics spin-out, grant from The Michael J. Fox Foundation) or extended those that came to an end, thus retaining clients (Genentech).
Fruitful partnership with Bayer
Originally, the partnership with Bayer was established in October 2012 with the goal of developing three clinical candidates for endometriosis. To date, the partners have identified four preclinical candidates, but Bayer did not disclose the clinical development strategy and clinical trial designs. Both companies contributed to preclinical development, while Bayer will be solely responsible for clinical development (Evotec’s strategy is not to invest in costly clinical development). The agreement triggered a €12m upfront payment, R&D and commercial milestone payments totalling up to €580 and additional up to double-digit royalties. In our view, the deal was rather attractive given the early stage of the project at the time of initiation.
Endometriosis – a high unmet need in women’s health
Endometriosis is defined as the ectopic growth of normal endometrial mucosa (inner lining of the uterus) outside the uterine cavity. It most often affects the pelvic organs, but could involve any organ system. The cause is not entirely clear, but because these lesions respond to hormonal changes associated with the menstrual cycle in a similar way to the intrauterine endometrium, the pain and adhesions are the main pathophysiological changes responsible for clinical symptoms (mainly pain, anatomic disruption due to adhesions affecting the internal organs and subfertility).
There is no cure for the disease, while management is based on intervention in the hormone balance in the woman’s reproductive system with medication such as contraceptives, progestational drugs, androgens, gonadotropin-releasing hormone analogues (responsible for the release of follicle-stimulating hormone and luteinizing hormone) or varying levels of surgical intervention ranging from minimally invasive separation of the adhesions to radical removal of the uterus and ovaries. When it comes to prognosis, around one-third of women were found to resolve spontaneously,1 but in those who progress the extent and the level of illness are unpredictable. Existing medical treatment is effective in terms of controlling pain, but fertility is often affected and as many as 50% of women relapse within five years.
Harrison RF, Barry-Kinsella C. Efficacy of medroxyprogesterone treatment in infertile women with endometriosis: a prospective, randomized, placebo-controlled study. Fertil Steril. 2000 Jul. 74(1):24-30.
We view endometriosis as a highly complex disease, which is difficult to manage, severely affects quality of life and therefore still represents a high unmet need. According to EvaluatePharma, the market size was $529m globally in 2016, with all leading drugs established and showing minimal growth rates. We therefore see untapped market potential for new and innovative approaches. Notably, Evotec and Bayer did not disclose their candidates’ mechanism of action, but this is a first-in-class technology.
Financials
Q2 revenues in line, profits better than expected
Evotec’s Q216 revenues grew 13.6% y-o-y to €38.0m, largely in line with our expectations (€36.2m). This included €41.2m (+14.4% y-o-y) from EVT Execute (including €8.7m of intersegment revenues) and €5.4m (+23.5%) from EVT Innovate. €3.4m (we expected €3.7m) of the total sales were upfront, milestone or other licence-related payments from third parties, with the remaining €34.6m coming from core drug discovery services business. The Q216 gross margin of 35.6% was slightly better than our forecast 34.1%, but reported gross profit of €13.5m was in line with our forecast of €13.6m. Notably, the gross margin improved significantly compared to 24.7% in Q215. During the conference call, management attributed the improvement in gross margin to a combination of favourable cost of revenue and much larger milestone payments.
R&D expenses of €4.7m were lower than our forecast of €5.3m, as well as reported SG&A of €6.4m versus our estimate of €7.0m. Evotec’s Q216 operating profit was further boosted by net other income of €3.1m (mainly R&D tax credits) and came in at €5.6m versus our estimate of €1.3m. Reported net income came in at €3.9m, as higher than expected net non-operating income was more than offset by a higher than expected tax expense. We previously forecast a largely break-even quarter at the net profit level (€780k).
2016 EBITDA guidance upped
Evotec now expects 2016 EBITDA, adjusted for contingent considerations, to more than double year-on-year, while the previous expectation was positive and significantly improved vs €8.7m in 2015. Other guidance for 2016 remains unchanged:
■
Base revenues (excluding milestones, upfronts and licences) should grow more than 15%.
■
R&D expenses are expected at c €20m.
■
Cash should stay at a similar level to 2015.
■
Capital expenditure should be up to €10m.
Our updated profitability expectations are based on better margins and positive prospects for the top line. We note a strong increase in gross margin in Q216 and in H116 in general. To some extent, this was influenced by significant income from milestones, upfronts and licence payments in H116, which strongly contributes to gross margin. Licence payments tend to be less predictable, as they are achieved on milestones from partnerships with third parties or on the initiation of new partnerships. However, during the conference call, management indicated sufficient portfolio visibility to expect similar licence income in H216. Notably, the milestone payment from Bayer after initiation of the Phase I trial falls into Q316. We project gross margins of 34% and 36% for 2016 and 2017 respectively.
Estimate revision
We have made only minimal changes to our top-line forecasts and continue to expect double-digit total sales growth of 23% and 13% to €157.4m and €177.4m in 2016 and 2017 respectively. We see base revenues (excluding milestones, upfronts and licences) growing by 19% and 9% in 2016 and 2017. The acceleration in growth in 2016 is partly because of the Sanofi deal in Q215, from which Evotec will receive €250m over five years (for more detail, see our previous report).
While we maintain our gross margin forecasts, we have slightly revised our operating expense estimates downwards, which improves adjusted 2016/17 EBITDA. Our adjusted EBITDA for 2016, which we now expect to triple y-o-y, was also boosted by significant net other income in Q216, as detailed above.
Evotec remains in a strong financial position, with gross cash of €118m (net cash €100m) at Q216. This means it can still make more bolt-on acquisitions to develop its expertise further and ensure that it remains a technological leader in the field of drug discovery, although it has not yet provided any indications in this direction.
Exhibit 1: Summary of the main changes to our Evotec financial forecasts
€000s |
2015 |
2016e |
2017e |
||||
Reported |
Old |
New |
% change |
Old |
New |
% change |
|
Revenues |
127,677 |
159,423 |
157,431 |
-1% |
179,833 |
177,399 |
-1% |
Underlying revenues* |
115,400 |
144,708 |
143,067 |
-1% |
158,703 |
156,269 |
-2% |
Gross profit |
37,987 |
53,851 |
53,767 |
-0% |
64,320 |
63,971 |
-1% |
Gross margin |
29.8% |
33.8% |
34.2% |
0.4pp |
35.8% |
36.1% |
0.3pp |
Research and development costs |
(18,343) |
(20,717) |
(18,788) |
-9% |
(22,158) |
(19,254) |
-13% |
Selling, general and administration costs |
(25,166) |
(25,468) |
(24,874) |
-2% |
(26,631) |
(25,987) |
-2% |
Adjusted EBITDA** |
8,690 |
19,152 |
26,594 |
+39% |
24,990 |
30,517 |
+22% |
Adjusted EBITDA% |
6.8% |
12.0% |
16.9% |
4.9pp |
13.9% |
17.2% |
3.3pp |
Operating Profit (reported) |
11,640 |
5,992 |
13,333 |
+123% |
13,390 |
18,834 |
+41% |
Operating Profit% |
9.1% |
3.8% |
8.5% |
4.7pp |
7.4% |
10.6% |
3.2pp |
Profit Before Tax (norm) |
1,179 |
6,968 |
14,981 |
+115% |
15,456 |
21,221 |
+37% |
Profit After Tax (norm) |
(1,462) |
4,362 |
9,773 |
+124% |
11,757 |
15,914 |
+35% |
EPS (€, norm) |
(0.01) |
0.02 |
0.07 |
+225% |
0.08 |
0.11 |
+48% |
Source: Edison Investment Research, Evotec. Note: *Underlying revenues exclude milestones, upfront and licence payments. **EBITDA adjusted for changes in contingent considerations.
Valuation
We have increased our valuation of Evotec €575.2m or c €4.3/share to €620.3m or c €4.7/share due revising our estimates, rolling our model forward by one quarter and Bayer’s progress with the endometriosis project into Phase I. In the case of the latter, we have only adjusted the probability of success of reaching the market from 5% to 10%, while our other assumptions remain unchanged, as we have already assumed that this project will move to Phase I in H216 (see our previous report).
We maintain our valuation approach, which includes a DCF model for the services business and separate risk-adjusted NPV models for the R&D programmes. For Evotec’s drug discovery business, we use a DCF model with a cost of capital of 10%, terminal growth rate of 2.5%, a long-term operating profit margin of c 25% achievable within the next 10 years and maintenance capex of around €10m. In our R&D pipeline valuation, we include the most advanced clinical- and preclinical-stage products, for which we keep our assumptions unchanged.
Exhibit 2: Evotec summary of risk-adjusted DCF valuation
Value |
Value/share |
Probability |
Risk-adjusted value (€m) |
Risk-adjusted value/share (€) |
|
Drug alliance business |
417.4 |
3.14 |
1.00 |
417.4 |
3.14 |
Clinical-stage R&D assets |
|
|
|||
EVT201 |
17.8 |
0.13 |
30% |
5.3 |
0.04 |
EVT401 |
63.9 |
0.48 |
30% |
19.2 |
0.14 |
Undisclosed programmes |
193.1 |
1.45 |
10% |
19.3 |
0.15 |
Endometriosis |
258.8 |
1.95 |
10% |
25.9 |
0.19 |
Preclinical-stage R&D assets |
|
|
|||
EVT770 |
151.2 |
1.14 |
5% |
7.6 |
0.06 |
EVT801/701/601 |
230.5 |
1.74 |
5% |
11.5 |
0.09 |
Multiple sclerosis |
456.8 |
3.44 |
5% |
9.1 |
0.07 |
Microbiome |
96.7 |
0.73 |
5% |
4.8 |
0.04 |
Net cash (at end Q216) |
100.1 |
0.75 |
100% |
100.1 |
0.75 |
Total |
1,986.2 |
14.96 |
|
620.3 |
4.67 |
Source: Edison Investment Research. Note: WACC = 10% for drug discovery business; WACC = 12.5% for product valuations.
Exhibit 3: Financial summary
€'000s |
2012 |
2013 |
2014 |
2015 |
2016e |
2017e |
||
Year end 31 December |
IFRS |
IFRS |
IFRS |
IFRS |
IFRS |
IFRS |
||
PROFIT & LOSS |
||||||||
Revenue |
|
|
87,265 |
85,938 |
89,496 |
127,677 |
157,431 |
177,399 |
Cost of Sales |
(56,242) |
(54,715) |
(60,118) |
(89,690) |
(103,664) |
(113,428) |
||
Gross Profit |
31,023 |
31,223 |
29,378 |
37,987 |
53,767 |
63,971 |
||
Adjusted EBITDA |
|
|
10,217 |
10,394 |
7,711 |
8,690 |
26,594 |
30,517 |
Operating Profit (before GW and except.) |
3,071 |
7,392 |
(1,942) |
328 |
17,086 |
21,100 |
||
Intangible Amortisation |
(2,768) |
(3,222) |
(2,462) |
(2,860) |
(2,336) |
(2,266) |
||
Other |
(3,311) |
2,430 |
(926) |
5,850 |
4,645 |
105 |
||
Exceptionals |
(3,505) |
(25,521) |
(1,977) |
14,172 |
(1,417) |
0 |
||
Operating Profit |
(3,202) |
(21,351) |
(6,381) |
11,640 |
13,333 |
18,834 |
||
Net Interest |
(1,204) |
(1,609) |
(1,152) |
(1,193) |
(1,368) |
121 |
||
Other |
(608) |
(688) |
2,374 |
2,044 |
(737) |
0 |
||
Profit Before Tax (norm) |
|
|
1,259 |
5,095 |
(720) |
1,179 |
14,981 |
21,221 |
Profit Before Tax (FRS 3) |
|
|
(5,014) |
(23,648) |
(5,159) |
12,491 |
11,228 |
18,955 |
Tax |
(793) |
(299) |
(1,858) |
(2,641) |
(5,208) |
(5,307) |
||
Deferred tax |
8,285 |
(1,486) |
39 |
6,666 |
(147) |
0 |
||
Profit After Tax (norm) |
466 |
4,796 |
(2,578) |
(1,462) |
9,773 |
15,914 |
||
Profit After Tax (FRS 3) |
2,478 |
(25,433) |
(6,978) |
16,516 |
5,874 |
13,647 |
||
Average Number of Shares Outstanding (m) |
117.3 |
121.2 |
131.3 |
131.7 |
132.4 |
132.4 |
||
EPS - normalised (EUR) |
|
|
0.00 |
0.04 |
(0.02) |
(0.01) |
0.07 |
0.11 |
EPS - FRS 3 (EUR) |
|
|
0.02 |
(0.21) |
(0.05) |
0.13 |
0.04 |
0.10 |
Dividend per share (EUR) |
0.00 |
0.00 |
0.00 |
0.00 |
0.00 |
0.00 |
||
Gross Margin (%) |
35.6 |
36.3 |
32.8 |
29.8 |
34.2 |
36.1 |
||
EBITDA Margin (%) |
11.7 |
12.1 |
8.6 |
6.8 |
16.9 |
17.2 |
||
Operating Margin (before GW and except.) (%) |
3.5 |
8.6 |
-2.2 |
0.3 |
10.9 |
11.9 |
||
BALANCE SHEET |
||||||||
Fixed Assets |
|
|
137,323 |
104,854 |
99,300 |
121,598 |
116,514 |
112,814 |
Intangible Assets |
105,608 |
79,962 |
75,025 |
70,802 |
64,029 |
61,763 |
||
Tangible Assets |
27,181 |
24,239 |
24,045 |
38,334 |
37,666 |
36,232 |
||
Other |
4,534 |
653 |
230 |
12,462 |
14,819 |
14,819 |
||
Current Assets |
|
|
88,104 |
122,526 |
125,300 |
166,940 |
158,603 |
183,389 |
Stocks |
2,445 |
2,358 |
3,111 |
3,133 |
4,027 |
4,406 |
||
Debtors |
15,053 |
17,777 |
25,259 |
21,069 |
24,154 |
27,217 |
||
Cash |
64,159 |
96,143 |
88,822 |
133,940 |
121,266 |
142,610 |
||
Other |
6,447 |
6,248 |
8,108 |
8,798 |
9,156 |
9,156 |
||
Current Liabilities |
|
|
(33,882) |
(38,953) |
(33,068) |
(56,400) |
(46,049) |
(52,854) |
Creditors |
(20,659) |
(21,731) |
(19,705) |
(42,187) |
(35,733) |
(42,538) |
||
Short term borrowings |
(13,223) |
(17,222) |
(13,363) |
(14,213) |
(10,316) |
(10,316) |
||
Long Term Liabilities |
|
|
(38,998) |
(29,460) |
(33,149) |
(45,044) |
(39,199) |
(39,583) |
Long term borrowings |
(4,178) |
0 |
(8,186) |
(8,730) |
(7,881) |
(7,881) |
||
Other long term liabilities |
(34,820) |
(29,460) |
(24,963) |
(36,314) |
(31,318) |
(31,702) |
||
Net Assets |
|
|
152,547 |
158,967 |
158,383 |
187,094 |
189,869 |
203,766 |
CASH FLOW |
||||||||
Operating Cash Flow |
|
|
12,175 |
7,083 |
(3,701) |
16,344 |
6,980 |
30,011 |
Net Interest |
111 |
(237) |
41 |
102 |
(1,001) |
121 |
||
Tax |
(329) |
(190) |
(137) |
(792) |
(444) |
(805) |
||
Capex |
(10,129) |
(4,607) |
(5,282) |
(11,496) |
(9,246) |
(7,983) |
||
Acquisitions/disposals |
(3,000) |
(1,150) |
(2,436) |
37,114 |
0 |
0 |
||
Financing |
701 |
32,398 |
658 |
1,971 |
478 |
0 |
||
Dividends |
0 |
0 |
0 |
0 |
0 |
0 |
||
Other |
0 |
(159) |
(1,813) |
(551) |
(2,000) |
0 |
||
Net Cash Flow |
(471) |
33,138 |
(12,670) |
42,692 |
(5,233) |
21,344 |
||
Opening net debt/(cash) |
|
|
(46,895) |
(46,758) |
(78,921) |
(67,273) |
(110,997) |
(103,069) |
HP finance leases initiated |
0 |
0 |
0 |
0 |
0 |
0 |
||
Exchange rate movements |
(953) |
501 |
(792) |
(1,072) |
2,609 |
0 |
||
Other |
1287 |
(1,476) |
1814 |
2,104 |
(5,304) |
0 |
||
Closing net debt/(cash) |
|
|
(46,758) |
(78,921) |
(67,273) |
(110,997) |
(103,069) |
(124,413) |
Source: Edison Investment Research, Evotec accounts. Note: *EBITDA is adjusted for changes in contingent considerations and income from bargain purchases.
|
|