Eckoh |
Strengthening the US opportunity |
H116 interims |
Software & comp services |
20 November 2015 |
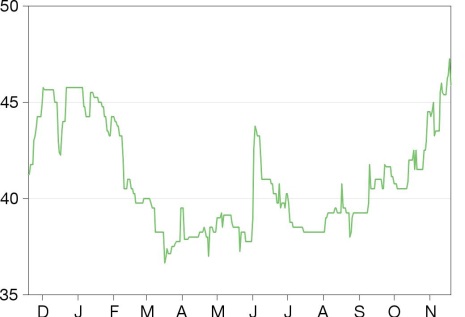
Share price performance
Business description
Next event
Analysts
Eckoh is a research client of Edison Investment Research Limited |
|||||||||||||||||||||||||||||||||||||||||||||||
Eckoh’s interim results confirmed that the company is on track to meet FY16 expectations. To support its US growth ambitions and to drive cross-selling opportunities, the company has acquired PSS for a net cost of £3.7m. We have incorporated PSS into our forecasts, driving earnings upgrades for FY16e/17e. Successful integration of PSS, progress with cross-selling opportunities and contract wins via its US channel partner could drive upside to our forecasts and the share price.
Year end |
Revenue (£m) |
PBT* |
EPS* |
DPS |
P/E |
Yield |
03/14 |
14.0 |
2.3 |
0.89 |
0.31 |
51.6 |
0.7 |
03/15 |
17.2 |
3.4 |
1.36 |
0.37 |
33.8 |
0.8 |
03/16e |
22.2 |
4.2 |
1.65 |
0.40 |
27.8 |
0.9 |
03/17e |
29.4 |
5.2 |
2.03 |
0.43 |
22.6 |
0.9 |
Note: *PBT and EPS are normalised, excluding amortisation of acquired intangibles, exceptional items and share-based payments.
H116 results on track for Eckoh business
Eckoh reported H116 revenue growth of 10% y-o-y, with gross margin expansion to 82%, EBITDA +30% y-o-y and normalised EBIT +44% y-o-y. H116 revenues were 8% lower h-o-h, demonstrating typical seasonality. Management expects a strong H216, as customers typically see higher volumes of business in H2, and sees trading in line with market expectations. The company maintained its strong customer retention (100% of all contracts up for renewal in the period) and signed eight new contracts in the UK and four in the US.
PSS acquisition supports US growth ambitions
The company has acquired Product Support Solutions Inc (PSS), a US company that provides management of contact centre and user experience technology. The business has customers in the US, the UK and Australia, and generated revenues of $17.4m and PBT of $1.2m in CY14. Eckoh has paid net $3.6m/£2.4m in cash (funded via the refinancing of debt) and will issue shares worth $2m/£1.3m. Management sees PSS as a route to cross-sell to additional customers in the US, as well as providing support capability for the group’s growing US customer base.
Changes to forecasts and valuation
We have maintained our EBIT forecasts for the underlying Eckoh business for FY16 and FY17 and incorporated conservative assumptions for the PSS deal. We forecast revenue growth of 31% in FY16 and FY17. While dilutive to operating margins, the acquisition is accretive to EPS: we raise our EPS forecast by 4.9% for FY16 and 8.6% for FY17. The stock has performed well since the Netcall acquisition fell through, gaining 24% from its low of 37p in August. On our new FY17e forecasts, Eckoh is trading on a P/E of 22.6x and EV/EBITDA of 15.5x. This is at a premium to its peer group, but if the company is able to leverage the PSS acquisition to drive cross-selling and accelerate US sales, as well as show progress with the West relationship, this could drive upside to our forecasts.
Acquisition of PSS expands service capabilities
The company announced that it has acquired Product Support Solutions Inc (PSS), a US specialist in the management of contact centre and user experience technology. PSS services include providing support for legacy systems that are no longer supported by the original vendor, design and deployment of new systems, and transitioning existing architecture. Examples of technology supported include Aspect, Avaya, Genesys, Microsoft and Nuance. Its staff of 76 remote workers supports contact centre operations in the US, the UK and Australia; customers include AT&T, Bank of America, CenturyLink, Telstra and Vodafone.
Deal rationale
The deal helps expand Eckoh’s product offerings, offers cross-selling opportunities and supports its growth ambitions in the US.
Broader contact centre offering
The deal adds to the company’s product and service offering, encompassing a broader range of contact centre solutions. In particular it adds agent desktop solutions, an area in which Eckoh has not operated before. PSS is the global reseller (excluding Australia) of Coral unified communications software – this integrates information from disparate contact centre systems into one unified view for contact agents using a web browser – and Eckoh sees good potential to sell this solution across its customer base.
Cross-selling and geographic expansion
PSS has a sales team of 8-9 people, based in the US and the UK. This adds direct sales capability to Eckoh’s existing two-strong direct sales team in the US. For example, the company expects to have PSS staff trained up to sell Haloh within the next few months. PSS operates in Australia solely via contractors – Eckoh will assess this market before deciding whether to expand operations there. Management is also keen to sell its existing solutions into the PSS customer base.
Strengthens support available in the US
As part of its expansion into the US, Eckoh is marketing the on-premise hardware solution, CallGuard OnSite, which it inherited when it acquired Veritape in 2013. Although it is relatively simple to install the hardware (with many customers doing this without any input from Eckoh), the company is keen to build up its support capabilities so that it has adequate resources to support any large-scale deployments, particularly for any contracts signed via West1.
See Focus on organic growth – August 2015.
Acquisition terms
Eckoh is paying for the deal in cash ($5.6m/£3.7m) and equity (2,967,084 shares worth £1.3m at 43.18p – the average price over the last 20 dealing days prior to the acquisition), resulting in a total cost of $7.6m/£5.0m. The acquired business has a net cash position of $2.0/£1.3m, so the net cost to Eckoh is $5.6m/£3.7m. To fund the deal, Eckoh has renegotiated its debt facility. It now has a £5m five-year term loan, repayable at £250k/quarter. This replaces the existing loan (£2.4m at the end of FY15) that funded the purchase of the freehold for the company’s HQ in Hemel Hempstead. The first tranche of shares (1,442,925) has been issued, with the second tranche (1,524,159) payable on the first anniversary of the acquisition, subject to any warranty claims. The shares are locked up for two years from the date of the acquisition.
Financials and valuation
In CY14, PSS generated revenues of $17.4m and PBT of $1.2m (margin 6.9%). With an EV of $5.6m, this values the acquisition on a historic EV/sales multiple of 0.3x and EV/PBT multiple of 4.7x, compared to an EV/sales multiple of 6.0x and EV/PBT multiple of 30.6x for Eckoh, based on FY15 numbers.
The company noted that c $4.0m of CY14 revenues would be accounted for on a different basis using Eckoh’s accounting policies. Eckoh would account for this business on an agency basis, instead recognising the profit of $0.2m as agency fees – this would have no impact on the PBT figure of $1.2m, but reducing reported revenues to c $13.4m would increase the PBT margin to 9.0% (versus Eckoh’s PBT margin of 19.8% in FY15).
Review of H116 results
Eckoh reported 10% y-o-y growth for H116, which, combined with a 10 percentage point increase in gross margins, resulted in a 26% increase in gross profit. Recurring revenues made up 78% of total revenues, compared to 76% in FY15. Operating expenses (excluding depreciation and amortisation) grew 24% y-o-y, resulting in a 30% increase in EBITDA. With depreciation and amortisation relatively flat y-o-y, normalised EBIT grew 44% y-o-y. The company continues to make use of historic trading losses, recognising a £131k deferred tax credit in the period. Net cash was £1.3m at the end of H116, compared to £1.7m at the end of FY15. Working capital outflows totalled £1.2m, as payments owing for licences acquired towards the end of FY15 were made in the period. The company incurred exceptional costs of £369k for the attempt to acquire Netcall (compared to our forecast of £500k).
Exhibit 1: Half-yearly results highlights
£000s |
H115 |
H116 |
y-o-y (%) |
Revenues |
7,780 |
8,585 |
10.3 |
Gross margin |
72.3% |
82.5% |
10.1 |
EBITDA |
1,566 |
2,032 |
29.8 |
EBITDA margin |
20.1% |
23.7% |
3.5 |
Normalised EBIT |
1,028 |
1,476 |
43.6 |
EBIT |
(112) |
104 |
(192.9) |
Net interest income |
10 |
(30) |
(400.0) |
Normalised PBT |
1,038 |
1,446 |
39.3 |
PBT |
109 |
74 |
(32.1) |
Tax |
10 |
131 |
1210.0 |
Normalised net income |
1,038 |
1,446 |
39.3 |
Net income |
119 |
205 |
72.3 |
Normalised diluted EPS (p) |
0.42 |
0.57 |
35.3 |
Basic reported EPS (p) |
0.05 |
0.09 |
66.4 |
Net cash |
4,148 |
1,254 |
(69.8) |
Source: Eckoh
Business update
The company continues to make progress with its strategic objectives:
■
Establish and expand US footprint to capitalise on secure payment opportunities. Since the company reported FY15 results in June, it has signed a further four contracts in the US, to reach a cumulative total of 10 won via its direct sales team.
■
Leverage channel partners in both UK and US markets. The company estimates that 31% of H116 revenues came via channel partners, representing 23% of clients. Eckoh has three major contracts with Capita and after recently renewing its framework agreement for five years, expects to win additional large contracts from this relationship. In the US, the company continues to work with West – while no contracts have been signed yet, contract negotiations are underway and the company hopes to be able to announce something by the end of FY16. We note that the contracts being discussed via West are substantially larger than any of the contracts that Eckoh has signed to date in the US.
■
Bring Haloh, the new tokenisation payment product, to market. The first contract was signed with Sensée in H116 and the company sees high levels of interest in this product. Since the end of H116, Eckoh has announced a three-year contract to provide its Haloh solution to a global multi-media retailer. Haloh provides tokenisation of credit and debit card data so unencrypted data is not kept in the contact centre environment. The company believes that this product will become its most popular over time, reflecting the growing need for companies to keep customer data secure.
■
Continue to invest in R&D to underpin next-generation product development and maintain market-leading position. To add to its UK patent for CallGuard, the company recently announced that it had been granted a US patent for its CallGuard technology. The company has filed a patent application for Haloh.
■
Maximise client value through cross-selling. While the majority of the pipeline and new business wins have been for payment solutions, the majority of revenues are still generated from customer service solutions. The company is keen to sell customer service solutions to its payments customer base and vice versa, and has put in place internal sales targets and sales incentives to encourage staff to focus on this. Currently 66% of Eckoh clients use at least one secure payment solution, and 18% use only one, representing an opportunity for upsell.
■
Continue to evaluate acquisition opportunities. Even after the PSS acquisition, the company continues to consider acquisitions that could complement the product base or accelerate geographic expansion.
We also note that in the core UK business, Eckoh renewed all 13 contracts that came up for renewal in H116. This included a three-year contract with Vue Cinemas, which has been a customer for more than 10 years, and a two-year renewal for its highest-margin customer. The UK business also won eight new contracts; new customers include Co-operative Group, Arvato Services, Sensée (Haloh) and ComAir.
Changes to forecasts
The company expects to see its usual seasonal weighting to the business in H216 and continues to see trading in line with market expectations. We have incorporated the PSS acquisition and revised our forecasts for the underlying business to take account of the H116 results.
■
Revenues: for PSS, accounting for the $4m in agency fees and taking a conservative view of PSS’s prospects (as recurring revenues are lower than for Eckoh), we factor in revenue of $6m for H216 (pro-rated) and $12m for FY17e.
■
EBIT: we have left our forecasts for the underlying Eckoh business substantially unchanged at the EBIT level, although we have made changes to the split of costs between cost of sales and opex. We assume that the PSS acquisition adds £0.2m to EBIT in FY16e and £0.5m in FY17e. We do not assume material cost synergies from the acquisition.
■
Finance costs: we have factored in the interest on the new £5m term loan.
■
EPS: our normalised EPS forecast increases 4.9% from 1.57p to 1.65p in FY16 and 8.6% from 1.87p to 2.03p in FY17e.
■
Net cash: taking into account the cost of acquiring PSS (£2.4m) and higher than expected working capital, our net cash forecast falls from £4.5m to £0.5m at the end of FY16 and from £8.5m to £3.0m at the end of FY17.
Exhibit 2: Changes to forecasts
£'000 |
FY16e old |
FY16e new |
Change |
y-o-y |
FY17e old |
FY17e new |
Change |
y-o-y |
Revenues |
19,330 |
22,191 |
14.8% |
29.3% |
21,562 |
29,409 |
36.4% |
32.5% |
Gross profit |
15,180 |
16,748 |
10.3% |
127.8% |
17,150 |
20,391 |
18.9% |
21.8% |
Gross margin |
78.5% |
75.5% |
-3.1% |
-0.9% |
79.5% |
69.3% |
-10.2% |
-6.1% |
EBITDA |
5,480 |
5,391 |
-1.6% |
20.7% |
6,500 |
6,550 |
0.8% |
21.5% |
EBITDA margin |
28.3% |
24.3% |
-4.1% |
-1.7% |
30.1% |
22.3% |
-7.9% |
-2.0% |
Normalised EBIT |
4,020 |
4,241 |
5.5% |
25.2% |
4,750 |
5,250 |
10.5% |
23.8% |
Normalised EBIT margin |
20.8% |
19.1% |
-1.7% |
-0.6% |
22.0% |
17.9% |
-4.2% |
-1.3% |
Normalised PBT |
3,956 |
4,160 |
5.1% |
22.7% |
4,705 |
5,155 |
9.6% |
23.9% |
Normalised net income |
3,956 |
4,160 |
5.1% |
22.7% |
4,705 |
5,155 |
9.6% |
23.9% |
Normalised EPS (p) |
1.57 |
1.65 |
4.9% |
20.8% |
1.87 |
2.03 |
8.6% |
23.5% |
Reported EPS (p) |
0.58 |
0.59 |
1.7% |
-38.0% |
1.10 |
1.27 |
15.1% |
113.8% |
Net cash |
4,527 |
498 |
-89.0% |
-70.3% |
8,515 |
2,954 |
-65.3% |
493.2% |
Source: Edison Investment Research
Exhibit 3: Financial summary
£'000s |
2011 |
2012 |
2013 |
2014 |
2015 |
2016e |
2017e |
||
Year end 31 March |
IFRS |
IFRS |
IFRS |
IFRS |
IFRS |
IFRS |
IFRS |
||
PROFIT & LOSS |
|||||||||
Revenue |
|
|
9,003 |
10,392 |
10,985 |
14,035 |
17,158 |
22,191 |
29,409 |
Cost of Sales |
(2,340) |
(2,497) |
(2,691) |
(3,820) |
(4,055) |
(5,443) |
(9,018) |
||
Gross Profit |
6,663 |
7,895 |
8,294 |
10,215 |
13,103 |
16,748 |
20,391 |
||
EBITDA |
|
|
1,426 |
2,111 |
2,421 |
3,196 |
4,468 |
5,391 |
6,550 |
Operating Profit (before amort acq intang, SBP and except.) |
690 |
1,257 |
1,489 |
2,202 |
3,388 |
4,241 |
5,250 |
||
Amortisation of acquired intangibles |
0 |
0 |
0 |
(990) |
(1,320) |
(1,320) |
(1,320) |
||
Exceptionals |
(1,340) |
100 |
0 |
(1,389) |
991 |
(369) |
0 |
||
Share-based payments |
(63) |
(150) |
(375) |
(1,247) |
(939) |
(686) |
(400) |
||
Operating Profit |
(713) |
1,207 |
1,114 |
(1,424) |
2,120 |
1,866 |
3,530 |
||
Net Interest |
121 |
49 |
74 |
57 |
1 |
(81) |
(95) |
||
Profit Before Tax (norm) |
|
|
788 |
1,306 |
1,563 |
2,259 |
3,389 |
4,160 |
5,155 |
Profit Before Tax (FRS 3) |
|
|
(615) |
1,256 |
1,188 |
(1,367) |
2,121 |
1,785 |
3,435 |
Tax |
316 |
1,320 |
720 |
1,665 |
(16) |
(458) |
(567) |
||
Profit After Tax (norm) |
1104 |
1306 |
1563 |
2259 |
3389 |
4160 |
5155 |
||
Profit After Tax (FRS3) |
(299) |
2,576 |
1,908 |
298 |
2,105 |
1,327 |
2,868 |
||
Average Number of Shares Outstanding (m) |
199.8 |
199.8 |
204.8 |
214.6 |
220.0 |
223.9 |
226.4 |
||
EPS - normalised (p) |
|
|
0.54 |
0.62 |
0.73 |
0.89 |
1.36 |
1.65 |
2.03 |
EPS - FRS 3 (p) |
|
|
(0.12) |
1.29 |
0.93 |
0.14 |
0.96 |
0.59 |
1.27 |
DPS (p) |
0.10 |
0.20 |
0.25 |
0.31 |
0.37 |
0.40 |
0.43 |
||
Gross Margin (%) |
74.0% |
76.0% |
75.5% |
72.8% |
76.4% |
75.5% |
69.3% |
||
EBITDA Margin (%) |
15.8% |
20.3% |
22.0% |
22.8% |
26.0% |
24.3% |
22.3% |
||
Operating Margin (before am and except.) (%) |
7.7% |
12.1% |
13.6% |
15.7% |
19.7% |
19.1% |
17.9% |
||
BALANCE SHEET |
|||||||||
Fixed Assets |
|
|
1,955 |
3,194 |
3,535 |
14,765 |
18,446 |
20,753 |
18,466 |
Intangible Assets |
607 |
386 |
311 |
9,636 |
8,317 |
11,031 |
9,711 |
||
Tangible Assets |
1,348 |
1,488 |
1,184 |
862 |
5,191 |
5,241 |
4,841 |
||
Loans and other receivables |
0 |
1,320 |
2,040 |
4,267 |
4,938 |
4,480 |
3,913 |
||
Current Assets |
|
|
8,788 |
9,972 |
11,828 |
11,021 |
11,676 |
11,932 |
15,588 |
Stocks |
4 |
19 |
0 |
104 |
224 |
246 |
271 |
||
Debtors |
3,097 |
3,583 |
3,331 |
3,576 |
7,033 |
6,688 |
8,863 |
||
Cash |
5,687 |
6,370 |
8,497 |
7,341 |
4,419 |
4,998 |
6,454 |
||
Current Liabilities |
|
|
(2,319) |
(2,261) |
(2,204) |
(7,396) |
(6,853) |
(6,811) |
(5,517) |
Creditors |
(2,319) |
(2,261) |
(2,204) |
(7,396) |
(6,217) |
(5,811) |
(4,517) |
||
Short term borrowings |
0 |
0 |
0 |
0 |
(636) |
(1,000) |
(1,000) |
||
Long Term Liabilities |
|
|
(43) |
(43) |
(43) |
(4,107) |
(3,603) |
(4,362) |
(3,362) |
Long term borrowings |
0 |
0 |
0 |
0 |
(2,105) |
(3,500) |
(2,500) |
||
Other long term liabilities |
(43) |
(43) |
(43) |
(4,107) |
(1,498) |
(862) |
(862) |
||
Net Assets |
|
|
8,381 |
10,862 |
13,116 |
14,283 |
19,666 |
21,512 |
25,175 |
CASH FLOW |
|||||||||
Operating Cash Flow |
|
|
847 |
1,507 |
2,520 |
4,816 |
680 |
3,645 |
4,350 |
Net Interest |
28 |
49 |
74 |
55 |
1 |
(81) |
(95) |
||
Tax |
316 |
0 |
0 |
0 |
(101) |
0 |
0 |
||
Capex |
(933) |
(773) |
(553) |
(958) |
(5,410) |
(1,550) |
(900) |
||
Acquisitions/disposals |
0 |
100 |
0 |
(3,599) |
0 |
(2,368) |
0 |
||
Financing |
1,475 |
0 |
493 |
(930) |
(138) |
0 |
0 |
||
Dividends |
0 |
(200) |
(407) |
(540) |
(695) |
(826) |
(899) |
||
Net Cash Flow |
1,733 |
683 |
2,127 |
(1,156) |
(5,663) |
(1,180) |
2,456 |
||
Opening net debt/(cash) |
|
|
(3,887) |
(5,687) |
(6,370) |
(8,497) |
(7,341) |
(1,678) |
(498) |
HP finance leases initiated |
0 |
0 |
0 |
0 |
0 |
0 |
0 |
||
Other |
67 |
(0) |
0 |
0 |
0 |
0 |
0 |
||
Closing net debt/(cash) |
|
|
(5,687) |
(6,370) |
(8,497) |
(7,341) |
(1,678) |
(498) |
(2,954) |
Source: Eckoh, Edison Investment Research
|