Last close As at 05/08/2026
EUR21.35
▲ 0.05 (0.23%)
Market capitalisation
EUR376m
Research: Investment Companies
Deutsche Beteiligungs
Written by
Deutsche Beteiligungs |
Increased scale offers greater opportunities |
Investment companies |
31 January 2017 |
Share price/premium performance
Three-year performance vs index
Gearing
Analysts
|
|||||||||||||||||||||||||||||||||||||||||||||||||||||||||||||||||||||||||||||||
FY16 proved to be a significant year for Deutsche Beteiligungs (DBAG). In addition to generating strong NAV returns and maintaining an elevated level of portfolio activity similar to FY15, the scale of the business was increased materially by the launch of DBAG Fund VII, with commitments of €1bn, and DBAG’s €38.6m capital increase. These developments have broadened the opportunity set for potential investments and position DBAG favourably to grow portfolio value over the medium term, while a new sustainable dividend policy aims to provide shareholders with greater visibility over future distributions.
12 months ending |
Share price |
NAV (%) |
LPX Europe |
LPX Europe NAV (%) |
SDAX |
31/10/12 |
28.0 |
31.7 |
15.4 |
7.0 |
9.3 |
31/10/13 |
7.3 |
5.8 |
34.9 |
9.5 |
32.2 |
31/10/14 |
19.4 |
21.5 |
5.9 |
12.3 |
(0.0) |
30/09/15* |
22.6 |
6.7 |
22.3 |
11.1 |
24.7 |
30/09/16 |
20.8 |
15.6 |
9.3 |
3.3 |
11.7 |
Source: Thomson Datastream, Morningstar, Bloomberg. Note: *11-month period due to change in financial year end. Discrete total return performance in euros.
Strong portfolio activity and NAV returns in FY16
DBAG generated €50m net income in FY16, significantly ahead of the €27m reported for FY15. Dividend-adjusted return on NAV was 16.0% in FY16, compared with the 14.3% pa average return over the prior 10 financial years. Five new investments and three divestments were announced in FY16, bringing DBAG’s portfolio to 23 companies at end-September 2016, including 12 new investments from FY15 and FY16, which is encouraging for medium-term prospects.
DBAG Fund VII launched with €1bn in commitments
In September 2016, DBAG closed the fund-raising for DBAG Fund VII with €1bn in capital commitments, a significant step-up from the €700m raised for DBAG Fund VI in 2012. This brings DBAG’s funds under management to c €1.8bn, significantly increasing DBAG’s fee income from FY17. The launch also signifies a strategic advance as the new fund will be able to invest up to €200m in a single buyout.
€38.6m capital increase completed to finance growth
In September 2016, DBAG completed a €38.6m capital increase, issuing 1.4m new shares (10% of issued capital) at a 22.3% premium to NAV. While there is no intention to introduce structural gearing, in January 2016, DBAG arranged a five-year €50m credit facility to help manage short-term timing differences in cash flows.
Valuation: 3.6% yield and sustainable dividend policy
DBAG shares are trading at a 36.2% premium to 30 September 2016 NAV. In our view, the c €130m premium represents the market-implied value of DBAG’s fund services business, which is not reflected in the NAV. A €1.20 dividend has been proposed for FY16, representing a 3.6% yield and setting a base level for payments in future years under the new dividend policy.
Exhibit 1: Company at a glance
Investment objective and fund background |
Recent developments |
||||||
DBAG acquires subsidiaries of corporate groups and invests in mid-sized companies in Germany and neighbouring German-speaking countries via MBO transactions and growth capital financings. There is a focus on growth-driven profitable businesses valued at between €50m and €250m. DBAG’s core objective is to sustainably increase net asset value. |
■ 15 December 2016: FY16 results – NAV TR +15.6% vs LPX Europe NAV TR +3.3%. ■ 8 December 2016: MBO investment in automotive cable assembly and lighting solutions supplier, Dieter Braun. ■ 8 November 2016: Sale of investment in Grohmann Engineering to Tesla Motors. ■ 27 October 2016: €1.20 dividend proposed for FY16. ■ 15 September 2016: 10% capital increase completed, raising €38.6m gross proceeds. |
||||||
Forthcoming |
Capital structure |
Fund details |
|||||
AGM |
22 February 2017 |
FY16 net expense ratio* |
1.5% (see page 10) |
Group |
Deutsche Beteiligungs |
||
Quarterly results |
9 February 2017 |
Net cash |
21.3%** |
Manager |
Team managed |
||
Year end |
30 September |
Annual mgmt fee |
N/A (self-managed) |
Address |
Boersenstrasse 1 60313 Frankfurt am Main, Germany |
||
Dividend paid |
27 February 2017 |
Performance fee |
N/A (self-managed) |
||||
Launch date |
December 1985 |
Company life |
Unlimited |
Phone |
+49 69 95787-01 |
||
Continuation vote |
N/A |
Loan facilities |
€50m |
Website |
|||
Dividend policy and history (financial years) |
Share buyback policy and history (financial years) |
||||||
From FY16, DBAG’s policy is to pay a stable or rising annual dividend, compared with the previous policy to pay a base annual dividend from retained profits supplemented by a surplus dividend based on realised gains. |
DBAG uses share repurchases and capital increases to manage longer-term capital requirements. In September 2016, DBAG raised €38.6m through the issue of 1.4m new shares (10% of issued capital) at a 22.3% premium to NAV. |
||||||
|
|
||||||
Portfolio split by investment type (as at 30 September 2016)*** |
Portfolio exposure by sector (as at 30 September 2016)*** |
||||||
|
|
||||||
Shareholder base (as at 9 January 2017) |
Split of DBAG’s 37 MBO transactions by vendor (1997-2016) |
||||||
|
|
||||||
Source: DBAG, Edison Investment Research, Dealogic, IPREO, Thomson. Note: *Based on expenses net of fee income; adjusted for non-recurring items. **Including €21.3m of securities classified as long-term assets. ***Does not include co-investment funds.
FY16 results significantly ahead of prior year
DBAG reported FY16 net income of €50.2m, compared with €27.0m in FY15. Similar to FY15, returns in FY16 were driven by valuation gains across the carried portfolio, rather than the sale of a major investment. DBAG’s dividend-adjusted return on NAV of 16.0% in FY16 compares with 10.0% in FY15 and a 14.3% pa average return over the previous 10 financial years.
|
Exhibit 2: DBAG’s NAV per share progression during FY16 |
|
|
Source: DBAG, Edison Investment Research. Note: Other comprehensive income principally relates to a €7.3m increase in pension provisions due to a decline in the actuarial rate from 2.08% to 0.80%. |
There was a strong underlying valuation gain of €68.9m (+27%) across the carried portfolio. Similar to FY15, earnings growth was the primary contributor to valuation gains in FY16 (€46.6m), with 15 of the 19 companies in the portfolio for more than one year meeting or exceeding budgeted earnings. Higher valuation multiples also had a significant positive effect (€16.0m), driven by stock market strength in the final quarter of FY16, after a decrease over the first three quarters. Movements in debt, currency rates and other factors accounted for the balance of valuation gains.
Performance by business segment
Exhibit 3: DBAG segmental analysis
€m unless stated |
Investment business |
Fund services business |
Group |
||||||
FY14 |
FY15 |
FY16 |
FY14 |
FY15 |
FY16 |
FY14 |
FY15 |
FY16 |
|
Segment income* |
50.7 |
29.2 |
60.1 |
24.4 |
20.5 |
19.6 |
72.9 |
48.4 |
78.5 |
Segment expenses* |
(10.3) |
(4.3) |
(7.1) |
(16.4) |
(18.3) |
(22.6) |
(24.5) |
(21.3) |
(28.5) |
Segment net income before taxes |
40.4 |
24.9 |
53.0 |
8.0 |
2.2 |
(3.0) |
48.4 |
27.1 |
50.0 |
Pre-tax margin |
80% |
85% |
88% |
33% |
11% |
-15% |
66% |
56% |
64% |
Taxes & minority interests |
- |
- |
- |
- |
- |
- |
(0.4) |
(0.1) |
0.2 |
Consolidated net income |
- |
- |
- |
- |
- |
- |
48.0 |
27.0 |
50.2 |
Proportion of group net income |
83% |
92% |
106% |
17% |
8% |
-6% |
- |
- |
- |
Financial assets, loans & receivables |
163.4 |
250.2 |
308.5 |
- |
- |
- |
- |
- |
- |
Investment portfolio |
153.1 |
255.7 |
302.6 |
- |
- |
- |
- |
- |
- |
Financial resources** |
140.7 |
58.3 |
78.6 |
- |
- |
- |
- |
- |
- |
Assets/managed assets*** |
303.0 |
303.1 |
369.6 |
1,239.6 |
1,075.4 |
1,781.8 |
- |
- |
- |
Source: DBAG, Edison Investment Research. Note: *Synthetic internal transfers (€2.2m, €1.3m, €1.2m) between divisions to reflect management fees on DBAG’s share of fund assets have been eliminated in group figures. **Financial resources exclude cash held in investment vehicles. ***Managed assets recognised at cost.
As shown in Exhibit 3, similar to FY14 and FY15, DBAG’s investment business was the primary contributor to group net income in FY16. This business segment saw a significant increase in income (net valuation gains) compared with FY15, accompanied by a further improvement in margin, more than doubling its reported net income. FY15’s net valuation gains, and hence margin, were affected by a disproportionately large carried interest (profit-sharing) provision, which related to the cumulative performance of DBAG Fund V since its launch in 2007, rather than a single year’s performance. The investment business incurred non-recurring costs of €1.9m in FY16 related to the arrangement of the €50m credit facility and completion of the €38.6m capital increase.
As expected, a combination of lower fee income and higher costs resulted in the fund services business reporting a loss. Compared with FY15, fee income was lower primarily due to no fees being received from DBG Fonds I following its liquidation in FY15 and fees from DBAG Fund V reducing as divestments are made. Fund services costs increased from the prior year due to the high level of investment activity in FY16, as well as FY15 being a truncated 11-month period. In FY16, the fund services business incurred non-recurring costs of €2.2m related to the launch of DBAG Fund VII and €0.5m associated with changes to DBAG’s corporate structure. Adjusting for these costs, the fund services business was close to breakeven.
Fund profile: Private equity investor and asset manager
DBAG is a Germany-based and listed private equity company, which acquires and invests in mid-sized, family-owned companies and subsidiaries of corporate groups in Germany and neighbouring German-speaking countries, often referred to as Mittelstand companies. DBAG is a pioneer of private equity investment in mid-sized German companies, with over five decades’ experience. Since its foundation in 1965, DBAG and its predecessor company have invested in more than 300 companies. DBAG focuses on investing in established, growth-driven profitable businesses valued at between €50m and €250m and is distinguished from peers by managing third-party funds. DBAG has two distinct business lines: private equity investments, which drives NAV growth, and fund investment services, which provides a predictable fee income stream. In July 2016, DBAG raised €1bn for the launch of DBAG Fund VII, which brought its funds under management to c €1.8bn and will add significant fee income from FY17. DBAG is funded entirely by equity, with no structural debt, and completed a 10% capital increase in September 2016, raising €38.6m to finance the growth of its investment portfolio alongside its managed funds. DBAG has a longstanding track record of paying dividends, revising its dividend policy in 2016 to pay a consistent annual dividend, which will not be driven by the size or timing of investment realisations. DBAG’s board of management comprises spokesman, Torsten Grede, Dr Rolf Scheffels and CFO, Susanne Zeidler.
The fund manager: DBAG investment team
The manager’s view: Underlying earnings growth to drive NAV
DBAG management observes that the nature of the co-investment activity and fund investment services business make them more suited to a medium- to long-term assessment, planning and forecast horizon. It notes that unpredicted events can significantly influence performance in any financial year, as reflected by the variation in returns over the last 10 years. This is highlighted by DBAG’s two extreme returns during this period of +56.2% and -17.5% in consecutive years (FY07 and FY08), while the average annual return was 12.2% from FY07 to FY16.
DBAG management highlights that DBAG Fund VII is able to invest in larger buyouts of up to €200m, which represents a strategic advance for DBAG, while DBAG ECF will also invest in smaller buyouts. This improves DBAG’s competitiveness, broadening the opportunity set for potential investments and growing portfolio value. The increased scale of the business will lead to an increase in DBAG’s recurring net expenses and, given its higher co-investment share alongside DBAG Fund VII, DBAG’s expected average annual investment rate has risen from €50m to €60m.
For the current financial year, FY17 and the two following years, DBAG management expects to see continuing net asset value growth, driven by the earnings growth and cash generation of portfolio companies. However, for FY17, DBAG management expects the net result of investment activity to be more than 20% lower than the €60.6m achieved in FY16. This is largely due to potential divestments and stock market effects not being included in the forecast, with net gains on disposals and rising market multiples contributing €5.8m and €16.0m respectively in FY16. While expenses are projected to be slightly lower, FY17 investment business net income is expected to be more than 20% below the level achieved in FY16.
Following the launch of DBAG Fund VII, the calculation basis for fund management and advisory fee income has almost doubled. As a result, FY17 fee income will be significantly higher than in FY16, with a further increase in FY18 when a full year’s advisory fees will be received on the increased fund assets. The new fee arrangements agreed in 2016 for DBAG ECF, whereby fees are based on invested capital, provide scope for higher fee income, as the calculation basis for fees rises with each new investment and structuring fees will also be received for each transaction from May 2017. While expenses are expected to increase slightly, a more than 20% rise in fee income is projected to drive the fund services business back to profitability in FY17.
Based on portfolio companies’ projected earnings growth, DBAG management expects net asset value to grow by more than 15% pa over the medium term, with investment business net income significantly exceeding that of FY16 by the end of the current planning horizon in FY19. After a projected decline in FY17 group net income, significantly higher earnings are expected in FY18 and FY19, resulting in a significantly higher NAV total return than FY17 in both years.
Asset allocation
Investment strategy: ‘Mittelstand’ companies with potential
DBAG operates an integrated business model with two complementary business lines, private equity investments and fund investment services, centred upon DBAG-managed private equity funds, through which DBAG invests alongside third-party investors such as pension funds, funds of funds, banks, foundations, insurance companies and family offices. Investing via the DBAG-managed funds creates a substantially larger capital base, and hence a broader range of investment opportunities, for DBAG’s own investments. The strategy also provides some assurance to third-party investors in the funds that the manager’s interests are aligned with their own.
DBAG invests principally in management buyout (MBO) and expansion financing transactions as a co-investor alongside DBAG-managed funds. At 30 September 2016, DBAG’s portfolio investments comprised 14 MBOs, nine expansion financings and two international buyout funds. These investment types represent 67%, 30% and 3% of the portfolio value, respectively (see Exhibit 1). The two international funds are older investments, dating from 2001 and 2003, which are gradually being liquidated through realisation of the underlying investments.
DBAG invests in established companies with proven business models and the investment approach excludes early-stage companies and companies requiring restructuring. Considerable importance is placed on the experience and capability of a potential investee company’s management to realise targeted development objectives. Prospective portfolio companies need to exhibit promising potential for development through enhancing their strategic positioning, improving operational processes, or leveraging their exposure to structural growth drivers. The companies tend to be characterised by leading market positions, entrepreneurial management and capacity for innovation, with the prospect of a long-term future for their products.
DBAG has four core sectors of expertise: mechanical and plant engineering, automotive suppliers, industrial services providers and industrial components manufacturers. Over the last 20 years, 80% of DBAG’s investments have been in these sectors and they represented 75% of the portfolio value at end-September 2016. As well as participating in competitive sale processes, DBAG’s extensive network enables it to originate transactions through proprietary deal flow. In FY16, close to 15% of all transaction opportunities were generated by direct contact with company owners.
The investment process consists of three phases:
■
Investing – identification and assessment of transaction opportunities. In FY16, 221 investment opportunities were screened; 148 relating to potential MBOs and 73 to expansion financings. Follow-up work was done on 173 or 78% of these opportunities. Around half of the opportunities were in DBAG's core sectors.
■
Developing – supporting a portfolio company’s development process. DBAG typically supports portfolio companies as a financial investor in a focused partnership role for four to seven years with the objective of appreciating the company’s value. The targeted average annual internal rate of return (IRR) is 25% for MBOs and 20% for expansion capital financings.
■
Realising – realising value appreciation through a well-timed and well-structured divestment. Investments are typically exited via the trade sale of portfolio companies to an industrial partner with which they can continue their development, but may also be sold to a new financial investor or floated as a public company.
This process is guided by DBAG’s experienced investment team, comprising 23 investment professionals and led by two members of DBAG’s management board, Torsten Grede and Dr Rolf Scheffels. The team is supported by four research and business development specialists. Two to four team members generally take responsibility for each transaction, always supported by a member of the management board.
Since 1997, DBAG has financed 37 MBOs alongside DBG Fonds III and DBAG Funds IV, V and VI, achieving an aggregate 2.2x increase in the value of invested capital. As at end-September 2016, 23 of these investments had been realised, with aggregate exit valuations representing 2.7x invested capital (see Exhibit 4).
Exhibit 4: DBAG’s MBO transactions realised since 1997
Company |
Investment date |
Divestment date |
Holding period (years) |
Exit route |
Exit multiple |
Clyde Bergemann Power Group |
May-05 |
Apr-16 |
11.0 |
Trade Sale |
0.2x |
Spheros GmbH |
Dec-11 |
Mar-16 |
4.3 |
Trade Sale |
2.6x |
Homag Group AG |
Feb-07 |
Oct-14 |
7.7 |
IPO / Trade Sale |
2.9x |
Coveright Surfaces GmbH |
Jun-03 |
Jan-13 |
9.6 |
Trade Sale |
1.2x |
ICTS Europe B.V. |
Mar-08 |
Dec-12 |
4.8 |
Write off |
0.0x |
Coperion GmbH |
Jul-07 |
Nov-12 |
5.3 |
Trade Sale |
4.1x |
Preh GmbH |
Oct-03 |
Jun-11 |
7.7 |
Trade Sale |
3.1x |
Heim & Haus GmbH |
Sep-06 |
Mar-11 |
4.5 |
Buy Back |
1.9x |
MCE AG |
Apr-07 |
Oct-09 |
2.5 |
Trade Sale |
4.1x |
Lewa GmbH |
Oct-05 |
Aug-09 |
3.8 |
Trade Sale |
7.3x |
AkSys GmbH |
Nov-01 |
Oct-08 |
6.9 |
Trade Sale |
0.1x |
DS Technologie GmbH |
Jul-98 |
Oct-07 |
9.3 |
Trade Sale |
1.3x |
HT Engineering GmbH |
Jun-02 |
Jun-06 |
4.0 |
Trade Sale |
6.1x |
Zapf GmbH |
Nov-99 |
Apr-06 |
6.4 |
Trade Sale |
0.1x |
Otto Sauer Achsenfabrik |
Feb-04 |
Mar-06 |
2.1 |
Secondary Buyout |
4.1x |
Babcock Borsig Service |
Nov-03 |
Apr-05 |
1.4 |
Trade Sale |
5.8x |
Andritz AG |
Dec-99 |
Jun-03 |
3.5 |
IPO |
2.0x |
Edscha AG |
Oct-00 |
Nov-02 |
2.1 |
Secondary Buyout |
1.8x |
Euvita KG |
Jul-97 |
Jul-00 |
3.0 |
Trade Sale |
0.9x |
GAH AG |
Jul-98 |
Jul-00 |
2.0 |
Trade Sale |
3.7x |
Sebaldus GmbH |
Aug-97 |
Dec-99 |
2.3 |
Trade Sale |
3.5x |
Libro AG |
Feb-97 |
Oct-99 |
2.7 |
Trade Sale |
1.6x |
Schoeller & Hoesch KG |
May-97 |
Nov-98 |
1.5 |
Trade Sale |
2.6x |
Average |
4.7 |
2.7x |
Source: DBAG
Current portfolio positioning
Reflecting improved marketing and deal sourcing, FY15 and FY16 saw the least investment opportunities screened in the last five years (253 and 221 respectively; five-year average 275), while FY15 saw strong portfolio activity and this continued in FY16, with five new investments and three divestments announced. DBAG’s portfolio now comprises 24 companies, including 12 new investments from FY15 and FY16 (see Exhibit 5), which is encouraging for medium-term prospects.
Exhibit 5: DBAG’s investment portfolio at end-December 2016
Company |
Headquarters |
Core business |
2016 |
Emplo-yees |
First inv’t |
Type of inv’t |
Co-inv’t fund |
Fund equity share |
DBAG inv’t cost |
DBAG equity share |
DBAG portfolio value* |
JCK KG |
Quakenbrück, Germany |
Textile retail business, mainly for discounters in Germany |
€555m |
900 |
Jun-92 |
Exp’n capital |
DBAG ECF |
6.5% |
€8.8m |
9.5% |
>5 yrs |
FDG SA |
Orly, France |
Services for supermarkets in France/neighbouring countries |
€129m |
720 |
Jun-10 |
MBO |
DBAG Fund V |
63.8% |
€2.2m |
15.5% |
€50.8m |
Romaco GmbH |
Karlsruhe, Germany |
Packaging technology machines/plant worldwide |
€135m |
550 |
Apr-11 |
MBO |
DBAG Fund V |
74.6% |
€9.9m |
18.7% |
|
Plant Systems & Services PSS GmbH |
Bochum, Germany |
Industrial services for energy/ process industries in Europe |
€40m |
229 |
Nov-12 |
Exp’n capital |
DBAG ECF |
28.5% |
€2.3m |
20.5% |
2-5 yrs |
Heytex Bramsche GmbH |
Bramsche, Germany |
Textile print media/technical textiles worldwide |
€104m |
500 |
Dec-12 |
MBO |
DBAG Fund V |
65.1% |
€6.3m |
16.8% |
|
Inexio KGaA |
Saarlouis, Germany |
High-quality fibre-optic telecoms/ IT services in Europe |
€50m |
180 |
May-13 |
Exp’n capital |
DBAG ECF |
9.6% |
€5.5m |
6.9% |
|
Formel D GmbH |
Troisdorf, Germany |
Car manufacturer and suppliers services worldwide |
€251m |
6,400 |
May-13 |
MBO |
DBAG Fund V |
72.8% |
€3.6m |
17.7% |
|
ProXES GmbH |
Hameln, Germany |
Liquid and semi-liquid food processing plant worldwide |
€115m |
434 |
Jun-13 |
MBO |
DBAG Fund V |
74.6% |
€7.5m |
18.6% |
€131.8m |
DNS:NET Internet Service GmbH |
Berlin, Germany |
High-quality fibre-optic telecoms/ IT services in Germany |
€13m |
80 |
Sep-13 |
Exp’n capital |
DBAG ECF |
20.9% |
€5.0m |
14.9% |
|
Schülerhilfe GmbH |
Gelsenkirchen, Germany |
Education and tutoring services in Germany |
€66m |
430 |
Oct-13 |
MBO |
DBAG Fund VI |
65.4% |
€2.5m |
15.3% |
|
Unser Heimatbäcker GmbH |
Pasewalk, Germany |
Bakery chain in Germany |
€146m |
2,700 |
Jun-14 |
MBO |
DBAG Fund VI |
54.5% |
€9.9m |
15.6% |
|
FY15 investments |
|
|
|
|
|
|
|
|
|
|
1-2 yrs |
Infiana Group |
Forchheim, Germany |
Plastic-based release liners/ specialised films worldwide |
€194m |
800 |
Dec-14 |
MBO |
DBAG Fund VI |
74.1% |
€11.5m |
17.4% |
|
Pfaudler Process Solutions Group |
Schwetzingen, Germany |
Glass-lined reactors for pharma/ chemical industries worldwide |
US$217m |
1,400 |
Dec-14 |
MBO |
DBAG Fund VI |
80.8% |
€8.5m |
18.7% |
|
Oechsler AG |
Ansbach, Germany |
Injection-moulded precision auto components worldwide |
€349m |
2,260 |
Feb-15 |
Exp’n capital |
DBAG ECF |
11.6% |
€11.1m |
8.4% |
|
Gienanth GmbH |
Eisenberg, Germany |
Iron foundry in Germany |
€121m |
875 |
Mar-15 |
MBO |
DBAG Fund VI |
79.9% |
€6.9m |
16.0% |
€72.8m |
Cleanpart Group |
Asperg, Germany |
Semi-conductor industry engineering services worldwide |
€51m |
570 |
Mar-15 |
MBO |
DBAG Fund VI |
76.7% |
€11.2m |
18.0% |
|
Silbitz Group GmbH |
Thuringia, Germany |
Iron foundries worldwide |
€150m |
1,052 |
Jul-15 |
MBO |
DBAG Fund VI |
70.3% |
€7.9m |
16.5% |
|
Novopress GmbH |
Neuss, Germany |
Construction/electrotechnical/ sanitary tool systems worldwide |
N/A |
95 |
Jul-15 |
Exp’n capital |
DBAG ECF |
21.0% |
€2.3m |
19.0% |
|
FY16 investments |
|
|
|
|
|
|
|
|
|
|
<1 yr |
Telio Group |
Hamburg, Germany |
Communications and media systems in prisons in Europe |
€28m |
110 |
Apr-16 |
MBO |
DBAG Fund VI |
63.4% |
€12.2m |
14.9% |
|
mageba AG |
Bülach, Switzerland |
Structural bearings, joints for infrastructure worldwide |
€102m |
800 |
Feb-16 |
Exp’n capital |
DBAG ECF |
21.8% |
€6.6m |
19.8% |
€25.5m |
R&M International |
Hamburg, Germany |
Interior outfitting for ships and marine installations worldwide |
€102m |
480 |
Sep-16 |
Exp’n capital |
DBAG ECF |
17.3% |
€6.7m |
15.7% |
|
FY17 investments |
|
|
|
|
|
|
|
|
|
|
<1 yr |
Polytech Health & Aesthetics GmbH |
Dieburg, Germany |
Silicone implants for plastic surgery in Europe |
€31m |
170 |
Oct-16 |
MBO |
DBAG Fund VI |
75.1% |
€12.4m |
17.6% |
|
Frimo Group |
Lotte, Germany |
Plastic auto component tooling/ production plant worldwide |
€212m |
1,400 |
Nov-16 |
MBO |
DBAG Fund VI |
57.6% |
€14.8m |
13.5% |
€33.1m |
Dieter Braun |
Bayreuth Germany |
Cable assembly/lighting for automotive industry worldwide |
€77m |
1,500 |
Dec-16 |
MBO |
DBAG Fund VI |
55.9% |
€5.9m |
13.1% |
|
Buyout funds |
|
|
|
|
|
|
|
|
|
|
>5 yrs |
Harvest Partners IV |
New York, USA |
One investment remaining in portfolio |
Oct-01 |
Buyout fund |
€6.2m |
9.9% |
€8.4m |
||||
DBG Eastern Europe II |
Jersey, Chan. Islands |
Two investments remaining in portfolio |
Jan-03 |
Buyout fund |
€0.1m |
14.9% |
|||||
FY17 divestments |
|
|
|
|
|
|
|
|
|
|
|
Broetje-Automation GmbH |
Wiefelstede, Germany |
Aircraft assembly automation machines/plant worldwide |
Mar-12 |
MBO |
DBAG Fund V |
60.0% |
€5.6m |
15.0% |
Sold Oct-16 |
||
Grohmann GmbH |
Prüm, Germany |
Developer and provider of plants for industrial automation |
Dec-96 |
Exp’n capital |
N/A |
0.0% |
€2.1m |
24.0% |
Sold Nov-16 |
||
FY16 divestments |
|
|
|
|
|
|
|
|
|
|
|
Spheros GmbH |
Gilching, Germany |
Bus air conditioning systems, water pumps worldwide |
Mar-12 |
MBO |
DBAG Fund V |
63.0% |
€13.9m |
15.7% |
Sold Mar-16 |
||
Clyde Bergemann Group |
Wesel, Germany |
Components for power plants worldwide/service business |
May-05 |
MBO |
DBAG Fund IV |
31.5% |
€11.7m |
15.7% |
Sold Apr-16 |
Source: DBAG, Edison Investment Research. Note: *Portfolio values as at 30 September 2016.
While DBAG’s portfolio is relatively concentrated with 25 holdings at end-September 2016, as illustrated in Exhibit 6 (left-hand chart), the portfolio is reasonably well spread, with the top five holdings representing 38% of the portfolio by value.
|
Exhibit 6: Portfolio value and maturity analysis at 30 September 2016 |
|
Distribution of portfolio holdings by investment value |
Portfolio investment cost and value by holding period |
|
|
|
Source: DBAG, Edison Investment Research |
|
Strong investment activity over the last two financial years and the sale of the major investment in Homag in 2014 has lowered the average maturity of DBAG’s portfolio, with investments younger than five years increasing from 43% of the portfolio at 31 October 2013 to 80% of the portfolio at 30 September 2016. While this suggests a slower pace of divestments over the next two years (given the typical four- to seven-year holding period), there is no implication that this will lead to a slowdown in valuation gains. Investments held for less than two years represent over one-third of the portfolio value, and offer the prospect of delivering strong valuation gains as they mature, as illustrated by the value to cost maturity profile shown in Exhibit 6 right-hand chart.
Investments held longer than five years comprise three portfolio companies and two international buyout funds. These investments equate to 20% of portfolio value and offer scope for divestments to provide a meaningful source of cash flow as well as capital gains over the next two years.
Commitments and financial resources
During FY16, DBAG’s financial resources increased from €58.3m to €78.6m including the €38.6m gross proceeds from the September 2016 capital increase, with €50.7m of investment cash outflows broadly matched by €47.2m of cash inflows, which included €27.3m from divestments, €9.5m from refinancing and recapitalisations, and €8.5m from repayment of bridge-over loans. The other major cash outflow during the year was the €13.7m FY15 dividend payment. At end-September 2016, a further €17.7m cash was held in unconsolidated investment vehicles, largely to fund the €13.1m agreed investment in Polytech which had not been completed at the year end.
At 30 September 2016, DBAG had €76m in undrawn capital commitments to the DBAG ECF and DBAG Fund VI funds. Following the completion of the €14.9m and €5.9m investments in Frimo Group and Dieter Braun after the financial year end, DBAG Fund VI concluded its investment period. DBAG’s total commitment to DBAG Fund VII is €200m over its planned investment period of four years from the start of 2017, implying that DBAG’s investment run rate will rise from c €50m pa to c €60m pa. Taking into account the €18.1m FY16 dividend payment and fee income largely covering operating expenses, DBAG appears adequately funded for 2017 with the potential for realisations to add to financial resources. The €20.8m of new investments is more than covered by the c €25m proceeds from the divestment of Broetje-Automation as well as c €10m from the sale of Grohmann Engineering. Realisations from the maturing of DBAG’s current investment portfolio are expected to fund its commitment to DBAG Fund VII, while the €50m credit facility provides flexibility to manage short-term timing differences between cash inflows and outflows.
Performance: Ahead of peers over one to 10 years
As shown in Exhibit 8, DBAG’s share price and NAV total return have substantially outperformed the corresponding returns of the LPX Europe1 index over 10 years while more modestly outperforming over one, three and five years. Over 10 years, DBAG’s NAV total return and share price total return have both substantially outperformed the LPX Direct2 private equity index as well as the SDAX German small-cap listed equity index. DBAG’s share price moving to a significant premium to NAV from FY15 has contributed to the greater outperformance of its share price total return versus the LPX Europe and LPX Direct indices over 10 years, as well as versus the SDAX index over three, five and 10 years. Exhibit 9 illustrates DBAG’s outperformance of the LPX Europe index over five years, with the sharp adjustments reflecting DBAG’s quarterly reporting of NAV.
The LPX Europe comprises private equity companies listed in Europe. The index is characterised by a high degree of diversification across investment styles such as buyout and venture.
The LPX Direct index comprises listed private equity companies that pursue a direct private equity investment strategy. The index is diversified across regions, investment and financing styles and vintage years.
|
Exhibit 7: Investment company performance to 30 September 2016 in euro terms |
||||||||
Price, NAV and benchmark total return performance, one-year rebased |
Price, NAV and benchmark total return performance (%) |
|||||||
|
|
|||||||
|
Source: Thomson Datastream, Edison Investment Research. Note: Three, five and 10-year performance figures annualised. |
||||||||
|
Exhibit 8: Share price and NAV total return performance, relative to indices (%) |
||||||||
|
Three months |
Six months |
One year |
Three years |
Five years |
10 years |
||
Price relative to LPX Europe |
1.5 |
2.0 |
10.5 |
20.9 |
6.8 |
158.2 |
||
NAV relative to LPX Europe NAV |
4.3 |
(0.1) |
11.9 |
15.8 |
13.2 |
103.0 |
||
Price relative to LPX Direct |
5.5 |
4.3 |
9.9 |
28.2 |
12.9 |
168.7 |
||
NAV relative to LPX Direct NAV |
6.4 |
(2.8) |
6.8 |
6.2 |
(5.6) |
68.4 |
||
Price relative to SDAX |
5.6 |
5.2 |
8.1 |
22.5 |
18.6 |
85.0 |
||
NAV relative to SDAX |
0.7 |
(0.8) |
3.5 |
2.9 |
(21.2) |
48.6 |
||
|
Source: Thomson Datastream, Edison Investment Research. Note: Data to end-September 2016. Geometric calculation. |
||||||||
|
Exhibit 9: NAV total return performance relative to LPX Europe index NAV over five years |
||||||||
|
||||||||
|
Source: Thomson Datastream, Edison Investment Research |
||||||||
Premium: Reflects value of fund services business
We see the value of DBAG’s fund services business as the explanation for its shares trading at a premium to NAV in contrast with its listed private equity peers. The accounting treatment of this business means that it is not re-stated at fair value in DBAG’s accounts and therefore DBAG’s reported NAV includes the historical cost of the business assets rather than its prevailing market value. The current premium to NAV suggests a market-implied valuation of c €130m for the fund services business. The earnings of the fund services business have varied between an €8.0m profit and a €3.0m loss over the last three years, making it difficult to assess this valuation against historical earnings. Looking forward, DBAG management projects a rise in fee income from €19.5m in FY16 to c €29.0m in FY18, due to the substantial increase in AUM following the launch of DBAG Fund VII. In our view, this should translate into fund services earnings of between €4m and €7m in FY17 and FY18, making the market-implied valuation multiple between 19x and 33x earnings.
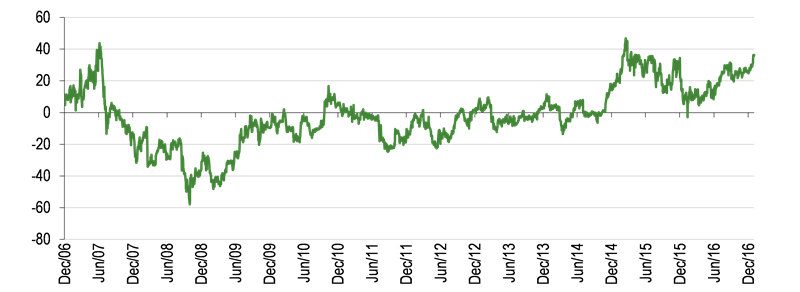
As illustrated in Exhibit 10, DBAG shares have traded almost continuously at a premium to NAV since end-October 2014, when DBAG started reporting separately on the performance of its investment and fund services businesses. Over the five years prior to this, DBAG’s share price traded between a 25% discount and a 17% premium to NAV, averaging a 5% discount. The current 36.2% share price premium to NAV compares with a one-year average premium of 18.8%.
|
Exhibit 10: Share price premium/discount to NAV over 10 years (%) |
|
|
Source: Thomson Datastream, Edison Investment Research |
Capital structure and fees
DBAG has a conventional capital structure with a single share class. There are currently 15.0m ordinary shares outstanding, following DBAG’s 10% capital increase in September 2016, in which 1.4m new shares were issued at a 22.3% premium to NAV, raising gross proceeds of €38.6m. DBAG uses share repurchases and capital increases to manage longer-term capital requirements, with repurchases and share issues occurring infrequently (see Exhibit 1). No shares have been repurchased since December 2007 and the September 2016 capital increase was the first issue of shares since March 2004.
While DBAG remains entirely equity-funded and has no intention of introducing structural gearing, in January 2016 it arranged a five-year €50m credit facility in order to provide flexibility in managing short-term timing differences between cash inflows and outflows. At end-September 2016, DBAG held €21.3m in fixed-income bonds with maturities of between two and five years (long-term securities) and €57.3m in cash, including the proceeds of the capital increase. In total, DBAG’s financial resources of €78.6m equated to a net cash position of 21.3% at end-September 2016.
DBAG is self-managed, incurring personnel and other operating expenses directly rather than paying fees for the management of its investment portfolio. The majority of expenses incurred at the group level are charged to the fund services business, which receives management and advisory fee income. Looking at the investment business in isolation, as shown in Exhibit 3, expenses of €7.1m were incurred in FY16 and average net assets were €336.4m (moving from €303.1m to €369.6m), giving an expense ratio of 2.1%.
At the group level, which takes into account net income from the fund services business and is most relevant to DBAG shareholders, €28.0m of expenses were incurred (excluding net interest charges), offset by €18.3m of management and advisory fees to give net expenses of €9.7m, equating to a net expense ratio of 2.9%. Excluding non-recurring costs of €4.6m, comparable to an ongoing charge calculation, the net expense ratio for FY16 was 1.5%. The additional fee income from DBAG Fund VII should lead to a decline in the net expense ratio in FY17 and FY18.
Dividend policy and record
DBAG revised its dividend policy in 2016, with the intention of paying a stable or rising single annual dividend for FY16 and future years. This compares with the previous policy of paying a sustainable annual base dividend from retained profits (€0.40 from FY08 to FY14, €0.50 in FY15), supplemented by a surplus dividend, relating to the level of realised gains in each financial year. The opportunity to revise its dividend policy was provided by the increase in DBAG’s recurring fee income following the launch of DBAG Fund VII, together with the more stable cash inflows expected to arise from divestments as DBAG’s portfolio grows by number of investments as well as value.
The aim of the change was to give a smoother progression of dividends each year and thus provide shareholders with greater visibility over dividend payments. Although a surplus dividend has been paid in nine of the last 10 years, DBAG’s total dividend has varied significantly from one year to the next, notably declining by 50% in 2015 (see Exhibit 1), creating uncertainty for shareholders over the prospective level of dividend income they could expect to receive each year.
For FY16, the board has recommended a single dividend payment of €1.20 per share, representing a 20% increase on the total €1.00 dividend paid for FY15.
Peer group comparison
Exhibit 11: Listed private equity investment companies peer group as at 30 January 2017
% unless stated |
Country |
Mkt cap £m |
NAV TR 1 year |
NAV TR 3 years |
NAV TR 5 years |
NAV TR 10 years |
Price TR 1 year |
Price TR 3 years |
Price TR 5 years |
Price TR 10 years |
Discount (ex-par) |
Dividend yield (%) |
Deutsche Beteiligungs |
Europe |
431.7 |
35.7 |
62.4 |
76.1 |
278.4 |
41.8 |
84.1 |
156.5 |
344.6 |
36.6 |
3.6 |
3i |
Global |
6,745.0 |
44.6 |
100.2 |
132.0 |
5.0 |
45.7 |
104.7 |
326.7 |
1.9 |
24.1 |
3.2 |
Altamir |
Europe |
413.0 |
33.8 |
55.2 |
78.8 |
135.5 |
38.3 |
34.9 |
110.6 |
118.8 |
(30.1) |
4.2 |
GIMV |
Global |
1,117.5 |
35.9 |
46.8 |
56.1 |
102.8 |
35.9 |
46.8 |
56.1 |
102.8 |
6.1 |
3.6 |
Electra Private Equity |
UK |
1,782.1 |
35.6 |
94.1 |
141.2 |
255.5 |
36.6 |
102.4 |
231.9 |
238.1 |
(11.1) |
2.5 |
HgCapital Trust |
UK |
564.0 |
25.9 |
49.3 |
58.3 |
193.1 |
42.1 |
42.3 |
67.4 |
185.8 |
(4.8) |
2.7 |
ICG Enterprise Trust |
UK |
491.4 |
15.1 |
31.1 |
46.7 |
109.9 |
12.8 |
28.3 |
90.9 |
99.5 |
(15.6) |
1.6 |
Oakley Capital Investments |
Europe |
332.3 |
18.1 |
10.3 |
19.4 |
|
(1.1) |
(14.7) |
(1.1) |
|
(26.8) |
2.8 |
Standard Life Euro Private Eq |
Europe |
459.7 |
25.1 |
51.2 |
65.2 |
114.3 |
28.0 |
46.2 |
120.9 |
68.0 |
(12.9) |
4.0 |
Average |
1,370.7 |
30.0 |
55.6 |
74.9 |
149.3 |
31.1 |
52.8 |
128.9 |
144.9 |
(3.8) |
3.1 |
|
Rank in peer group |
7 |
3 |
3 |
4 |
1 |
3 |
3 |
3 |
1 |
1 |
3 |
Source: Morningstar, Edison Investment Research. Note: Performance data to end-September 2016. TR=total return. All returns expressed in sterling terms.
Exhibit 11 shows a comparison of DBAG with a selected peer group of listed private equity investment companies. DBAG is differentiated from listed private equity peers by its focus on the German Mittelstand. With the exception of 3i in the UK, which also manages third-party funds, DBAG is also differentiated from peers by the recurring fee income stream generated by its fund services business. The accounting treatment of this business means that it is not stated at fair value in DBAG’s accounts and therefore DBAG’s reported NAV includes the historical cost of the business’s assets rather than its prevailing market value.
DBAG’s NAV total return in euro terms to 30 September 2016 is modestly ahead of the peer group average over one, three and five years and substantially ahead over 10 years. While sterling weakness against the euro in 2016 has helped DBAG’s shorter-term performance when comparing with UK and global peers, this is largely offset by weakness of the euro against sterling over the previous three years, although currency movements have also had a significant effect over longer time periods (the euro strengthened by 17.4% and 27.6% over one and 10 years, and by 3.5% and 0.5% over three and five years, respectively to end-September 2016).
DBAG’s share price total return has outperformed its NAV total return over all time periods shown to end-September 2016. This reflects the shares moving to trade at a significant premium to NAV over the last two years, since DBAG started reporting separately on the performance of its two business segments, while the shares have traded at a discount as wide as 57.8% over the last 10 years.
As noted in the Premium: section above, similar to 3i, DBAG’s shares are trading at a premium to NAV in contrast to the majority of the peer group, which do not manage third-party funds, some of which are trading at a significant discount to NAV. DBAG’s above-average 3.6% yield is based on its proposed €1.20 dividend for FY16, which represents a base level for future dividend payments under its newly introduced dividend policy.
Supervisory board
DBAG’s supervisory board operates in accordance with the recommendations of the German Corporate Governance Code and comprises six members, the majority of whom, including the chairman, are independent. The members stand for re-election on a regular basis, with five re-elected at DBAG’s February 2016 Annual Meeting. Roland Frobel (appointed March 2011), a director at Dirk Rossmann (DBAG’s largest shareholder – see Exhibit 1) retired in February 2016 and was succeeded by Sonja Edeler, head of finance and accounting at Dirk Rossmann. The other supervisory board members are chairman (since March 2006) Andrew Richards (appointed March 2004), vice-chairman (since March 2013) Gerhard Roggemann (appointed March 2010), Wilken Freiherr von Hodenberg (appointed March 2013, on stepping down from DBAG’s management board after 12 years’ service), Philipp Möller (appointed March 2010) and Dr. Hendrik Otto (appointed March 2011).
|
|