Danakali |
DFS completed – production target Q418 |
Update for DFS |
Metals & mining |
21 January 2016 |
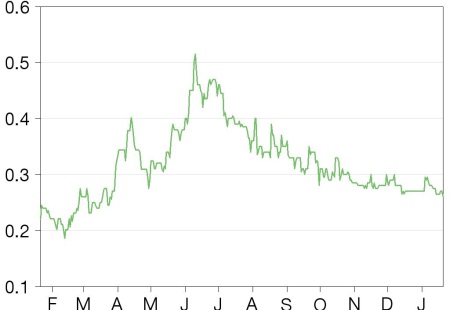
Share price performance
Business description
Next event
Analysts
Danakali is a research client of Edison Investment Research Limited |
|||||||||||||||||||||||||||||||||||||||||||||||
Danakali (DNK) has completed the definitive feasibility study (DFS) for the Colluli (DNK 50%) sulphate of potash (SOP) project in Eritrea. Colluli is a globally significant open-pittable resource with substantial expansion and mine life potential beyond its initial phases. On our estimates, there is significant upside potential as Colluli advances.
Year end |
Revenue (A$m) |
PBT* |
EPS* |
DPS |
P/E |
Yield |
06/13 |
0.1 |
(5.0) |
(4.0) |
0.0 |
N/A |
N/A |
06/14 |
0.1 |
(5.2) |
(3.3) |
0.0 |
N/A |
N/A |
12/15e** |
0.3 |
(7.6) |
(5.0) |
0.0 |
N/A |
N/A |
12/16e |
0.2 |
(4.5) |
(0.6) |
0.0 |
N/A |
N/A |
Note: *PBT and EPS are normalised, excluding intangible amortisation, exceptional items and share-based payments. **Year end changed from June to December in 2015.
DFS reduces capex by >30%
DNK has completed the DFS for its 50%-owned Colluli SOP project. It has reduced Phase 1 capital expenditure by 30% to US$298m (425ktpa SOP) and Phase 2 capital expenditure by 38% to US$175m (850ktpa). Initiatives supporting these cuts include a decrease in water requirements, using existing port facilities rather than a new export terminal (but at the expense of higher logistics costs) and optimising open-pit mine development.
Very low capital intensity in peer comparisons
The revisions have further enhanced Colluli's low capital intensity. After adjustment to a muriate of potash (MOP) equivalent basis, we calculate a capital intensity of US$491/t for Phase 1 and US$390/t for Phase 1 and Phase 2 combined. This compares with a mean of US$781/t for the three other potash projects in the Danakil Basin, all of which propose solution mining. As a comparison, the capital intensity of the high-profile BHP Jansen project is approximately US$1,400/t.
Competitive strengths – large, shallow resource
The Colluli reserve ranks as one of the largest and shallowest potash resources globally. The potassium salts in solid form can be mined by conventional open-pit methods and converted by a low-energy, high-yield process to high-purity SOP. The project also has the flexibility to respond to market requirements and can produce other potash products such as SOP-M and MOP. There is also potential for additional co-product revenue from rock salt, magnesium chloride and gypsum.
Valuation: Growth potential offers substantial upside
At a forecast long-term price of US$550/t SOP, we have revised our valuation of DNK’s 50% share of Phase 1 and Phase 2 to A$262m and A$534m respectively, prior to funding. Under a funding scenario of 70% debt and 30% equity, we now value Phase 1 and Phase 2 respectively at A$0.51/share and A$0.86/share. This value is not captured in the current share price. Our valuations do not incorporate the potential for further expansions and the mine life potential.
Completion of Colluli definitive feasibility study
DNK has completed the definitive feasibility study (DFS) for its Colluli sulphate of potash (SOP) project in Eritrea, East Africa. The DFS follows the pre-feasibility study (PFS) completed in March 2015.
The Colluli project is 100%-owned by Colluli Mining Share Company (CMSC), a 50:50 joint venture (JV) between DNK and Eritrean National Mining Corporation (ENAMCO).
Preliminary funding discussions are now underway with offtakers, strategic partners and financiers. The mining licence application process is to be initiated in Q116. Commissioning is targeted for Q418.
Colluli potash – higher-priced SOP product
The focus of the Colluli DFS is SOP production. This sells at a substantial premium to the most common form of potash fertiliser product, MOP. The premium is variable but is typically a minimum of 30%.
SOP is geologically rarer than MOP. As a result, approximately 50% of the world’s SOP has to be produced by upgrading MOP. This can be accomplished via the Mannheim process or sulphate salts reaction. The Mannhein process involves reacting MOP with sulphuric acid. It is an energy-intensive process and produces hydrochloric acid as a by-product, which can be expensive and environmentally difficult to dispose of. These cost factors, in addition to supply-demand considerations, locks in the price premium.
SOP is a specialist product. It is essential for chloride-sensitive crops, which require potassium. It contains no chloride compared with MOP, which has 46% chloride. SOP can be applied in saline and arid soils.
SOP is used on high-value crops such as vegetables, fruit, tree nuts, coffee, tea and tobacco, many of which are chloride-intolerant. SOP can also improve the look, taste and shelf life of crops. In contrast, MOP is used in crops that are less sensitive to chloride, such as broad acre crops (cereals, soya, oil crops, cotton, sugar beet and sugar cane).
The global potash market is approximately 65Mtpa and includes approximately 6Mtpa SOP and 55Mtpa MOP. The long-term annual demand growth rate for SOP and MOP is estimated at 2-3%.
Capital development cost – revised down
It is planned to develop the project in two phases:
■
Phase 1 – Capital cost is US$298m for annual production of 425ktpa SOP. This is a 30% reduction on the prior comparable PFS figure of US$428m. The decrease in development capital is largely attributable to the following:
•
Water requirements for processing have been substantially reduced. Identifying subsurface water at the Colluli site has also negated the need for a seawater delivery pipeline from Anfile Bay for at least the first five years of production. Process recovery pond layouts and the construction schedule have also been revised.
•
Product logistics have been simplified. A 57km existing road will be upgraded to link the site with the coastal road (total distance 230km) leading to the existing extensive port facilities at Massawa, which will be used to export SOP. Previously, a new product export terminal at Anfile Bay was proposed, which required constructing a new 85km road. This logistics option also reduces project risk by potentially reducing lead time to initial exports, has more flexibility with regard to port capacity and Massawa is already host to well-established shipping corridors.
•
Mine development, based on open-pit mining, has been optimised, resulting in a more consistent waste to ore ratio, which has lowered pre-production costs.
■
Phase 2 – Capital cost is US$175m to increase production to 850ktpa SOP, which is planned to begin in year six. This is a 38% reduction on the prior PFS figure of US$282m. Product-exporting options and infrastructure at Anfile Bay will be reviewed after Phase 1 commissioning.
Capital intensity – now even lower
The Danakil Basin is an emerging potash province that has attracted a number of significant projects. Geologically, all projects have resources that include the same evaporite sequence comprising sylvinite, carnallite and kainitite. Using recent publicly available information, we have compared the Colluli project with other projects in the Danakil Basin, as well as with very large projects that are under consideration for development in Canada.
Colluli has the advantage of having the lowest capital intensity of the companies considered (Exhibit 1) because:
■
The deposit is shallow and can be developed as a relatively low-cost open pit rather than as a solution or underground operation.
■
Open-pit allows selectivity in mining, to mine and blend the various sequences to maximum economic benefit. DNK has the ability to focus on higher-value SOP production, although it also has the ability to produce lower-priced potash products, such as MOP.
■
Open-pit mining provides flexibility of the mining rate, allowing a smaller initial operation at a lower absolute capital cost with potential for a substantial increase in scale as market opportunities arise. Because of infrastructure established at the outset, subsequent expansions can be implemented at lower capital intensity (eg Colluli Phase 2 has a lower capital intensity than Phase 1).
■
Evaporation pond sizes are substantially smaller relative to solution mining because salts are mined in solid form.
■
Compared to some of the very large high-profile, high-capacity, capital-intensive potash projects being pursued in locations such as Canada, Colluli has a much lower capital intensity and fundable scale but still has substantial potential to expand.
■
DNK believes Colluli has the potential to grow to an ultimate capacity of 4-5Mt pa of potash products.
Exhibit 1: Capital intensities of different potash projects
Danakil Basin projects |
Canadian projects |
|||||||
Operator |
DNK |
DNK |
Allana |
Circum |
Yara |
BHP |
RIO/Acron |
|
Project |
Colluli 1 |
Colluli 1 and 2 |
Danakil |
Dallol |
Jansen |
KP405 |
||
Country |
Eritrea |
Eritrea |
Ethiopia |
Ethiopia |
Ethiopia |
Canada |
Canada |
|
Capex (US$m) |
298 |
473 |
642 |
2,580 |
740 |
14,000 |
4,000 |
|
SOP (Mtpa) |
0.43 |
0.85 |
0.75 |
0.60 |
||||
MOP (Mtpa) |
1.00 |
2.00 |
10.00 |
3.00 |
||||
Total (SOP+MOP) |
0.43 |
0.85 |
1.00 |
2.75 |
0.60 |
10.00 |
3.00 |
|
Total (MOP equivalent)* |
0.61 |
1.21 |
1.00 |
3.07 |
0.86 |
10.00 |
3.00 |
|
Capital intensity (US$/t actual product basis) |
702 |
556 |
642 |
938 |
1,233 |
1,400 |
1,333 |
|
Capital intensity (US$/t MOP equivalent) |
491 |
390 |
642 |
840 |
863 |
1,400 |
1,333 |
|
Extraction method |
Open pit |
Open pit |
Solution |
Solution |
Solution |
Underground |
Solution |
|
Minimum depth (m) |
16 |
16 |
100 |
1,000 |
1,750 |
|||
Source: Company releases, Edison Investment Research. Note: *SOP rate grossed up to account for approximately 30% price premium to MOP.
Operating costs – mine gate costs similar, land transport higher
DFS operating costs represent total cash costs, including royalties, incurred in mining, processing and delivering SOP product to the FOB point of sale at the port of Massawa.
■
Mine gate cash costs – Phase 1 costs in the DFS have increased slightly (+4%) to US$168/t SOP from US$162/t SOP in the PFS. The average for the first 60 years of production for Phase 1 and Phase 2 combined is unchanged at US$141/t.
■
Product logistics cash costs – DFS costs are US$66.94/t SOP and US$66.29/t SOP for Phase 1 and Phase 2, respectively. These are higher than PFS costs of US$27.42/t and US$27.35/t, respectively. The main reason for this is the longer trucking distance of 230km by road to the port of Massawa compared with the shorter distance to the previously proposed custom-built export facility at Anfile Bay.
■
Royalty costs – A mining royalty of 3.5% on gross revenue applies. This adds about US$20/t SOP to costs at the SOP price (FOB Massawa) of US$572/t used in the DFS.
■
Total cash costs – Phase 1 and Phase 2 total cash costs, including royalties, are US$255/t SOP and US$227/t SOP, respectively. These represent an approximate 20% increase on PFS costs of US$210/t SOP and US$189/t SOP, respectively, mainly due to the increased logistics costs as described above.
Competitive strengths of the Colluli potash project
In addition to its low capital intensity, we highlight some of the other strengths of the Colluli project:
■
The Colluli reserve ranks as one of the largest and shallowest potash resources globally. The JORC-2012 compliant ore reserve (Exhibit 2) is 1.11Bt at 10% K2O (19% K2SO4 equivalent). The resource remains open to the south-east of Area A and to the north of Area B. The geology is dominated by an evaporate sequence with potash-bearing minerals overlain and underlain by rock salt layers.
Exhibit 2: Colluli ore reserve estimate (JORC-2012)
Proven |
Probable |
Total |
||||
Occurrence |
Mt |
K2O equiv (%) |
Mt |
K2O equiv (%) |
Mt |
K2O equiv (%) |
Sylvinite (KCl.NaCl) |
78 |
15 |
175 |
12 |
253 |
13 |
Carnallitite (KCl.MgCl2.H20) |
79 |
7 |
284 |
8 |
363 |
8 |
Kainitite (KCl.MgSO4.H2O) |
129 |
12 |
368 |
11 |
497 |
11 |
Total |
286 |
11 |
820 |
10 |
1,113 |
10 |
K2S04 equiv (%) |
20 |
19 |
19 |
|||
Contained SOP |
58 |
152 |
210 |
Source: Danakali. Note: Equivalent K2SO4 (SOP) calculated by multiplying K2O5% by 1.85. Reserve at 30 November 2015.
■
Potassium salts in solid form – lower costs, better overall resource recovery and less working capital than solution mining. There is an evaporite sequence comprising three potassium salts in solid form. This provides the ability to produce a range of potash fertiliser products that includes potassium sulphate (SOP), potassium magnesium sulphate (SOP-M) and potassium chloride (MOP).
•
The top potash layer is sylvinite, composed of sylvite (KCl) plus halite, which is up to 10m thick.
•
Below the sylvite is the intermediate member comprising carnallitites composed of carnallite (KMgCl3.6H2O) plus halite and bischofite (MgCl2.6H20) with thickness varying from 3-25m.
•
Below the intermediate member is the kainitite member composed of kainite (KMgSO4.3H2O) plus halite, which is 5-15m thick. Kainite represents about 50% of the Colluli resource.
■
Very long mine life – potential for >200-year mine life.
■
Significant potential for expansions – the size of the resource supports the potential to grow to an ultimate capacity of 4-5Mtpa.
■
Potash mineralisation is shallow – this allows low-cost mining by open-pit. The mineralisation starts at 16m with a maximum depth of 140m. Extraction is proposed by conventional truck and shovel techniques, along with continuous miners. The ore is soft and there is no need for blasting during construction or during production activities.
■
Simple, low-cost processing – lowest-energy, highest-yield conversion to high-purity SOP.
i.
The kainite is decomposed, which generates excess sulphate.
ii.
Potassium chloride from decomposed sylvite and carnallite is then combined with decomposed kainite. Ore containing sylvite and carnallite is decomposed and recombined with decomposed kainite. After a reaction at ambient temperature, SOP is precipitated. This is the lowest-energy, highest-yield conversion route to product SOP.
iii.
Potassium yields are further improved using a series of ponds to collect excess brines exiting the process plant. Overall recoveries are >80%. The Colluli process is expected to produce SOP with a purity of over 98% SOP, which is greater than 52% K2O equivalent. This compares with a typical purity of 94% for many SOP producers. After drying, the SOP is compacted into granules prior to export.
■
Potential for rock salt, magnesium chloride and gypsum co-products – Above and below the potash mineralisation at the Colluli project is the 10-20m upper rock salt layer and lower rock salt layer, respectively. A JORC-2012 compliant rock salt resource of >300 Mt has been defined. Potential saleable co-products rock salt, magnesium chloride, magnesium sulphate and gypsum are associated with the potash salts and need to be partially mined to gain access to the potassium salts. All three co-products have established global markets. Depending on market demand, prices and shipping costs, additional revenue from co-products is possible.
Shareholders' agreement between DNK and ENAMCO
DNK and ENAMCO each have 50% ownership of JV company Colluli Mining Share Company (CMSC). CMSC owns 100% of the Colluli project and will seek to fund the initial development costs with a mixture of debt and equity.
■
Debt funding – CMSC will seek to fund up to 70% of project costs through commercial debt with any shortfall to be underwritten by DNK on arm's length commercial terms with repayment and security consistent with third-party debt (interest bearing loan).
■
Equity funding – The remaining 30% of project costs will be funded through equity, initially provided by DNK. The 30% contribution provided by DNK consists of 50% equity and 50% as debt (interest free loan) to fund EMAMCO’s equity contribution, which will be paid from project cash flows.
■
Repayment mechanism – After CMSC’s third-party debt is serviced, 50% of the available funds for distribution will be preferentially paid to DNK to settle ENAMCO’s 50% share of the equity contribution. This preferential payment to DNK occurs until the interest free loan has been repaid.
■
Available funds for distribution – Available funds will be evenly distributed across the JV ownership once ENAMCO’s equity contribution has been settled.
■
Ongoing production costs – Once production at Colluli begins, shareholder funding, if required, will be equally contributed by the JV partners through CMSC.
■
Board composition – CMSC has a board of five comprising three members from DNK and two from ENAMCO. Decision-making is based on consensus.
Valuation of the Colluli SOP project
Our valuations incorporate inputs from DNK’s DFS, which was released on 30 November 2015. These include capital costs, operating costs and production rates for Phase 1 and Phase 2. Commissioning of Phase 1 in Q418 is assumed. DNK has a 50% interest in the project. Our valuations are shown in Exhibit 3.
■
Our base case valuation for DNK’s 50% share of the Colluli Phase 1 project development, at a long-term SOP price of US$550/t, is A$262m (at US$0.70/A$).
■
Our base case valuation, at a long-term SOP price of US$550/t, for Phase 1 and Phase 2 project development combined, which involves a doubling of SOP production capacity, is A$534m.
■
In a financing scenario involving an equity raising at a 20% discount (to the share price of A$0.27 at 20 January 2016), the above valuations are equivalent to A$0.51/share for Phase 1 and A$0.86/share for Phases 1 and 2 combined.
■
As Colluli Phase 2 is projected to be self-funded from operating cash flow at a low capital intensity, we believe there is significant upside to the shares as milestones are delivered.
We have modelled the Colluli project using NPV10 analysis. We consider this method most appropriate to value the project as it is able to incorporate most of the parameters of the DFS. Our updated base case valuation of the project compares to our previous NPV10 estimate of US$897m on a 100% basis. The key difference in valuations stems from the updated capex and opex assumptions as per the DFS vs PFS before, as well as the slightly lower benchmark SOP price (US$550/t now vs US$572/t before).
We have determined a valuation per share by adjusting for the additional shares issued and the equity raise. We have assumed financing on the basis of 70% debt and 30% equity.
■
We believe the 20% discount is reasonable given that the funds are being used to build a long life operating asset based on a globally significant potash resource. The new shares issued will depend on the prevailing DNK share price and, as a result, may vary.
■
We have valued both Colluli Phase 1 (425ktpa SOP over 30 years) and Colluli Phases 1 and 2 combined (expansion to 850Ktpa after year five for a total 30-year life).
■
We assume Phase 1 development capital of US$298m will be funded by debt and equity, as above. We assume development capital of US$175m for the Phase 2 development, if it proceeds, is funded from operating cash flow without using additional debt or equity.
■
We also carried out scenario analysis to determine valuations at alternative long-term SOP prices of US$450/t, US$500/t and US$600/t. While the SOP market is not very transparent, according to IC Potash, the global SOP price averaged US$650/t in Q315.
Exhibit 3: Valuation of the Colluli SOP project
Phase 1 |
Phase 2 |
||||||||||
SOP price (US$/t) |
450 |
500 |
550 |
600 |
450 |
500 |
550 |
600 |
|||
Valuation (project) (US$m) |
157 |
262 |
367 |
472 |
402 |
576 |
748 |
921 |
|||
Valuation (DNK 50% share) (US$m) |
79 |
131 |
184 |
236 |
201 |
288 |
374 |
461 |
|||
Valuation (DNK 50% share) (A$m) |
112 |
187 |
262 |
337 |
287 |
411 |
534 |
658 |
|||
Phase 1 capex (project) (US$m) |
298 |
||||||||||
Financing debt (project) (US$m) |
209 |
||||||||||
Financing equity (project) (US$m) |
89 |
||||||||||
DNK equity raising (A$m) (A$/US$ 0.70) |
128 |
128 |
128 |
128 |
128 |
128 |
128 |
128 |
128 |
||
DNK valuation (A$m) |
240 |
315 |
390 |
465 |
415 |
539 |
662 |
786 |
|||
DNK valuation (A$/share) |
0.31 |
0.41 |
0.51 |
0.61 |
0.54 |
0.70 |
0.86 |
1.03 |
|||
Issued shares after raising |
765 |
765 |
765 |
765 |
765 |
765 |
765 |
765 |
765 |
||
Issued shares calculation |
|||||||||||
DNK share price (at 20 Jan 2016) (A$) |
0.27 |
||||||||||
Assumed new issue price (20% disc) (A$) |
0.22 |
||||||||||
Additional shares issued |
591 |
||||||||||
Existing issued shares |
174 |
Source: Donakali, Edison Investment Research
We have also assessed the impact of changes in the DNK share price on the number of shares issued for the 30% equity portion of the US$298m Phase 1 Colluli project. This is presented in Exhibit 4.
Exhibit 4: Impact of share price on issued shares after assumed equity raising
DNK share price (A$) |
0.23 |
0.25 |
0.27 |
0.29 |
0.31 |
Assumed new issue price (20% disc) (A$) |
0.18 |
0.20 |
0.22 |
0.23 |
0.25 |
Additional shares issued |
694 |
639 |
591 |
550 |
515 |
Existing issued shares |
174 |
174 |
174 |
174 |
174 |
Issued shares after raising |
868 |
813 |
765 |
725 |
689 |
Source: Edison Investment Research
Financials
Following a periodic review, it was determined that DNK’s interest in CMSC was more appropriately classified as an interest in a joint venture and should be accounted for using the equity method. This was first applied for the June half, 2015 with the accounting treatment corrected by restating prior periods for the half years to 30 June 2014 and 31 December 2014.
In Exhibit 5, we have applied equity accounting from the year ending December 2015, which relates to an 18 month period.
The financial summary in Exhibit 5 incorporates DNK’s 50% share of the debt and equity raised in our funding scenario to develop the Colluli project, with project commissioning scheduled for Q418. Under the Shareholders’ agreement between DNK and ENAMCO, CMSC will seek to fund up to 70% of project costs through commercial debt with provision for the JV to arrange project debt funding directly.
Exhibit 5: Financial summary
A$000 |
2013 |
2014 |
2015e |
2016e |
2017e |
2018e |
2019e |
||
31-December ** |
IFRS |
IFRS |
IFRS |
IFRS |
IFRS |
IFRS |
IFRS |
||
PROFIT & LOSS |
|||||||||
Revenue |
|
|
147 |
107 |
250 |
150 |
150 |
150 |
150 |
EBITDA |
|
|
(1,433) |
(1,170) |
(2,000) |
(1,350) |
(1,350) |
(1,350) |
(1,350) |
Operating Profit (before amort. and except.) |
(1,639) |
(1,456) |
(2,450) |
(1,650) |
(1,650) |
(1,650) |
(1,650) |
||
Intangible Amortisation |
0 |
0 |
0 |
0 |
0 |
0 |
0 |
||
Share based payments |
(257) |
(581) |
(500) |
0 |
0 |
0 |
0 |
||
Other |
(4,236) |
(4,155) |
0 |
0 |
0 |
0 |
0 |
||
Exceptionals |
0 |
0 |
0 |
0 |
0 |
0 |
0 |
||
Operating Profit |
(6,132) |
(6,192) |
(2,950) |
(1,650) |
(1,650) |
(1,650) |
(1,650) |
||
Net Interest |
833 |
444 |
139 |
134 |
973 |
(1,817) |
(6,823) |
||
Share of equity accounted investment |
0 |
0 |
(4,750) |
(3,000) |
(3,000) |
5,393 |
81,082 |
||
Profit Before Tax (norm) |
|
|
(5,043) |
(5,168) |
(7,561) |
(4,516) |
(3,677) |
1,926 |
72,610 |
Profit Before Tax (FRS 3) |
|
|
(5,300) |
(5,748) |
(7,561) |
(4,516) |
(3,677) |
1,926 |
72,610 |
Tax |
0 |
0 |
0 |
0 |
0 |
(732) |
(27,592) |
||
Profit After Tax (norm) |
(5,043) |
(5,168) |
(7,561) |
(4,516) |
(3,677) |
1,194 |
45,018 |
||
Profit After Tax (FRS 3) |
(5,300) |
(5,748) |
(7,561) |
(4,516) |
(3,677) |
1,194 |
45,018 |
||
Minority Interest |
0 |
874 |
0 |
0 |
0 |
0 |
0 |
||
Net income (normalised) |
(5,043) |
(4,294) |
(7,561) |
(4,516) |
(3,677) |
1,194 |
45,018 |
||
Net income (FRS3) |
(5,300) |
(4,875) |
(7,561) |
(4,516) |
(3,677) |
1,194 |
45,018 |
||
Average Number of Shares Outstanding (m) |
127.3 |
128.4 |
151.2 |
765.5 |
765.5 |
765.5 |
765.5 |
||
EPS - normalised (c) |
|
|
(4.0) |
(3.3) |
(5.0) |
(0.6) |
(0.5) |
0.2 |
5.9 |
EPS - normalised fully diluted (c) |
|
|
(3.6) |
(3.3) |
(5.0) |
(0.6) |
(0.5) |
0.2 |
5.9 |
EPS - (IFRS) (c) |
|
|
(4.2) |
(3.8) |
(5.0) |
(0.6) |
(0.5) |
0.2 |
5.9 |
Dividend per share (Ac) |
0.0 |
0.0 |
0.0 |
0.0 |
0.0 |
0.0 |
0.0 |
||
Gross Margin (%) |
N/A |
N/A |
N/A |
N/A |
N/A |
N/A |
N/A |
||
EBITDA Margin (%) |
N/A |
N/A |
N/A |
N/A |
N/A |
N/A |
N/A |
||
Operating Margin (before GW and except.) (%) |
N/A |
N/A |
N/A |
N/A |
N/A |
N/A |
N/A |
||
BALANCE SHEET |
|||||||||
Fixed Assets |
|
|
396 |
93 |
93 |
85,054 |
170,104 |
275,894 |
268,794 |
Intangible Assets |
0 |
0 |
0 |
0 |
0 |
0 |
0 |
||
Tangible Assets |
396 |
93 |
93 |
21,197 |
106,247 |
212,037 |
204,937 |
||
Investments, other |
0 |
0 |
0 |
63,857 |
63,857 |
63,857 |
63,857 |
||
Current Assets |
|
|
14,392 |
9,406 |
14,138 |
97,774 |
493 |
5,489 |
54,892 |
Stocks |
0 |
0 |
0 |
0 |
0 |
0 |
0 |
||
Debtors |
132 |
131 |
740 |
493 |
493 |
493 |
493 |
||
Cash |
14,260 |
9,275 |
13,398 |
97,280 |
0 |
0 |
0 |
||
Other |
0 |
0 |
0 |
0 |
0 |
0 |
0 |
||
Current Liabilities |
|
|
(731) |
(432) |
(370) |
(247) |
(247) |
(2,792) |
(25,704) |
Creditors |
(731) |
(432) |
(370) |
(247) |
(247) |
(247) |
(247) |
||
Short term borrowings |
0 |
0 |
0 |
0 |
0 |
0 |
0 |
||
Long Term Liabilities |
|
|
(13) |
0 |
0 |
0 |
(36,337) |
(136,451) |
(59,634) |
Long term borrowings |
0 |
0 |
0 |
0 |
(36,337) |
(136,451) |
(59,634) |
||
Other long term liabilities |
(13) |
0 |
0 |
0 |
0 |
0 |
0 |
||
Net Assets |
|
|
14,043 |
9,067 |
13,861 |
182,581 |
134,013 |
142,140 |
238,349 |
Minority Interest |
0 |
879 |
0 |
0 |
0 |
0 |
0 |
||
Net Assets |
|
|
14,043 |
9,946 |
13,861 |
182,581 |
134,013 |
142,140 |
238,349 |
CASH FLOW |
|||||||||
Operating Cash Flow |
|
|
(11,664) |
(5,674) |
(6,750) |
(4,350) |
(4,350) |
4,043 |
79,732 |
Net Interest |
983 |
479 |
139 |
134 |
973 |
(1,817) |
(6,823) |
||
Tax |
0 |
0 |
0 |
0 |
0 |
0 |
0 |
||
Capex |
(182) |
0 |
0 |
(21,300) |
(85,200) |
(106,500) |
(5,143) |
||
Acquisitions/disposals |
49 |
9 |
0 |
0 |
0 |
0 |
0 |
||
Financing |
3,785 |
201 |
6,095 |
63,857 |
0 |
0 |
0 |
||
Dividends |
0 |
0 |
0 |
0 |
0 |
0 |
0 |
||
Net Cash Flow |
(7,029) |
(4,985) |
(516) |
38,341 |
(88,577) |
(104,274) |
67,767 |
||
Opening net debt/(cash) |
|
|
(21,288) |
(14,260) |
(9,275) |
(8,759) |
(47,100) |
41,477 |
145,751 |
HP finance leases initiated |
0 |
0 |
0 |
0 |
0 |
0 |
0 |
||
Other |
0 |
(0) |
0 |
0 |
0 |
0 |
0 |
||
Closing net debt/(cash) |
|
|
(14,260) |
(9,275) |
(8,759) |
(47,100) |
41,477 |
145,751 |
77,984 |
Source: Edison Investment Research, company accounts. ** Note: Year end changed from June to December from 2015, hence 2015e relates to an 18 month period.
|