Providing an increasing range of specialist competences
Cohort is a holding company for five autonomous and innovative businesses operating primarily in the defence and security markets, with a UK bias that is slowly being diluted by increased exports and acquisitions. The group executive management provide the strategic and financial guidance that enables the operations to focus on long-term core contracts while retaining the flexibility to address more immediate needs, as well as assist with export pursuits. Subsidiaries also benefit from exchange of ideas and adoption of best practice. The strategy to drive organic growth augmented by selective acquisitions continues to be successfully delivered, with FY16 adjusted operating profit rising by 18%, of which c 28% came from full contributions of prior year acquisitions, J+S and MCL. Adjusted EPS excluding a 2.2p one-off tax credit rose 22% to 24.98p.
The success in acquiring control of EID in late June marks the first overseas acquisition, bringing with it new clients both within NATO Europe and other export territories such as Indonesia and Egypt. While the completion of the transaction was delayed, the value generated during the negotiation period accrued to the benefit of Cohort shareholders, with performance at least matching expectations. EID is expected to account for around 60% of the FY17 revenue growth, and generate low-teens margins. Organic growth looks underpinned by the solid order backlog and the expectation of several long-term contract renewals in the current year.
Portfolio effects should add value
We now base our fair value calculation on an average of a capped DCF forecast and a calendar 2017 based peer group sum-of-the-parts calculation, which currently returns a value of 439p. Management has indicated that it intends to buy in the outstanding MCL minority for £5.5m in the current year, and this is expected to happen by the financial year end. In addition, the purchase of a further stake in EID of 23% for £2.7m is expected to complete by the end of November 2016. We have adjusted our valuations to reflect these changes to debt and minority contributions this year and beyond. The buy-in of the MCL minority would remove a significant element of current earnings dilution. In addition, the favourable tax treatment of R&D credits should enable a subnormal tax rate to be maintained for the time being.
Financials: Reassurance from AGM statement
We feel FY17 expectations remain well supported following the AGM statement. Interim results are due in December. Opening order book cover for sales was 55% (excluding EID), and improved through August to be ahead of the comparable point in FY16. Major contract renewals and opportunities valued at c £60m are expected to convert this year. EID’s initial 10-month contribution feels conservative, with a sales rate comparable to the December 2015 outturn and low-teen margins. Excluding the tax benefit in FY16, we expect adjusted EPS to grow 4% in FY17.
Sensitivities: Still constrained UK defence environment
Notwithstanding the recent acquisition of EID in Portugal, Cohort’s prospects remain dependent on the UK Ministry of Defence (MOD). As a specialist and expert solutions provider, the focus on achieving value for money arising from constrained budgets plays well to Cohort’s strategy. Pace of spending and demand for new solutions is also influenced by operational imperatives. As Cohort seeks to increase export and overseas content this adds new potentials with associated challenges, while introducing an increased element of FX exposure.
Company description: Leveraging defence expertise
Since floating on AIM in 2006, Cohort has been progressively pursuing its strategy of building an independent group in defence technical services, systems and products, both through organic growth and bolt-on acquisitions. A series of acquisitions has seen the company continue to develop, despite pressures on defence budgets since the financial crisis. The group remains a predominantly defence and security company (91% of FY16 sales), but has small positions servicing markets in oil & gas (3%), transport (3%) and other commercial markets (3%, including education).
Exhibit 1: Revenue by customer (FY16)
|
Exhibit 2: Revenue by capability (FY16)
|

|

|
|
|
|
Exhibit 1: Revenue by customer (FY16)
|
|
|
|
Exhibit 2: Revenue by capability (FY16)
|
|
|
|
Focused defence skillsets facilitating growth
Cohort provides a holding company structure for five autonomous subsidiaries, all of which provide specialist capabilities for varying defence and security niches, as shown in Exhibit 3. These capabilities are being extended to commercial opportunities where appropriate, eg ICT and cyber.
Exhibit 3: Cohort core capabilities by subsidiary
|

|
|
|
Since 2014, acquisitions plus organic growth have resulted in a trebling of defence product sales to £47m or 42% of group sales (excluding EID). The External Communications Systems (ECS) for UK submarines was a significant element of the organic expansion, with MCL largely a defence products business expanded by the major hearing protection system award in August 2015. EID will likely increase this proportion to around 50% in FY17. Operational support sales have also almost trebled over the least two years and now account for 10% of group sales (£11.3m), boosted by increased export activity for EW and despite some slowdown in offshore support activity for J+S. Training sales have continued to grow, by 32% since 2014, underpinned by on the job and scenario training undertaken by SCS. Studies and analysis saw revenues increase by 46% over the last two years, continuing its upward trend. Application software and secure networks (lower education activity) have been the two main areas of revenue declines over the last two years. Applied research fell last year as the four-year Delivering Dismounted Effect element of the UK’s dismounted soldier programme completed during FY16. Replacement projects are expected from H217. Specialist expertise sales have remained broadly stable in the £10-12m range since 2012 as SCS, MASS and to a lesser extent SEA provide expert individuals to customer teams.
Exhibit 4: Cohort revenue development by capability
|

|
Source: Cohort company reports
|
At the year-end Cohort had an order backlog of £116.0m (Exhibit 5) of which £65.3m is deliverable in FY17, £28.8m in FY18 with the remainder extending out to 2023 (Exhibit 6). It should also be noted that order intake during the period was the second highest level since the exceptional intake in FY10. While this was significantly lower than the £134m at the start of the year, Cohort has been working through several major long-term contracts where renewal is expected in the current year. The addition of EID with a significant backlog is indicated to modestly increase the overall level of order cover for FY17.
Exhibit 5: Cohort order book development (before EID)
|

|
Source: Company reports. Note: SEAs space business disposed of in 2014 (order book £10.4m in 2013).
|
The order cover indicated by the company at the start of the year, on expected revenues of £120m was 55%. While this was slightly lower than in recent years, the order renewals should boost the FY17 deliverables further as well as topping up the outer years. This is particularly true at SEA where major multi-year contracts signed in the current year and development programmes for the MOD should reverse the consumption of backlog seen in FY16. While the deliverable profiles for MASS and MCL are in better shape than a year ago, these could also be enhanced in FY17. SCS seems likely to remain comparatively flat.
Exhibit 6: Cohort order book and associated revenue profile (£m excludes EID)
|

|
|
|
Renewals of more than £60m are expected in the current year. Important additional order opportunities identified by the company for FY17 are
■
Export EWOS work at MASS
■
Sentry aircraft support work for MASS
■
Next phase of the Dismounted Soldier research programme for SEA
■
Support work for Transport for London at SEA
■
Further hearing protection orders at MCL
Combining organic development with focused M&A
The company’s strategy remains unaltered. It continues to offer a variety of specialised engineering, integration and systems knowledge to defence customers. Much of this is through the organic development of core divisions such as MASS and SEA, but management continues to seek acquisitions to further complement this growth. The latest of these, EID in Portugal, extends the strategy to overseas opportunities, in addition to the UK centric purchases that have seen the group develop to its current structure.
The focus on specialist expertise and competences supports innovative and flexible offerings to its customers, and enables the group to maintain healthy returns from what are often niche capabilities, despite some major international competitors.
The overall environment for defence expenditure should be improving due to global security and geopolitical concerns although to date, spending levels have remained subdued in the UK. Cohort is positioned to benefit from higher growth spending areas within the UK defence budget such as submarines, electronic warfare and cyber. The group operates through five autonomous subsidiaries, each of which should be able to leverage opportunities that such an improvement should provide. In addition, further expansion to overseas markets should drive incremental top-line growth potential both through direct exports as well as EID in Portugal.
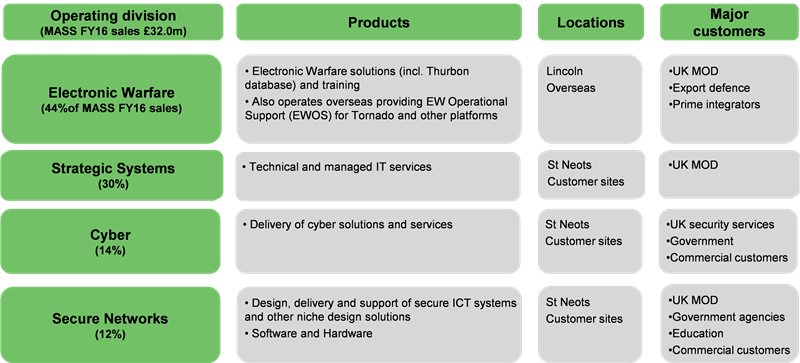
MASS was founded in 1983 and was acquired by Cohort in August 2006 for £13m. Operating from sites in Lincoln and St Neots, MASS (derivation: mathematical and associated scientific services) provides the core capabilities in Cohort’s electronic warfare (EW) and ICT services offerings. It serves the defence, governmental, education and commercial markets, and includes Cohort’s developing cyber capability. MASS competes against significant defence electronic and cyber security providers including Ultra Electronics, Leonardo, Thales, CGI group, and BAE Systems.
MASS has remained a robust performer within Cohort’s portfolio. Revenues having grown at a 6.4% CAGR over the past five years, generating high-teen margins from a mix of long-term operational support contracts with recurring revenues and increased high margin EW export activity. The Thurbon EW database remains at the core of the activity both in support of Project Shepherd in the UK as well as enabling export customers to build their own analysis capability. MASS is the clear leader in this field supplying the tool, training and operational support. It is also the hub for the development of the group’s rapidly emerging cyber capabilities, as well as the provision of secure networks and IT infrastructure for educational and commercial customers.
A favourable mix of sales in FY16 resulted from lower education activity offset by growth in EW, cyber and strategic systems. This generated a 9% increase in adjusted operating profit from a relatively flat sales performance, a margin of 18.7%. The level of margin is expected to reduce slightly as MASS continues to grow the proportion of business with higher bought in content where margins are lower, notably in the UK, while still growing EW levels both domestically and for export.
Cohort acquired a controlling 50% plus one share stake in MCL (Marlborough Communications Ltd) for £8.8m in July 2014. Based in Surrey, MCL has been supplying specialised and innovative communications and surveillance technologies to meet C4ISR and ISTAR missions for the UK armed forces since it was founded in 1980. It identifies requirements, designs solutions and/or seeks out available technologies to meet them, and supports advanced electronic and surveillance technologies in operation. It supplies the special forces and intelligence agencies, but technologies are increasingly being adopted by the regular army. The customisation of commercial off the shelf technologies (COTS) differentiates MCL’s business model from other Cohort group businesses. MCL competes against a range of niche systems suppliers, which are often small private ventures.
MCL’s performance has been encouraging with the award of a major hearing protection contract for the British Army opening a new stream of revenues with improved visibility. Order intake of £18m represented a book to bill ratio of 1.31x, with a strong pipeline of opportunities for the current year, notably in hearing protection.
Cohort retains an option to acquire the remaining shares in MCL after September 2016 based on EBIT and order book at that time. This was originally capped at up to £12.5m, but is included in the FY16 accounts with a carrying value of £5.5m. We expect Cohort management to exercise its option before the year end. At present we are assuming no benefit from an early call of the option, but any such move would enhance group earnings due to the minority’s contributions.
SCS (Systems Consultants Services Ltd) has been part of the group since flotation in March 2006. It provides technical advisory services primarily to defence customers, government agencies and private sector customers, predominantly in the form of expert consultant personnel. SCS competitors include expert advisory companies such as QinetiQ and Atkins, although new entrants are being encouraged by a lack of resource within the MOD to act in the “customer friend” role.
The largest part of its business is the provision of on the job and scenario based training support operations of SCS. The business tends to respond positively to periods of high operational activity for the UK and other armed forces when capability gaps are often identified and require a quick and expert response. However, it is supported by several major long-term contracts. In FY16 the company extended its high level, computer based operational training service contract for the UK’s Joint Warfare Command by a further two years with an option to continue to 2020. To date, Cohort has fulfilled this role for over 15 years. Air Systems provides regulatory and technical assurance and evaluation services to both military and civil authorities.
In FY16 revenues at SCS improved to £18.1m driven by training support work. Margins fell 90bps to 6.9% leaving profits slightly below FY15. This was largely due to unfavourable mix as the prior year was still benefitting from the tail of operational activity in Afghanistan. Despite entering the year with an improved backlog of £11.8m (£9.8m), trading conditions are expected to remain difficult through FY17, as noted in the recent AGM statement, with the Air Systems activity expected to fall.
SEA (Systems Engineering and Assessment Ltd) was acquired in October 2007 for £25m. SEA operates in four market facing divisions: Maritime, Research & Technical Support, Software Solution & Products, and Subsea Engineering. Across its various activities, SEA competes against major companies such as Thales, QinetiQ, Selex and Babcock.
A key element of SEA’s activity is the supply of the External Communications System (ECS) for Royal Navy submarines. In March the company was awarded a £17m contract by BAE Systems for the supply of its equipment for the second stage of the common ECS (cECS) programme. It covers critical procurement and design into 2017, with follow on orders expected. Ultimately, the cECS will be provided for all Royal Navy submarines. The cECS is expected to reduce system cost, improve operational efficiency and increase the flexibility and sustainability of the fleet. SEA has been supplying its ECS to the Astute programme since 2009, with five boats covered. The initial cECS design contract was awarded to SEA in October 2014. The timing of ECS orders has a significant impact on sales, cash flow and order book, and while the UK programme has peaked in terms of design and engineering sales, domestic deliveries will be augmented by future higher margin export orders including torpedo launchers.
Divisional sales grew by 21% and adjusted operating profit was 35% higher in FY16, largely due to a full contribution from J+S (seven months in FY15). Underlying organic growth was a healthy 6% at the sales level and 32% at the profit level. J+S is now fully integrated which has generated the anticipated annual operational savings of around £0.5m. When acquired J+S brought both defence and offshore energy activity with it, broadening SEA’s capability and offering and extending export territories. Defence products included sonar systems, torpedo launchers and a range of other naval equipment, with subsea engineering capabilities based in Aberdeen.
While the offshore energy segment has proven more challenging than expected at the time of the purchase of J+S in 2014, it has continued to boost SEA’s performance. Offshore energy sales in FY16 actually grew to £3.0m from £2.0m in FY15 despite the oil price weakness.
Transport sales fell slightly in FY16 to £3.5m, despite strong growth of the ROADflow traffic monitoring and enforcement systems. Activity was held back by deferrals from rail customers for the Red Light Systems for level crossings, but these are expected to increase as safety remains a priority issue.
The acquisition of an initial 57% stake in EID was completed on 27 June 2016. A further 23% is expected to be acquired before the end of November on the existing terms, with the Portuguese government expected to retain a minority stake of 20% thereafter. The increase in Cohort’s holding should be modestly earnings enhancing. Andy Thomis and Simon Walther have joined the board.
Based near Lisbon with a regional office in Malaysia, EID employs around 140 people. Revenues in calendar 2015 were £15.7m (€18.8m) which exceeded expectations, generating an EBIT of £2.4m (€2.9m) a margin of just over 15%. It was stated on completion to have a positive cash flow, a strong order book and a healthy sales pipeline. It has an experienced management team and a modern manufacturing facility at its main location. EID has been spending around 10% of sales on self-funded R&D to upgrade its technology, notably to IP based communications systems. The last known order book was €35.2m at March 2015, but this is likely to have fallen as contracts have been executed.
Over the last few years EID has been placing increasing emphasis on higher margin export markets as budget constraints in Portugal have hit home. EID’s offerings have proved to be highly attractive in export markets compared to some of the more major suppliers like Harris, Rohde and Schwarz and Thales, combining a high level of functionality and technical sophistication with a low cost base and competitive pricing. At present domestic activity is focused on longer-term support work providing a recurring stream of revenues, although contracts tend to be relatively short and renewed on a regular basis. EID is one of the few capable domestic producers and is thus well positioned to gain from any increase in new equipment programmes. While highly volatile, we believe the domestic market accounts for around 20%-40% of EID sales.
In addition to adding Portugal as a home market, EID also contributes the strong and growing export market relationships it has developed, both to other NATO Europe countries and further afield, for example Egypt and Indonesia. For example, over 130 warships now utilise EID’s communications equipment, which can be provided for both new build and upgrade projects. This global presence is expected to stimulate new export opportunities for Cohort’s existing businesses.
Exhibit 14: Cohort revisions to estimates
Year to April (£m) |
2017e |
% |
2018e |
% |
|
Prior |
New |
change |
Prior |
New |
change |
MASS |
34.1 |
34.1 |
0.0 |
37.1 |
37.1 |
0.0 |
SCS |
17.5 |
17.5 |
0.0 |
17.5 |
17.5 |
0.0 |
SEA |
50.0 |
50.0 |
0.0 |
53.5 |
53.5 |
0.0 |
MCL |
17.0 |
17.0 |
0.0 |
18.0 |
18.0 |
0.0 |
EID |
13.1 |
13.1 |
0.0 |
17.3 |
17.3 |
0.0 |
Total Group |
131.7 |
131.7 |
0.0 |
143.4 |
143.4 |
0.0 |
|
|
|
|
|
|
|
EBITDA |
15.1 |
15.5 |
3.1 |
16.4 |
17.0 |
3.4 |
|
|
|
|
|
|
|
MASS |
6.1 |
6.1 |
0.0 |
6.3 |
6.3 |
0.0 |
SCS |
1.3 |
1.3 |
0.0 |
1.3 |
1.3 |
0.0 |
SEA |
5.7 |
5.7 |
0.0 |
6.2 |
6.2 |
0.0 |
MCL |
1.9 |
1.9 |
0.0 |
2.0 |
2.0 |
0.0 |
EID |
1.7 |
1.7 |
0.0 |
2.4 |
2.4 |
0.0 |
HQ Other and intersegment |
-2.5 |
-2.5 |
0.0 |
-2.5 |
-2.5 |
0.0 |
Adjusted OPBIT (pre PPA amortisation) |
14.3 |
14.3 |
0.0 |
15.6 |
15.6 |
0.0 |
|
|
|
|
|
|
|
Underlying PTP |
14.3 |
14.3 |
0.3 |
15.6 |
15.7 |
0.3 |
|
|
|
|
|
|
|
EPS - underlying continuing (p) |
26.5 |
25.9 |
2.8 |
31.3 |
31.6 |
0.9 |
DPS (p) |
7.0 |
7.0 |
0.0 |
8.0 |
8.0 |
0.0 |
Net cash/(debt) |
4.6 |
5.2 |
17.2 |
12.1 |
12.5 |
7.4 |
Source: Edison Investment Research estimates
Our estimates for Cohort remain unchanged at the revenue and adjusted operating profit level. However, we have slightly adjusted both our depreciation and acquired intangible amortisation levels to more appropriately reflect the changes in the structure of the group. This leads to a slight uplift in EBITDA. We have also assumed a modest net interest inflow as the completion of the EID acquisition is expected to leave the company with significant net cash balances. EID is to be 100% consolidated, with an initial minority of 43% expected to fall to 20% by the half year as the increased stake is purchased. The purchase price allocation has yet to be published by management, but we have assumed a significant intangible recognition of £7.5m relating principally to contracts acquired and an aggressive amortisation period of five years.
We continue to assume the outstanding 50% MCL minority will be bought in by the end of the year, and that the EID stake will be increased to 80% from the initial 57% by the end of November. The resultant adjustments at the earnings level, including the aforementioned PPA amortisation changes, combined with a lower average share count due to an increase in treasury stock results in a modest adjustment to our basic adjusted EPS estimates for FY17 and FY18.
A lower tax charge of around 16% is expected in FY17, and long term changes to the R&D tax treatment may provide further favourable reductions to the rate in future years. FY16 adjusted EPS of 27.18p included one-off tax credits amounting to around 2.20p per share. Thus our revised EPS forecast for FY17 represents growth of just under 9%. Our view that significant EPS growth should resume in FY18 remains unchanged.
Strong cash flows funding expansion
We expect the group to continue to generate strong free cash flows enhanced by EID. The better than expected working capital performance in FY16 was largely due to further receipts from the ECS programme at SEA, which left group net funds standing at £19.8m. As noted at the prelims and in the recent AGM statement, an outflow is expected in FY17 as the contracts continue to execute. New export order advance payments and contract milestone payments could favourably improve working capital performance.
The payments for 80% of EID and the c50% MCL minority are expected to consume £12.5m. The company also expects to increase its own research and development spend to around £2m in the current year excluding EID, which compares to £1.4m in FY16. This complements a high level of customer funding received in MASS and SEA and is evidence of the group investing for organic growth through new product opportunities. Despite some increase in dividends, tax and capex, we still expect the company to retain net cash balances in excess of £5m at the end of FY17.
We expect cash flow to improve significantly in FY18, and Cohort has borrowing facilities totalling £25m that should support further M&A when the opportunities arise.
Exhibit 15: Financial summary
|
|
£m |
2013 |
2014 |
2015 |
2016 |
2017e |
2018e |
Year end 30 April |
|
|
IFRS |
IFRS |
IFRS |
IFRS |
IFRS |
IFRS |
PROFIT & LOSS |
|
|
|
|
|
|
|
|
Revenue |
|
|
70.9 |
71.6 |
99.9 |
112.6 |
131.7 |
143.4 |
Cost of Sales |
|
|
(47.6) |
(47.8) |
(70.0) |
(79.1) |
(92.5) |
(100.7) |
Gross Profit |
|
|
23.2 |
23.7 |
30.0 |
33.5 |
39.2 |
42.7 |
EBITDA |
|
|
7.9 |
8.8 |
11.0 |
13.0 |
15.5 |
17.0 |
Operating Profit (before amort. and except.) |
7.3 |
8.2 |
10.1 |
11.9 |
14.3 |
15.6 |
Intangible Amortisation |
|
|
(0.7) |
(0.1) |
(3.6) |
(6.4) |
(7.0) |
(6.7) |
Exceptionals |
|
|
1.8 |
(1.5) |
(0.6) |
(0.3) |
0.0 |
0.0 |
Other |
|
|
0.0 |
0.0 |
0.0 |
0.0 |
0.0 |
0.0 |
Operating Profit |
|
|
8.4 |
6.6 |
5.9 |
5.2 |
7.2 |
8.9 |
Net Interest |
|
|
0.1 |
0.1 |
0.1 |
0.1 |
0.0 |
0.0 |
Profit Before Tax (norm) |
|
|
7.5 |
8.3 |
10.2 |
12.0 |
14.3 |
15.7 |
Profit Before Tax (FRS 3) |
|
|
8.5 |
6.7 |
5.9 |
5.3 |
7.3 |
9.0 |
Tax |
|
|
(0.2) |
(0.8) |
(0.7) |
0.1 |
(1.6) |
(1.5) |
Profit After Tax (norm) |
|
|
7.3 |
7.7 |
8.9 |
11.2 |
12.0 |
13.2 |
Profit After Tax (FRS 3) |
|
|
8.3 |
5.9 |
5.2 |
5.4 |
5.7 |
7.5 |
|
|
|
|
|
|
|
|
|
Average Number of Shares Outstanding (m) |
|
40.2 |
40.0 |
40.1 |
40.6 |
40.2 |
40.2 |
EPS - normalised (p) |
|
|
18.2 |
19.1 |
20.5 |
27.2 |
25.9 |
31.6 |
EPS - normalised and fully diluted (p) |
|
17.9 |
18.7 |
20.0 |
26.7 |
25.4 |
31.0 |
EPS - (IFRS) (p) |
|
|
20.8 |
14.7 |
11.2 |
12.7 |
10.2 |
17.5 |
Dividend per share (p) |
|
|
3.5 |
4.2 |
5.0 |
6.0 |
7.0 |
8.0 |
|
|
|
|
|
|
|
|
|
Gross Margin (%) |
|
|
32.8 |
33.1 |
30.0 |
29.8 |
29.8 |
29.8 |
EBITDA Margin (%) |
|
|
11.2 |
12.3 |
11.0 |
11.5 |
11.8 |
11.9 |
Operating Margin (before GW and except.) (%) |
|
10.4 |
11.4 |
10.1 |
10.6 |
10.8 |
10.9 |
|
|
|
|
|
|
|
|
|
BALANCE SHEET |
|
|
|
|
|
|
|
|
Fixed Assets |
|
|
38.4 |
37.9 |
66.2 |
59.7 |
66.7 |
61.5 |
Intangible Assets |
|
|
31.5 |
29.4 |
55.8 |
49.5 |
49.9 |
43.3 |
Tangible Assets |
|
|
6.9 |
8.5 |
10.3 |
10.2 |
16.8 |
18.2 |
Investments |
|
|
0.0 |
0.0 |
0.0 |
0.0 |
0.0 |
0.0 |
Current Assets |
|
|
35.8 |
39.1 |
40.3 |
54.0 |
41.6 |
54.8 |
Stocks |
|
|
0.2 |
0.3 |
1.1 |
2.0 |
2.5 |
2.8 |
Debtors |
|
|
16.9 |
18.2 |
19.4 |
27.3 |
31.9 |
34.7 |
Cash |
|
|
16.4 |
16.3 |
19.7 |
23.1 |
5.6 |
15.6 |
Other |
|
|
2.2 |
4.3 |
0.1 |
1.6 |
1.7 |
1.8 |
Current Liabilities |
|
|
(14.4) |
(14.2) |
(26.8) |
(40.1) |
(34.4) |
(35.3) |
Creditors |
|
|
(14.4) |
(14.2) |
(26.8) |
(36.8) |
(34.4) |
(35.3) |
Short term borrowings |
|
|
0.0 |
0.0 |
(0.0) |
(3.3) |
0.0 |
0.0 |
Long Term Liabilities |
|
|
(0.7) |
(0.6) |
(16.9) |
(2.7) |
(3.1) |
(5.8) |
Long term borrowings |
|
|
0.0 |
0.0 |
(0.0) |
(0.0) |
(0.4) |
(3.1) |
Other long term liabilities |
|
|
(0.7) |
(0.6) |
(16.8) |
(2.7) |
(2.7) |
(2.7) |
Net Assets |
|
|
59.0 |
62.2 |
62.8 |
70.8 |
70.9 |
75.2 |
|
|
|
|
|
|
|
|
|
CASH FLOW |
|
|
|
|
|
|
|
|
Operating Cash Flow |
|
|
5.2 |
2.6 |
20.5 |
8.5 |
5.4 |
15.5 |
Net Interest |
|
|
0.1 |
0.1 |
0.1 |
0.1 |
0.0 |
0.0 |
Tax |
|
|
(1.1) |
0.0 |
(1.7) |
(1.8) |
(2.3) |
(2.5) |
Capex |
|
|
(0.3) |
(2.3) |
(1.1) |
(1.0) |
(2.6) |
(2.8) |
Acquisitions/disposals |
|
|
0.0 |
2.5 |
(13.5) |
(0.7) |
(12.5) |
0.0 |
Financing |
|
|
(0.4) |
(1.5) |
0.8 |
(3.2) |
0.0 |
0.0 |
Dividends |
|
|
(1.2) |
(1.5) |
(1.8) |
(2.2) |
(2.5) |
(2.9) |
Net Cash Flow |
|
|
2.3 |
(0.1) |
3.3 |
(0.3) |
(14.6) |
7.3 |
Opening net debt/(cash) |
|
|
(14.1) |
(16.4) |
(16.3) |
(19.7) |
(19.8) |
(5.2) |
HP finance leases initiated |
|
|
0.0 |
0.0 |
0.0 |
0.0 |
0.0 |
0.0 |
Other |
|
|
0.0 |
(0.0) |
(0.0) |
0.5 |
0.0 |
0.0 |
Closing net debt/(cash) |
|
|
(16.4) |
(16.3) |
(19.7) |
(19.8) |
(5.2) |
(12.5) |
Source: Company reports, Edison Investment Research estimates
Contact details |
Revenue by geography |
Arlington House
2 Riverside Drive
Theale, Reading. RG7 4SW.
UK
0118 909 0390
www.cohortplc.com |

|
Contact details |
Arlington House
2 Riverside Drive
Theale, Reading. RG7 4SW.
UK
0118 909 0390
www.cohortplc.com |
Revenue by geography |
|
Management team |
|
CEO: Andrew Thomis |
Finance Director and Company Secretary: Simon Walther |
Andrew took over as CEO of Cohort in May 2009. He graduated with an M.Eng in electrical and electronic engineering from Imperial College, London, in 1987. He spent nine years in science, technology and policy roles in the UK MOD. He left in 1996 and, after a period working with public and private sector clients at Capita plc’s management consultancy arm, joined Alvis in a strategy, M&A and business development role. Following the acquisition of Alvis by BAE Systems in 2004, he worked with Nick Prest and Stanley Carter on the creation of Cohort plc, acting as finance director during the flotation and subsequently corporate development director. From 2007 to 2009 he was managing director of MASS. |
Simon Walther joined Cohort as finance director in May 2006. After graduating with a BSc in toxicology and pharmacology from University College, London, he went on to qualify as a chartered accountant with Touche Ross in 1992. Simon moved to the Peninsular and Oriental Steam Navigation Company (P&O) in 1993 where he was appointed a chief accountant for P&O European Ferries in 1995. He has over 15 years’ relevant industry experience, with previous senior finance roles at Alvis and BAE Systems. |
Chairman: Nick Prest CBE |
|
Nick Prest became chairman of Cohort on flotation in March 2006. After graduating from Oxford in 1974, Nick joined the UK MOD. He then moved to Alvis in 1982, undertaking a variety of roles before becoming CEO in 1989 and chairman and CEO in 1996. Nick left Alvis following its acquisition by BAE Systems in 2004. He was also chairman of Aveva Group plc from 2006 until 2012 and is currently chairman of Shephard Group, a privately owned media company specialising in defence and aerospace. |
|
Management team |
CEO: Andrew Thomis |
Andrew took over as CEO of Cohort in May 2009. He graduated with an M.Eng in electrical and electronic engineering from Imperial College, London, in 1987. He spent nine years in science, technology and policy roles in the UK MOD. He left in 1996 and, after a period working with public and private sector clients at Capita plc’s management consultancy arm, joined Alvis in a strategy, M&A and business development role. Following the acquisition of Alvis by BAE Systems in 2004, he worked with Nick Prest and Stanley Carter on the creation of Cohort plc, acting as finance director during the flotation and subsequently corporate development director. From 2007 to 2009 he was managing director of MASS. |
Finance Director and Company Secretary: Simon Walther |
Simon Walther joined Cohort as finance director in May 2006. After graduating with a BSc in toxicology and pharmacology from University College, London, he went on to qualify as a chartered accountant with Touche Ross in 1992. Simon moved to the Peninsular and Oriental Steam Navigation Company (P&O) in 1993 where he was appointed a chief accountant for P&O European Ferries in 1995. He has over 15 years’ relevant industry experience, with previous senior finance roles at Alvis and BAE Systems. |
Chairman: Nick Prest CBE |
Nick Prest became chairman of Cohort on flotation in March 2006. After graduating from Oxford in 1974, Nick joined the UK MOD. He then moved to Alvis in 1982, undertaking a variety of roles before becoming CEO in 1989 and chairman and CEO in 1996. Nick left Alvis following its acquisition by BAE Systems in 2004. He was also chairman of Aveva Group plc from 2006 until 2012 and is currently chairman of Shephard Group, a privately owned media company specialising in defence and aerospace. |
|
|
Principal shareholders |
(%) |
Stanley Carter |
22.2% |
Schroder Investment Management |
14.2% |
Hargreaves Hale |
10.5% |
Nick Prest |
5.1% |
Blackrock IM |
4.2% |
Fidelity |
3.5% |
Herald IM |
3.3% |
|
Companies named in this report |
BAE Systems, QinetiQ, Ultra Electronics, Cobham, Lockheed Martin, Thales, Leonardo Finmeccanica, Babcock Group |
|
Edison, the investment intelligence firm, is the future of investor interaction with corporates. Our team of over 100 analysts and investment professionals work with leading companies, fund managers and investment banks worldwide to support their capital markets activity. We provide services to more than 400 retained corporate and investor clients from our offices in London, New York, Frankfurt, Sydney and Wellington. Edison is authorised and regulated by the Financial Conduct Authority. Edison Investment Research (NZ) Limited (Edison NZ) is the New Zealand subsidiary of Edison. Edison NZ is registered on the New Zealand Financial Service Providers Register (FSP number 247505) and is registered to provide wholesale and/or generic financial adviser services only. Edison Investment Research Inc (Edison US) is the US subsidiary of Edison and is regulated by the Securities and Exchange Commission. Edison Investment Research Limited (Edison Aus) [46085869] is the Australian subsidiary of Edison and is not regulated by the Australian Securities and Investment Commission. Edison Germany is a branch entity of Edison Investment Research Limited [4794244]. www.edisongroup.com DISCLAIMER
Copyright 2016 Edison Investment Research Limited. All rights reserved. This report has been commissioned by Cohort and prepared and issued by Edison for publication globally. All information used in the publication of this report has been compiled from publicly available sources that are believed to be reliable, however we do not guarantee the accuracy or completeness of this report. Opinions contained in this report represent those of the research department of Edison at the time of publication. The securities described in the Investment Research may not be eligible for sale in all jurisdictions or to certain categories of investors. This research is issued in Australia by Edison Aus and any access to it, is intended only for "wholesale clients" within the meaning of the Australian Corporations Act. The Investment Research is distributed in the United States by Edison US to major US institutional investors only. Edison US is registered as an investment adviser with the Securities and Exchange Commission. Edison US relies upon the "publishers' exclusion" from the definition of investment adviser under Section 202(a)(11) of the Investment Advisers Act of 1940 and corresponding state securities laws. As such, Edison does not offer or provide personalised advice. We publish information about companies in which we believe our readers may be interested and this information reflects our sincere opinions. The information that we provide or that is derived from our website is not intended to be, and should not be construed in any manner whatsoever as, personalised advice. Also, our website and the information provided by us should not be construed by any subscriber or prospective subscriber as Edison’s solicitation to effect, or attempt to effect, any transaction in a security. The research in this document is intended for New Zealand resident professional financial advisers or brokers (for use in their roles as financial advisers or brokers) and habitual investors who are “wholesale clients” for the purpose of the Financial Advisers Act 2008 (FAA) (as described in sections 5(c) (1)(a), (b) and (c) of the FAA). This is not a solicitation or inducement to buy, sell, subscribe, or underwrite any securities mentioned or in the topic of this document. This document is provided for information purposes only and should not be construed as an offer or solicitation for investment in any securities mentioned or in the topic of this document. A marketing communication under FCA Rules, this document has not been prepared in accordance with the legal requirements designed to promote the independence of investment research and is not subject to any prohibition on dealing ahead of the dissemination of investment research. Edison has a restrictive policy relating to personal dealing. Edison Group does not conduct any investment business and, accordingly, does not itself hold any positions in the securities mentioned in this report. However, the respective directors, officers, employees and contractors of Edison may have a position in any or related securities mentioned in this report. Edison or its affiliates may perform services or solicit business from any of the companies mentioned in this report. The value of securities mentioned in this report can fall as well as rise and are subject to large and sudden swings. In addition it may be difficult or not possible to buy, sell or obtain accurate information about the value of securities mentioned in this report. Past performance is not necessarily a guide to future performance. Forward-looking information or statements in this report contain information that is based on assumptions, forecasts of future results, estimates of amounts not yet determinable, and therefore involve known and unknown risks, uncertainties and other factors which may cause the actual results, performance or achievements of their subject matter to be materially different from current expectations. For the purpose of the FAA, the content of this report is of a general nature, is intended as a source of general information only and is not intended to constitute a recommendation or opinion in relation to acquiring or disposing (including refraining from acquiring or disposing) of securities. The distribution of this document is not a “personalised service” and, to the extent that it contains any financial advice, is intended only as a “class service” provided by Edison within the meaning of the FAA (ie without taking into account the particular financial situation or goals of any person). As such, it should not be relied upon in making an investment decision. To the maximum extent permitted by law, Edison, its affiliates and contractors, and their respective directors, officers and employees will not be liable for any loss or damage arising as a result of reliance being placed on any of the information contained in this report and do not guarantee the returns on investments in the products discussed in this publication. FTSE International Limited (“FTSE”) © FTSE 2016. “FTSE®” is a trade mark of the London Stock Exchange Group companies and is used by FTSE International Limited under license. All rights in the FTSE indices and/or FTSE ratings vest in FTSE and/or its licensors. Neither FTSE nor its licensors accept any liability for any errors or omissions in the FTSE indices and/or FTSE ratings or underlying data. No further distribution of FTSE Data is permitted without FTSE’s express written consent. |
Frankfurt +49 (0)69 78 8076 960 Schumannstrasse 34b 60325 Frankfurt Germany |
London +44 (0)20 3077 5700 280 High Holborn London, WC1V 7EE United Kingdom |
New York +1 646 653 7026 245 Park Avenue, 39th Floor 10167, New York US |
Sydney +61 (0)2 9258 1161 Level 25, Aurora Place 88 Phillip St, Sydney NSW 2000, Australia |
Wellington +64 (0)48 948 555 Level 15, 171 Featherston St Wellington 6011 New Zealand |
Frankfurt +49 (0)69 78 8076 960 Schumannstrasse 34b 60325 Frankfurt Germany |
London +44 (0)20 3077 5700 280 High Holborn London, WC1V 7EE United Kingdom |
New York +1 646 653 7026 245 Park Avenue, 39th Floor 10167, New York US |
Sydney +61 (0)2 9258 1161 Level 25, Aurora Place 88 Phillip St, Sydney NSW 2000, Australia |
Wellington +64 (0)48 948 555 Level 15, 171 Featherston St Wellington 6011 New Zealand |
|
Edison, the investment intelligence firm, is the future of investor interaction with corporates. Our team of over 100 analysts and investment professionals work with leading companies, fund managers and investment banks worldwide to support their capital markets activity. We provide services to more than 400 retained corporate and investor clients from our offices in London, New York, Frankfurt, Sydney and Wellington. Edison is authorised and regulated by the Financial Conduct Authority. Edison Investment Research (NZ) Limited (Edison NZ) is the New Zealand subsidiary of Edison. Edison NZ is registered on the New Zealand Financial Service Providers Register (FSP number 247505) and is registered to provide wholesale and/or generic financial adviser services only. Edison Investment Research Inc (Edison US) is the US subsidiary of Edison and is regulated by the Securities and Exchange Commission. Edison Investment Research Limited (Edison Aus) [46085869] is the Australian subsidiary of Edison and is not regulated by the Australian Securities and Investment Commission. Edison Germany is a branch entity of Edison Investment Research Limited [4794244]. www.edisongroup.com DISCLAIMER
Copyright 2016 Edison Investment Research Limited. All rights reserved. This report has been commissioned by Cohort and prepared and issued by Edison for publication globally. All information used in the publication of this report has been compiled from publicly available sources that are believed to be reliable, however we do not guarantee the accuracy or completeness of this report. Opinions contained in this report represent those of the research department of Edison at the time of publication. The securities described in the Investment Research may not be eligible for sale in all jurisdictions or to certain categories of investors. This research is issued in Australia by Edison Aus and any access to it, is intended only for "wholesale clients" within the meaning of the Australian Corporations Act. The Investment Research is distributed in the United States by Edison US to major US institutional investors only. Edison US is registered as an investment adviser with the Securities and Exchange Commission. Edison US relies upon the "publishers' exclusion" from the definition of investment adviser under Section 202(a)(11) of the Investment Advisers Act of 1940 and corresponding state securities laws. As such, Edison does not offer or provide personalised advice. We publish information about companies in which we believe our readers may be interested and this information reflects our sincere opinions. The information that we provide or that is derived from our website is not intended to be, and should not be construed in any manner whatsoever as, personalised advice. Also, our website and the information provided by us should not be construed by any subscriber or prospective subscriber as Edison’s solicitation to effect, or attempt to effect, any transaction in a security. The research in this document is intended for New Zealand resident professional financial advisers or brokers (for use in their roles as financial advisers or brokers) and habitual investors who are “wholesale clients” for the purpose of the Financial Advisers Act 2008 (FAA) (as described in sections 5(c) (1)(a), (b) and (c) of the FAA). This is not a solicitation or inducement to buy, sell, subscribe, or underwrite any securities mentioned or in the topic of this document. This document is provided for information purposes only and should not be construed as an offer or solicitation for investment in any securities mentioned or in the topic of this document. A marketing communication under FCA Rules, this document has not been prepared in accordance with the legal requirements designed to promote the independence of investment research and is not subject to any prohibition on dealing ahead of the dissemination of investment research. Edison has a restrictive policy relating to personal dealing. Edison Group does not conduct any investment business and, accordingly, does not itself hold any positions in the securities mentioned in this report. However, the respective directors, officers, employees and contractors of Edison may have a position in any or related securities mentioned in this report. Edison or its affiliates may perform services or solicit business from any of the companies mentioned in this report. The value of securities mentioned in this report can fall as well as rise and are subject to large and sudden swings. In addition it may be difficult or not possible to buy, sell or obtain accurate information about the value of securities mentioned in this report. Past performance is not necessarily a guide to future performance. Forward-looking information or statements in this report contain information that is based on assumptions, forecasts of future results, estimates of amounts not yet determinable, and therefore involve known and unknown risks, uncertainties and other factors which may cause the actual results, performance or achievements of their subject matter to be materially different from current expectations. For the purpose of the FAA, the content of this report is of a general nature, is intended as a source of general information only and is not intended to constitute a recommendation or opinion in relation to acquiring or disposing (including refraining from acquiring or disposing) of securities. The distribution of this document is not a “personalised service” and, to the extent that it contains any financial advice, is intended only as a “class service” provided by Edison within the meaning of the FAA (ie without taking into account the particular financial situation or goals of any person). As such, it should not be relied upon in making an investment decision. To the maximum extent permitted by law, Edison, its affiliates and contractors, and their respective directors, officers and employees will not be liable for any loss or damage arising as a result of reliance being placed on any of the information contained in this report and do not guarantee the returns on investments in the products discussed in this publication. FTSE International Limited (“FTSE”) © FTSE 2016. “FTSE®” is a trade mark of the London Stock Exchange Group companies and is used by FTSE International Limited under license. All rights in the FTSE indices and/or FTSE ratings vest in FTSE and/or its licensors. Neither FTSE nor its licensors accept any liability for any errors or omissions in the FTSE indices and/or FTSE ratings or underlying data. No further distribution of FTSE Data is permitted without FTSE’s express written consent. |
Frankfurt +49 (0)69 78 8076 960 Schumannstrasse 34b 60325 Frankfurt Germany |
London +44 (0)20 3077 5700 280 High Holborn London, WC1V 7EE United Kingdom |
New York +1 646 653 7026 245 Park Avenue, 39th Floor 10167, New York US |
Sydney +61 (0)2 9258 1161 Level 25, Aurora Place 88 Phillip St, Sydney NSW 2000, Australia |
Wellington +64 (0)48 948 555 Level 15, 171 Featherston St Wellington 6011 New Zealand |
Frankfurt +49 (0)69 78 8076 960 Schumannstrasse 34b 60325 Frankfurt Germany |
London +44 (0)20 3077 5700 280 High Holborn London, WC1V 7EE United Kingdom |
New York +1 646 653 7026 245 Park Avenue, 39th Floor 10167, New York US |
Sydney +61 (0)2 9258 1161 Level 25, Aurora Place 88 Phillip St, Sydney NSW 2000, Australia |
Wellington +64 (0)48 948 555 Level 15, 171 Featherston St Wellington 6011 New Zealand |
|