Celyad
Written by
Celyad |
New focus with new data awaited |
Strategic plan update |
Pharma & biotech |
28 January 2016 |
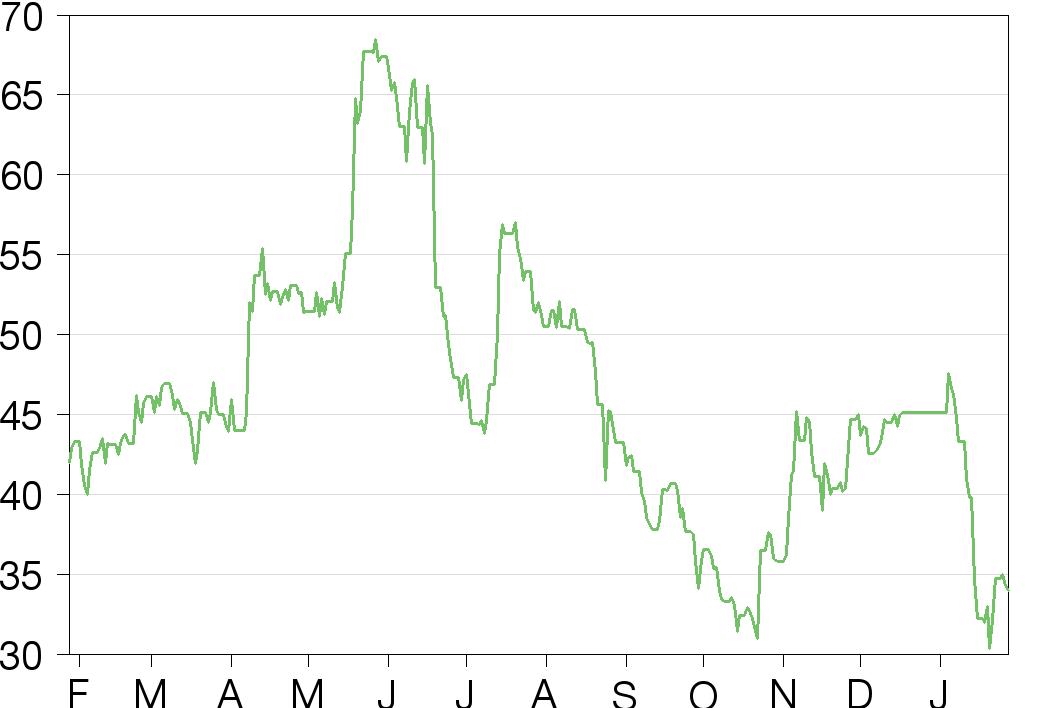
Share price performance
Business description
Next events
Analysts
Celyad is a research client of Edison Investment Research Limited |
|||||||||||||||||||||||||||||||||||||||||||||||||||
Management has indicated that the C-Cure cardiac regeneration project (Phase III data in mid-2016) might be fully partnered from 2017. This will enable the main focus to move onto Chimeric Antigen Receptor (CAR) T-cell cancer therapies and the associated allogeneic development. The new indicative value of €88/$95 per share is an interim assessment while Phase III CHART-1 C-Cure data, due mid-2016, is awaited and before the Phase I CAR T-cell study completes. C-Cure partnering is not expected till 2017. Edison estimates that 2015 year-end cash was about €107m.
Year end |
Revenue |
PBT* |
EPS* |
DPS |
P/E |
Yield |
12/13 |
0.0 |
(12.56) |
(3.06) |
0.0 |
N/A |
N/A |
12/14 |
0.1 |
(18.46) |
(2.74) |
0.0 |
N/A |
N/A |
12/15e |
0.0 |
(30.05) |
(3.46) |
0.0 |
N/A |
N/A |
12/16e |
0.0 |
(37.69) |
(4.05) |
0.0 |
N/A |
N/A |
Note: *PBT and EPS are normalised, excluding intangible amortisation, exceptional items and share-based payments. EPS altered by the share increase from 7.8m to 9.3m in 2015.
CAR progress – second cohort under way
This area is becoming the major strategic focus for Celyad. The US Phase I study is now testing the second dose of three million-cells. There have been no safely issues reported. The trial recruits both acute myeloid leukaemia (AML) and multiple myeloma (MM) patients. Up to 30 million cells might be administered in Cohort 4. A solid tumour indication might be added if an efficacy signal is seen. An allogeneic technology to avoid graft vs host disease is in preclinical development.
FDA allows use of Celyad’s catheter in CHART-2
The FDA has approved the use in CHART-2 of Celyad’s proprietary C-Cathez catheter to inject the C-Cure autologous cardiac regeneration therapy. The part-US Phase III CHART-2 240 patient study is now recruiting. CHART-2 is based on a simple six-minute walk endpoint with results possible from H119. Management is considering a fully partnered deal in 2017 rather than direct EU sales with a US partner as previously envisaged.
Complex endpoint in CHART-1 published
The Phase III (CHART-1) outcome, should be reported by mid-2016 potentially allowing an EMA regulatory filing. A recent paper (Bartunek et al, 2015) discussed the complex CHART-1 endpoint and expected outcomes (see page 3).
Valuation: Rebased indicative value of €846m/$914m
The core value remains C-Cure at 45% probability of success for CHART-1, with CHART-2 raised to 40% probability (formerly 30%) after the FDA decision. The probability for CAR in AML and MM has been increased slightly from 15% to 17.5%. The indicative valuation now assumes that C-Cure is partnered after Phase III in Europe with some upfront fees; C-Cure was always assumed to be partnered for US marketing. This adjusts the value estimate to €846m/$914m (€88/$95share) rather than €953m as estimated previously assuming direct EU marketing.
Doubled cell strategy: Cardiac and CAR
Celyad has two core competences: autologous cell therapy development (in cancer and cardiac indications) and cardiac medical devices. Projects are shown in Exhibit 1.
Exhibit 1: Celyad clinical and near-clinical pipeline
Product |
Application (status) |
Notes |
Therapeutic projects |
||
Chimeric antigen receptor T-cell NKG2D (CAR-NKG2D) |
Acute myeloid leukaemia and multiple myeloma (Phase I) |
CAR therapies use gene constructs to modify autologous T-cells. The Natural Killer Group 2D (NKG2D) ligand targeted by Celyad is found on haematological cancers and ovarian cancer, among others. It might be combined with chemotherapy. The first dose cohort (one million cells) has been completed. Cohort 2, now under way, will receive three million cells, Cohort 3 10 million cells and Cohort 4 30 million cells, assuming no limiting side effects are noted. |
Up to eight solid tumour types including potentially ovarian cancer |
Celyad plans to start one solid tumour type per quarter if an efficacy signal is seen in the current Phase I study. No timing predictions are yet possible as the approach is experimental. |
|
C-Cure |
Chronic heart failure; two Phase IIIs: congestive heart failure cardiopoietic regenerative therapy (CHART) CHART-1 enrolled, data mid-2016 CHART-2 expected data from late 2018 |
CHART-1 has a composite endpoint now discussed in Bartunek et al, 2015). The trial is fully recruited and will produce data by mid-2016. CHART-2 part-US 240 patient Phase III now cleared to initiate. First patients should enrol by Q116 with dosing from spring 2016. Read out could be from late 2018. Celyad will sell direct in Europe with a possible US marketing partner. Chinese and Asian rights sold to a JV with Medisun. In August 2015, a new agreement was reached that Celyad will run the Chinese and Asian trials, with €20m funding from Medisun. Celyad will receive high royalties and a profit share. |
Allogeneic |
Preclinical |
Uses TCR Inhibitory Molecules (TIMs) to stop functional T-cell receptors being formed. This allows allogeneic therapy assuming some tissue type matching, with no risk of graft vs host disease. |
Device projects |
||
C-Cathez |
Specialist catheter for intraventricular injection of cells (CE-marked) |
C-Cathez use increases cell retention rates by 260%. It was CE marked in 2012 and is used in CHART-1. The FDA has allowed use of the catheter based on CHART-1 safety data. |
CorQuest |
Direct atrial access for mitral valve repair through chest wall (acquired late 2014) |
This device gives direct surgical access to the atrium allowing easier work on the mitral valve (between the heart left atrium and ventricle). CE marking after EU trials in 2016, FDA approval route undisclosed. |
Source: Edison Investment Research
C-Cure status
C-Cure has been extensively reviewed (2014 Outlook note); trials are summarised in Exhibit 2.
Exhibit 2: CHART map
Parameter |
CHART-1 |
CHART-2 |
|
Centres |
European, with up to 30 active sites. |
European plus US. |
|
Dose |
600m standard cell dose. Cells shipped frozen, thawed and processed in operating theatre with Biosafe Sepax device for maximum viability and consistency. |
||
Administration |
Uses C-Cathez catheter with 36% cell retention vs 10% for straight-needle alternatives. FDA approval granted for use in CHART-2. |
||
Design |
240-patient, randomised and placebo control. |
||
Entry criteria |
NYHA class III or IV; LVEF≤30%. Note that patients can be Class IIb on entry if they have previously been Class III or IV. This group has a high risk of progression. |
||
Power |
87% powered at two-sided 5% level. |
Presumed 90% but not stated. |
|
Start |
Trials started April 2013, last patient enrolled March 2015, dosed on 31 July 2015. |
Dosing possible from spring 2016 after screening and recruitment then cell harvesting and culture process. |
|
End |
Endpoint reached in April 2016, data by mid-2016. |
Late 2018 or H119 possible. |
|
Primary endpoints |
Hierarchical primary endpoint at 39 weeks. Mortality, worsening heart failure, LVEF, 6MW, ESV, QoL. |
Six-minute walk test showing an improvement of 40 metres or more after nine months. |
|
Source: Edison Investment Research based on Celyad announcements
CHART-1 endpoints
An interesting paper on the CHART-1 design has been published. The study uses a Finkelstein–Schoenfeld hierarchical composite endpoint. This is a scoring system where the result of each patient is compared to every other patient (treated and control) according to fixed criteria. If the patient has a better performance in the first comparison, they score one point, if equal they score zero and if worse, minus one.1 Once each patient has a score, the patient data is separated into treated and placebo groups. The distributions are then tested for statistical significance using the Wilcoxon test. This process appears complex but allows multiple endpoints to be included in a small, powerful study. The endpoints are, in order of testing, listed in Exhibit 3.
For example, to score a mortality endpoint, a patient scores one if they survive but the comparison patient dies. If they both survive they are equal, so score zero. If the patient died and the comparison survived, the patient scores minus one. If the outcome is zero, the second endpoint is tested. If this shows no difference, zero is scored again and the third endpoint is used and so on. This allows hard endpoints like mortality where few events are expected to be included (so most comparisons will score zero) with endpoints that are expected to have a more variable outcome like quality-of-life scores and the six-minute walk test.
Exhibit 3: CHART-1 hierarchical Phase III endpoints in order and comparison to Phase II data
Parameter/ change |
Cut off to score |
Expected outcome (treated vs placebo) |
Phase II |
Comments |
Mortality |
39-week survival post treatment |
7.5% vs 10%. |
No treated patients died of cardiac events but two control patients died between six months and two years. |
Death provides a clear endpoint with an overall 8.75% death rate so 21 deaths expected: nine in the treated vs 12 placebo. Because of the small difference (three people) the figures could be very variable and are unlikely to be statistically significant. |
Worsening Heart Failure (WHF) events |
0, 1 or 2 or more events scored |
Events expected: None – 83.5% vs 78% One – 11% vs 16% Two plus – 5.5% vs 6% |
Not specifically assessed in this way at Phase II but the New York Heart Association classification of patients did not change. |
Patients need to be in NYHA Class II or higher to enter CHART-1. Although 46 events are expected (20 treated, 26 placebo) most patients (194/240) are not expected to show any worsening so will score zero and progress to the next test. The number of two or more event patients is effectively equal as six/seven expected but small number effects could influence the data. |
Minnesota Living with Heart Failure Questionnaire 2(MLHFQ) MLHTQ has 21 items ranging from physical symptoms to daily activities with high score (up to five points per question) indicating a poor condition and a zero showing no effect. The maximum score is 105 for a severely ill, badly affected patient. A difference of five or less is not considered clinically meaningful. |
A 10 or more point decrease (improvement in condition) scores one |
Total score of -14 vs -5 points expected with a common standard deviation of 20 points. |
Treated patients had a seven-point reduction (improvement) as against a one-point control group increase (deterioration). Not statistically significant. |
A reduction in score indicates an improvement in the patient’s condition. Scoring systems can be subjective and variable but MLHFQ has been widely tested. Note the high standard deviation which is much higher than the excepted average difference of nine. To enter CHART-1, patients needed a score of 30 or more. |
Six-minute walk test (6MWT) distance 3 The test is done with a 100m long oval track in level corridor. It is regarded as a robust clinical endpoint by the FDA. Patients are reminded of the time during the walk and stop, start and sit down as they wish. |
A difference of 40m or more scores one |
The expected improvement is of 45m vs 10m with a standard Deviation of 120m. |
Treated patients walked an average of 62m further vs 15m less for controls. The difference was significant at 77m (p<0.01). |
To enter CHART-1, patients needed to walk between 100 and 400m before treatment. However, this is highly variable as seen by the high standard deviation, which is three times the scoring level. Average distances can flatter from one or two good performances so median distance is a more relevant measure. |
Left Ventricular Ejection systolic volume (LVESV4) Systolic volume is the volume of blood left in the ventricle (heart chamber) once the heart has contracted so a decrease shows improved pumping efficiency and possibly heart muscle remodelling; the heart can become distended in heart failure. In a health person, this is about 60mL but can be three times this in heart failure. |
15mL decrease scores one |
−10mL vs 5mL with a standard deviation of 20mL. |
The decrease was 24.8mL in treated patients vs 8.8mL in controls and statistically significant (p<0.001). |
The expected average difference is 15mL. Note that the standard deviation on this parameter is expected to be high. This is partly as the measurement using diagnostic imaging has inherent variability in addition to patient responses. |
Left Ventricle Ejection Fraction (LVEF)5 LEVF is the percentage of blood expelled by the left ventricle on contraction. Normal values are 50–70%. |
4% absolute improvement |
6% vs 1% with a standard deviation of 5%. |
Median values showed a 7% increase in absolute ejection fraction (from 28% to 35%). The difference was statistically significant (p<0.0001). |
Patients with under 40% EF are in heart failure. To enter the study, patients had to have an LEVF of 35% or less, so are very ill. |
Source: Celyad, Edison Investment Research, Bartunek et al, 2015, Bartunek et al, 2013
The authors of Bartunek et al, 2015 note that the MLHFQ and 6MW tests “may be influenced by knowledge of the treatment variable”. These two endpoints are likely to generate a bigger number of scores compared to the first two parameters, which may be fairly neutral. The CHART-1 design does appear to be very systematic and realistic. The C-Cure Phase II study (Bartunek et al, 2013) was randomised but not blinded, which could have affected some of the more subjective results. Consequently, while the Phase II data is very supportive, it is not a strong guide to the potential CHART-1 data.
CAR T-cell clinical trial
Celyad’s CAR cancer therapy product line was acquired in January 2015 and uses NKG2D CAR-T technology from the group of Professor Charles Sentman at Dartmouth College, US.
A product, CAR-T NKG2D, is in a 21-patient Phase I US clinical study NCT02203825. The first cohort of three patients has completed their three-month safety follow ups after an infusion of one million cells. The second dose cohort (three million cells) started dosing in December 2015. No safety issue have been reported to date for the probability has been increased slightly from 15% to 17.5%. There are a further two possible dose levels planned: Cohort 3 10 million cells and Cohort 4 30 million cells assuming no limiting side effects are noted. Patients can have either AML, myelodysplastic syndrome (the AML precursor) or MM.
Sensitivities
Celyad has diversified its risk with major cardiac and cancer programmes based on its autologous cell competences. Both Phase III CHART studies are fully funded. Valuations are sensitive to the $/€ rate as the US is the most valuable market.
CHART-1 data in mid-2016 remain the major sensitivity. C-Cure has the potential to be the first cardiac regenerative cell therapy from 2017 and could create a major new market with direct EU sales. The clinical benefit will need to justify a high price for C-Cure as autologous therapies are expensive to manufacture. Hence, commercial success is not necessarily automatic. The C-Cure Phase II offers support, but was not an exact parallel to CHART-1.
The CAR programme opens a major long-term opportunity. The initial indications of AML and MM have clear market opportunities. The CAR sector may become the major value driver for the business. Adding allogeneic versions of CAR products through TCR inhibitory molecule (TIM) technology should cut costs, make them easier to use and extend biological exclusivity. Celyad could also license TIM technology to gain value and perhaps to access other technologies itself.
A new sensitivity has become C-Cure partnering. Celyad has the option of either partnering in Europe or selling direct; US partnering was already assumed. If Europe is partnered, as we now assume based on management discussion, the deal could be very favourable and significant marketing and administration investments might be avoided. However, this sales and distribution infrastructure would then not be available to support any CAR T-cell therapy direct sales - if that is envisaged; it is too early to know.
C-Cure is a niche market (late stage chronic ischaemic heart failure) albeit a potentially very lucrative one, relative to the potential that an allogeneic NKG2D CAR T-cell approach could have across, possibly, multiple cancers. It is too early to know but CAR, as a bigger opportunity should command more cash and resource investment. Further, if reasonable upfront deal fees can be obtained for C-Cure in 2017 without compromising royalty or profit share rates, this could provide immediate cash to invest in CAR.
Valuation
The indicative value based on risk-adjusted sales to 2030 and discounted to January 2016 is based on 9.31m shares. US sales of C-Cure are assumed to start in 2020 after regulatory review in 2019. The probability has been increased from 30% to 40% due to the FDA decision on CHART-2. This is slightly lower than CHART-1 (45%) as the FDA specifies a single endpoint. CAR therapy has been tweaked to a 17.5% Phase I probability on the basis of trial progression and safety to date.
The Edison modelled previously a US partnering deal whereby Celayd manufactured C-Cure and split the revenues 50:50. No upfront fees were projected. Sales in Europe were modelled as being direct but incurred marketing and administration overheads.
As a C-Cure European partnering deal is now possible after CHARTT-1 results, and upfront fees are now assumed based on management expectations, the assumption now in the USA and European markets is for a 2017 partnering deal, either global or regional. Assuming upfront fees of $50m and €25m for the US and EU respectively in 2017 with $100m and €50m milestones on regulatory approval, manufacturing by Celyad (with 2% royalties to the Mayo clinic) and a 40% revenue share (as these are Phase III /regulatory stage deals), the indicative value is €846m/$914m or €88/$95 per share. The envisaged revenue share is lower due to upfront fees. The previous assumptions indicated a value of €953m based on direct EU marketing. Additional cash flows from the CAR projects have been added in based on AML and MM alone.
Exhibit 4: Summary Celyad indicative value as of January 2016
Item |
Value |
Indicative value of Celyad based on C-Cure cash flows |
€668m |
Additional CAR value |
€178m |
Total indicative value |
€846m/$914m |
Shares |
9.31m |
Warrants and options |
0.30m |
Diluted value per share |
€88/$95 |
Item |
Indicative value of Celyad based on C-Cure cash flows |
Additional CAR value |
Total indicative value |
Shares |
Warrants and options |
Diluted value per share |
Value |
€668m |
€178m |
€846m/$914m |
9.31m |
0.30m |
€88/$95 |
Source: Edison Investment Research. Note: Cash flows discounted at 12.5%. Rate = $1.1/€.
Adding in up to six solid tumours may generate a further €578/$636m of additional value (2016 rebased). As the solid cancer indications are still uncertain, they are not included in the valuation estimate. Allogeneic versions of these products (not specifically valued as too early in development) could have longer biological protection and should greatly expand sales. There may be possible licensing fees from the granted TIM patent (not forecast).
Note that given the expected news flow in 2016 and that CAR T-cell therapy indications are not fully modelled, being Phase I stage only, this valuation is subject to revision as clinical data emerges and as the strategic situation changes. The CAR therapy area in general is evolving rapidly.
Financials
Celyad’s cash use in Q415 and 2016 depends on the range of clinical trials undertaken and will also be affected by short-term data, for example CAR therapies and solid tumours. Cash at 30 September was €115m after €109m in cash from financing activities in H115. Year-end 2015 cash is expected to be around €107m, depending on clinical trial investments and working capital. Cash burn in 2016 will depend on the outcome of the CHART-1 study (for example, if pre-marketing and C-Cure production investments need to be made) and on the extent and pace of any solid cancer CAR therapy trials. Our unchanged financial forecasts following the interims are shown in Exhibit 5.
Exhibit 5: Financial summary
€000s |
2013 |
2014 |
2015e |
2016e |
Year end 31 December |
IFRS |
IFRS |
IFRS |
IFRS |
PROFIT & LOSS |
||||
Revenue |
0 |
146 |
0 |
0 |
Cost of Sales |
0 |
(115) |
0 |
(6,000) |
Gross Profit |
0 |
31 |
0 |
(6,000) |
EBITDA |
(10,816) |
(18,254) |
(30,596) |
(38,330) |
Operating Profit (before amort and except) |
(11,026) |
(18,447) |
(30,620) |
(38,330) |
Intangible Amortisation |
(670) |
(670) |
(670) |
(670) |
Other income and charges |
0 |
3,778 |
0 |
0 |
Share-based payments |
(1,258) |
(1,098) |
(1,000) |
(1,000) |
Operating Profit |
(12,954) |
(16,437) |
(32,290) |
(40,000) |
Net Interest |
(1,535) |
(16) |
571 |
645 |
Profit Before Tax (norm) |
(12,561) |
(18,463) |
(30,049) |
(37,685) |
Profit Before Tax (FRS 3) |
(14,489) |
(16,453) |
(31,719) |
(39,355) |
Tax |
0 |
0 |
0 |
0 |
Profit After Tax (norm) |
(12,561) |
(18,463) |
(30,049) |
(37,685) |
Profit After Tax (FRS 3) |
(14,489) |
(16,453) |
(31,719) |
(39,355) |
Average Number of Shares Outstanding (m) |
4.1 |
6.8 |
8.7 |
9.3 |
EPS - normalised (€) |
(3.06) |
(2.74) |
(3.46) |
(4.05) |
EPS - (IFRS) (€) |
(3.53) |
(2.44) |
(3.65) |
(4.23) |
Dividend per share (c) |
0.0 |
0.0 |
0.0 |
0.0 |
Gross Margin (%) |
N/A |
N/A |
N/A |
N/A |
EBITDA Margin (%) |
N/A |
N/A |
N/A |
N/A |
Operating Margin (before GW and except) (%) |
N/A |
N/A |
N/A |
N/A |
BALANCE SHEET |
||||
Fixed Assets |
9,783 |
11,041 |
57,634 |
57,114 |
Intangible Assets |
9,400 |
10,266 |
56,823 |
56,153 |
Tangible Assets |
243 |
598 |
683 |
833 |
Investments |
140 |
177 |
128 |
128 |
Current Assets |
22,602 |
32,935 |
108,923 |
70,168 |
Stocks |
0 |
0 |
0 |
0 |
Debtors |
421 |
1,839 |
733 |
733 |
Cash |
22,058 |
30,304 |
107,049 |
68,294 |
Other |
123 |
792 |
1,141 |
1,141 |
Current Liabilities |
(3,390) |
(6,053) |
(8,604) |
(8,827) |
Creditors |
(2,961) |
(5,276) |
(7,827) |
(7,827) |
Deferred revenue |
0 |
0 |
0 |
0 |
Walloon loans for cash payment |
(428) |
(777) |
(777) |
(1,000) |
Long Term Liabilities |
(12,099) |
(11,239) |
(49,568) |
(47,409) |
Walloon loans (non-current) |
(12,072) |
(10,778) |
(11,439) |
(9,280) |
Other long term liabilities |
(27) |
(461) |
(38,129) |
(38,129) |
Net Assets |
16,897 |
26,684 |
108,385 |
71,046 |
CASH FLOW |
||||
Operating Cash Flow |
(10,638) |
(17,398) |
(26,942) |
(38,127) |
Net Interest |
(1,535) |
(16) |
571 |
645 |
Tax |
0 |
0 |
0 |
0 |
Capex |
(531) |
(640) |
(400) |
(150) |
Acquisitions/disposals |
0 |
(1,550) |
(5,186) |
0 |
Financing |
30,873 |
26,417 |
105,645 |
0 |
Dividends |
0 |
0 |
0 |
0 |
Other |
1,585 |
2,379 |
2,396 |
813 |
Net Cash Flow |
19,754 |
9,192 |
76,085 |
(36,819) |
Opening net debt/(cash) |
10,197 |
(9,557) |
(18,749) |
(94,833) |
HP finance leases initiated |
0 |
0 |
0 |
0 |
Walloon loan recognition (non-cash) |
0 |
0 |
0 |
0 |
Closing net debt/(cash) |
(9,557) |
(18,749) |
(94,833) |
(58,014) |
Source: Edison Investment Research estimates, Celyad reports and announcements
|
|||||||||||||||
|
|||||||||||||||