Last close As at 05/08/2026
—
— 0.00 (0.00%)
Market capitalisation
—
Research: Investment Companies
Fidelity Special Values (FSV), launched in November 1994, is celebrating its 25-year anniversary. Manager Alex Wright has a contrarian investment style, aiming to generate long-term capital growth from a diversified portfolio of primarily UK equities (up to 20% of the fund may be held in companies listed overseas). The manager seeks undervalued companies with the potential for positive change. He says the UK market is relatively attractively valued versus global stocks and, in an environment of softening company fundamentals, he is finding opportunities in more defensive businesses. FSV has a strong investment performance track record; its NAV total returns are ahead of the FTSE All-Share index over the last three, five and 10 years. Although the last 12 months have proved more challenging, Wright has confidence in the trust’s future prospects.
Fidelity Special Values |
Celebrating 25-year anniversary |
Investment trusts |
28 November 2019 |
Share price/discount performance
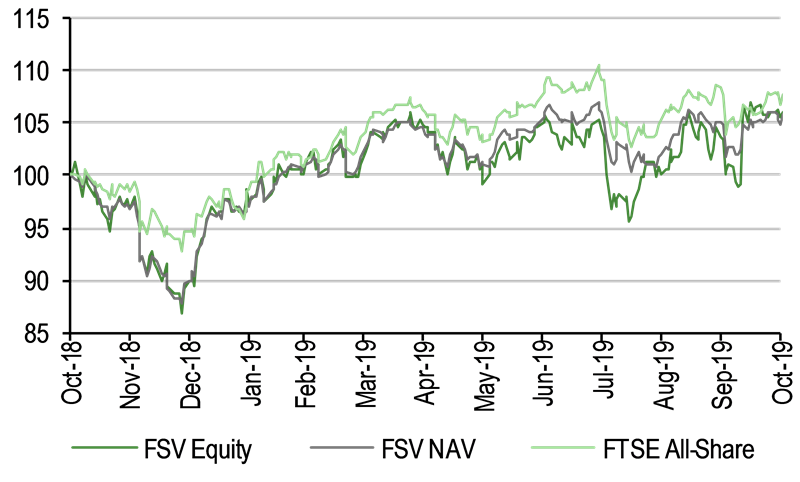
Three-year performance vs index
Gearing
Analysts
|
|||||||||||||||||||||||||||||||||||||||||||||||||||||||||||||||||||||||||||||||||
Fidelity Special Values (FSV), launched in November 1994, is celebrating its 25-year anniversary. Manager Alex Wright has a contrarian investment style, aiming to generate long-term capital growth from a diversified portfolio of primarily UK equities (up to 20% of the fund may be held in companies listed overseas). The manager seeks undervalued companies with the potential for positive change. He says the UK market is relatively attractively valued versus global stocks and, in an environment of softening company fundamentals, he is finding opportunities in more defensive businesses. FSV has a strong investment performance track record; its NAV total returns are ahead of the FTSE All-Share index over the last three, five and 10 years. Although the last 12 months have proved more challenging, Wright has confidence in the trust’s future prospects.
|
FSV’s 25th anniversary |
|
|
Source: Fidelity |
The market opportunity
UK shares are relatively attractively valued compared with the global market. Political uncertainty since the June 2016 EU referendum has deterred both domestic and international investors; however, there is potential for improved sentiment towards the UK market once there is increased clarity in the political backdrop – the upcoming general election could be an important first step.
Why consider investing in Fidelity Special Values?
■
Consistently applied, contrarian investment process.
■
Manager is able to draw on the broad resources of Fidelity’s analyst team.
■
Annual NAV and share price total returns above 10% over the last 10 years.
■
Mid- and long-term outperformance versus the benchmark.
■
Lower ongoing charges, helped by reduced investment management fee.
Regularly trading at a premium
FSV’s current 2.3% premium to cum-income NAV compares with an average premium of 1.0% over the last 12 months and average discounts of 1.6%, 3.3% and 6.2% over the last three, five and 10 years. The board actively issues shares in order to manage the premium. FSV’s regular annual dividend has increased in each of the last 10 consecutive years; it currently offers a 2.1% yield.
Exhibit 1: Trust at a glance
Investment objective and fund background |
Recent developments |
||||||||||||||||||||||||||||||||||||||||||||||||||||||||||||||||||||||||||||||||||||||||||||||||
Fidelity Special Values’ investment objective is to achieve long-term capital growth, primarily through investment in the equities (and their related financial instruments) of UK companies that the manager believes to be undervalued or where potential has not been recognised by the market. Investments are only made in companies where the potential downside risk is understood, to limit the possibility of losses. |
■ 1 November 2019: 12-month results to 31 August 2019. NAV TR -4.9% versus benchmark TR +0.4%. Share price TR -6.9%. Proposed final dividend of 3.65p (+15.9% year-on-year) and special dividend of 1.50p. ■ 24 June 2019: appointment of two independent non-executive directors – Claire Boyle (with immediate effect) and Alison McGregor (effective 1 January 2020). |
||||||||||||||||||||||||||||||||||||||||||||||||||||||||||||||||||||||||||||||||||||||||||||||||
Forthcoming |
Capital structure |
Fund details |
|||||||||||||||||||||||||||||||||||||||||||||||||||||||||||||||||||||||||||||||||||||||||||||||
AGM |
12 December 2019 |
Ongoing charges |
0.92% |
Group |
FIL Investments International |
||||||||||||||||||||||||||||||||||||||||||||||||||||||||||||||||||||||||||||||||||||||||||||
Interim results |
May 2020 |
Net market gearing |
0.0% |
Manager |
Alex Wright |
||||||||||||||||||||||||||||||||||||||||||||||||||||||||||||||||||||||||||||||||||||||||||||
Year end |
31 August |
Annual mgmt fee |
Tiered: 0.85% up to £700m net assets, 0.75% thereafter |
Address |
Beech Gate, Millfield Lane, |
||||||||||||||||||||||||||||||||||||||||||||||||||||||||||||||||||||||||||||||||||||||||||||
Dividend paid |
June, January |
Performance fee |
None |
||||||||||||||||||||||||||||||||||||||||||||||||||||||||||||||||||||||||||||||||||||||||||||||
Launch date |
17 November 1994 |
Trust life |
Indefinite (subject to vote) |
Phone |
01732 361144 |
||||||||||||||||||||||||||||||||||||||||||||||||||||||||||||||||||||||||||||||||||||||||||||
Continuation vote |
Three-yearly (next 2019) |
Loan facilities |
None – CFDs used (see page 3) |
Website |
|||||||||||||||||||||||||||||||||||||||||||||||||||||||||||||||||||||||||||||||||||||||||||||
Dividend policy and history (financial years) |
Share buyback policy and history (financial years) |
||||||||||||||||||||||||||||||||||||||||||||||||||||||||||||||||||||||||||||||||||||||||||||||||
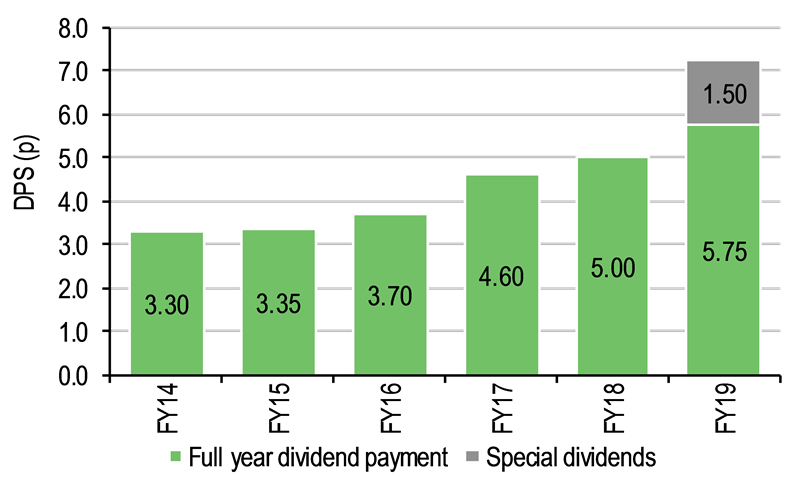
Since 2015, FSV has paid interim and final dividends, in order to smooth the dividend payment for the year. |
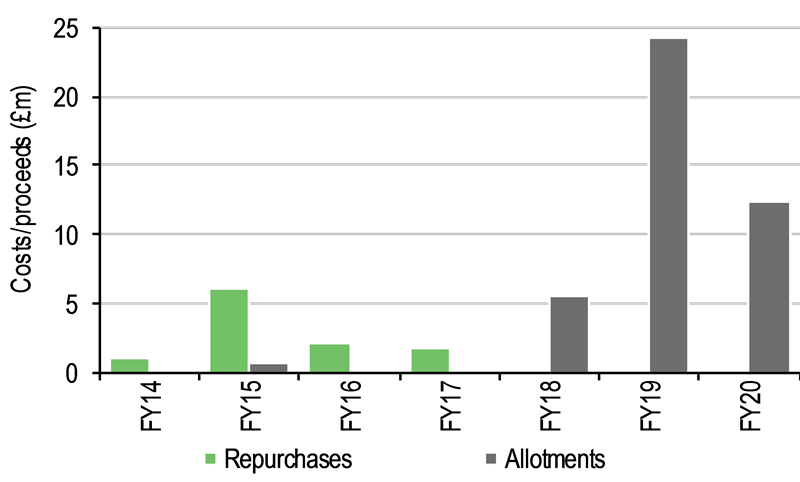
FSV has annually renewed authority to purchase up to 14.99% and allot up to 10% of its issued share capital. |
||||||||||||||||||||||||||||||||||||||||||||||||||||||||||||||||||||||||||||||||||||||||||||||||
|
|
||||||||||||||||||||||||||||||||||||||||||||||||||||||||||||||||||||||||||||||||||||||||||||||||
Shareholder base (as at 31 October 2019) |
Portfolio exposure by sector (as at 31 October 2019) |
||||||||||||||||||||||||||||||||||||||||||||||||||||||||||||||||||||||||||||||||||||||||||||||||
|
|
||||||||||||||||||||||||||||||||||||||||||||||||||||||||||||||||||||||||||||||||||||||||||||||||
Top 10 holdings (as at 31 October 2019) |
|||||||||||||||||||||||||||||||||||||||||||||||||||||||||||||||||||||||||||||||||||||||||||||||||
|
|||||||||||||||||||||||||||||||||||||||||||||||||||||||||||||||||||||||||||||||||||||||||||||||||
Source: FSV, Edison Investment Research, Bloomberg, Morningstar. Note: *N/A where not in end-October 2018 top 10. **Moved to the London Stock Exchange in October 2019, not in the index until the next quarterly review.
Market outlook: Potential for a re-rating
UK equities are out of favour with both international and domestic investors. While global growth is slowing, political uncertainty in the UK is also having a negative effect on spending and sentiment at both the corporate and consumer levels. In terms of valuation, the Datastream UK index is trading on a forward P/E multiple of 12.8x, which is a 17.3% discount to the world market, significantly wider than the 6.3% average discount over the last five years. With UK shares trading at such attractive relative valuations, any clarity on the domestic political situation could lead to a re-rating of the UK market. This may happen sooner rather than later given the upcoming UK general election on 12 December.
|
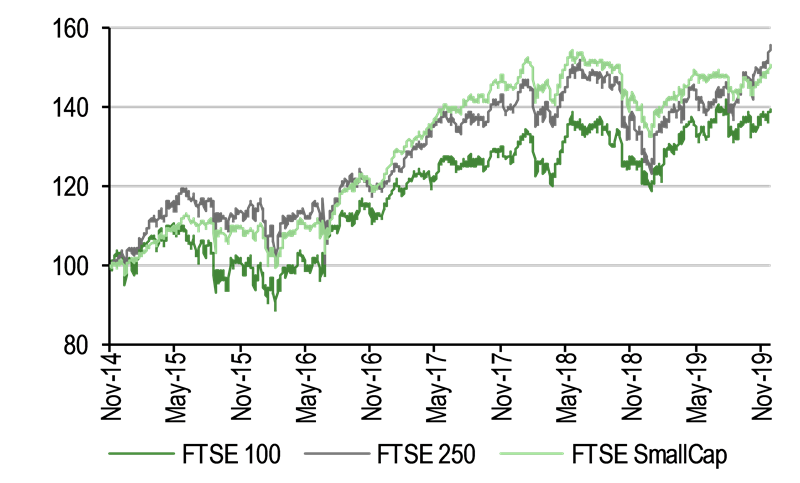
Exhibit 2: Market performance and valuation |
|
Performance of UK indices (rebased to 100) |
Datastream UK market forward P/E multiple vs Datastream World market |
|
|
|
Source: Refinitiv, Edison Investment Research. Note: Valuation data as at 27 November 2019. |
|
Fund profile: Actively managed with contrarian style
FSV was launched in November 1994 and has been managed by Alex Wright since September 2012. He aims to deliver long-term capital growth from a diversified portfolio of primarily UK equities. Wright has a contrarian investment style, seeking undervalued companies with the potential for positive change, rather than just those firms trading on low valuation multiples; he invests across the market cap spectrum. FSV invests in 80–120 companies, and up to 20% of the portfolio may be in overseas-listed firms. At the time of investment, no single stock will make up more than 10% of the portfolio, while up to 5% of gross assets may be held in unquoted securities. The trust’s investment performance is benchmarked against the FTSE All-Share Index.
In addition to equities, the manager may also invest in other transferable securities, collective investment schemes, money market instruments, cash and deposits. Derivatives are permitted for efficient portfolio management and investment purposes. The board believes that long-term returns can be enhanced by the prudent use of gearing. While gross gearing of up to 40% is allowed, the manager employs a working range of zero to 20% net gearing. Contracts for difference (CFDs) are used to gear long exposure and to take short positions.
The fund manager: Alex Wright
The manager’s view: Finding value in defensives
Manager Wright says that despite domestic uncertainty and weakening economic growth, the UK and global markets have rallied due to an expectation of continued easy monetary policy by central banks. He notes that the UK market remains very inexpensive, and he is finding value in multiple areas of the market, including defensive stocks. The manager says that with political uncertainty weighing heavily on the valuations of UK shares, the consensus view is an underweight allocation to the UK market by both domestic and international investors.
Wright comments that in aggregate, FSV’s portfolio is trading at a 10% discount to the UK market, which he suggests is an attractive entry point for investors. He notes the portfolio is currently as inexpensive as it has been since 2011, since which time the fund has performed strongly. The manager says that while the fundamentals of UK companies are not particularly attractive, this is also the case in other regions. However, he argues that in addition to low valuations in the UK, there is also the potential for a positive catalyst in terms of greater political clarity. Wright says that the tail risk of a no-deal Brexit has receded, with Boris Johnson having proposed a new deal with the EU and called a general election and suggests that any positive news on the political front could lead to a re-rating of the UK stock market.
The manager comments that in an environment of deteriorating company fundamentals, he is finding a number of attractive investment opportunities in more defensive areas of the market. FSV’s defensive exposure has been in an upward trend since early 2016, and is now the highest weighting during Wright’s tenure. He does not own the high-quality names that have re-rated, such as AstraZeneca or Unilever, as he considers their valuations too rich. Instead, he favours ‘hidden defensives’ such as defence companies (including Chemring, Meggitt and Ultra Electronics), and less expensive traditional defensive businesses, such as Imperial Tobacco (this position has been added to in recent months). The manager notes the increase in merger and acquisition activity in the UK as international buyers take advantage of cheap valuations. FSV has received bids for its holdings in Amerisur Resources, Charles Taylor, IFG and Millennium & Copthorne Hotels, which have made a measurable positive contribution to the trust’s performance.
Asset allocation
Investment process: Bottom-up stock selection
Wright aims to generate long-term capital growth from a diversified portfolio of primarily UK equities, selected following rigorous analysis. He is able to draw on Fidelity’s well-resourced analyst teams, who research companies and meet their managements, suppliers, competitors and customers, to thoroughly understand a business’s fundamentals. The manager also has access to a wide range of third-party research. He has a contrarian investment style, seeking valuation anomalies in unloved companies that have the potential for positive change. Once the benefits of this become apparent, there can be significant share price appreciation. Wright also looks for limited downside risk, in companies where investor expectations are low, but which possess an important asset or business characteristic that will provide some support to their share prices.
Current portfolio positioning
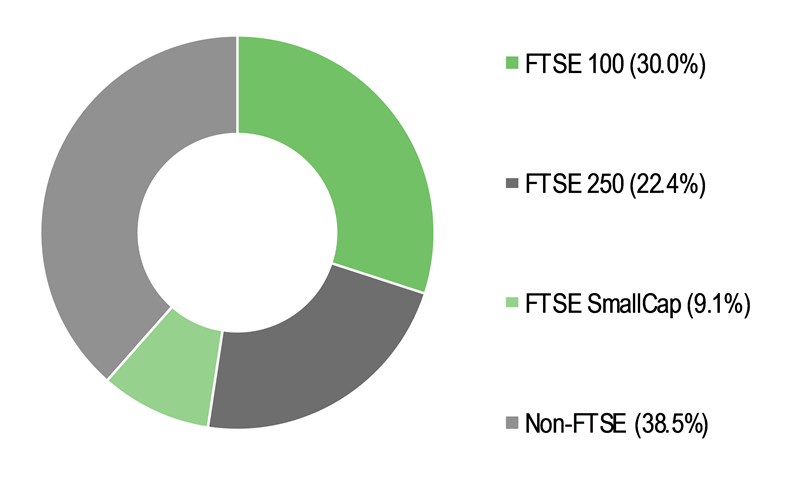
At end-October, FSV’s top 10 holdings made up 38.4% of the fund, which was broadly in line with 38.3% a year earlier; five names were common to both periods. Exhibit 3 (LHS) shows the portfolio breakdown by domicile rather than by where companies are listed (Ireland-domiciled companies are largely listed in the UK). The market cap breakdown in the right-hand chart illustrates that FSV invests across the size spectrum; the fund’s structure at end-October 2019 was broadly similar to end-October 2018.
|
Exhibit 3: Portfolio geographic and market cap exposures at end-October 2019 |
|
Portfolio geographic exposure by company domicile |
Portfolio market cap exposure – classified by FTSE index |
|
|
|
Source: Fidelity Special Values, Edison Investment Research. Note: Figures are adjusted for gearing and index futures. Numbers subject to rounding. |
|
FSV’s sector exposure is shown in Exhibit 4. Over the 12 months to 31 October 2019, the largest changes are a higher weighting in consumer goods (+3.8pp) with a lower financials exposure
(-3.9pp). The structure of the fund is similar to when we published our last note in July 2019, with a large overweight position in industrials (+13.8pp).
Exhibit 4: Portfolio sector exposure vs benchmark index (% unless stated)
Portfolio end-October 2019 |
Portfolio end- October 2018 |
Change |
Index end- October 2019 |
Active weight vs index (pp) |
Trust weight/ index weight (x) |
|
Financials |
29.9 |
33.8 |
(3.9) |
26.1 |
3.8 |
1.1 |
Industrials |
25.7 |
25.0 |
0.7 |
11.9 |
13.8 |
2.2 |
Consumer goods |
9.8 |
6.0 |
3.8 |
13.7 |
(3.9) |
0.7 |
Oil & gas |
9.7 |
9.7 |
(0.0) |
12.6 |
(2.9) |
0.8 |
Healthcare |
8.1 |
8.7 |
(0.6) |
9.6 |
(1.5) |
0.8 |
Consumer services |
6.7 |
9.7 |
(3.1) |
12.0 |
(5.3) |
0.6 |
Basic materials |
6.0 |
3.7 |
2.3 |
7.3 |
(1.3) |
0.8 |
Utilities |
3.7 |
0.7 |
3.0 |
2.9 |
0.8 |
1.3 |
Telecommunications |
0.4 |
0.0 |
0.4 |
2.8 |
(2.4) |
0.1 |
Technology |
0.0 |
2.7 |
(2.7) |
1.1 |
(1.1) |
0.0 |
100.0 |
100.0 |
100.0 |
Source: Fidelity Special Values, Edison Investment Research. Note: Figures are adjusted for gearing and index futures. Numbers subject to rounding.
The manager highlights two new holdings in FSV’s portfolio, ContourGlobal and Hammerson. ContourGlobal is a utility company with power generation projects in 18 countries across three continents. More than 90% of its revenues are under long-term contracts, with an average duration of 12 years, and it has renewable energy projects (greater than 50% of sales) offering growth opportunities. Its coal plant in Kosovo failed to receive funding by the World Bank, but Wright believes this hurdle will be overcome as the plant will be cleaner than some other coal-based projects. Hammerson is a retail property developer and investment company. While challenges in the UK retail sector are well documented, Hammerson was trading at a greater than 50% discount to NAV at the time of purchase, offering a margin of safety. The company has been selling non-core assets and reducing debt to realise value in its portfolio and strengthen its balance sheet.
Wright has been reducing FSV’s financials exposure due to weakening industry fundamentals. He has sold the positions in Bank of Ireland, Discover Financial Services and Lloyds Banking Group, while reducing the holdings in Allied Irish Bank and Citigroup. Interest rates have declined significantly, and depressed net interest margins are putting earnings under pressure. FSV retains a c 3% holding in Royal Bank of Scotland Group as it has features to offset margin compression. It has greater cost-cutting potential versus its peers, is generating excess capital, and has a healthy, well-covered dividend yield. The manager has also been selling smaller, lower-conviction holdings when share prices rallied on better Brexit news, such as Mothercare (a complete exit in September) and Speedy Hire.
Performance: Ahead over the medium and long term
Exhibit 5: Five-year discrete performance data
12 months ending |
Share price |
NAV |
FTSE All-Share |
FTSE 100 |
FTSE 250 |
FTSE SmallCap |
31/10/15 |
18.3 |
11.4 |
3.0 |
0.8 |
13.3 |
9.0 |
31/10/16 |
3.0 |
13.2 |
12.2 |
13.7 |
5.3 |
11.3 |
31/10/17 |
26.9 |
19.0 |
13.4 |
12.1 |
18.5 |
20.6 |
31/10/18 |
5.1 |
(1.8) |
(1.5) |
(0.9) |
(4.0) |
(3.8) |
31/10/19 |
5.5 |
4.7 |
6.8 |
6.5 |
9.1 |
3.8 |
Source: Refinitiv. Note: All % on a total return basis in pounds sterling.
In FY19 (ending 31 August), FSV’s NAV and share price total returns of -4.9% and -6.9% respectively were behind the benchmark’s +0.4% total return. While there will be periods when the fund’s performance lags the FTSE All-Share index, the board is confident that the manager can meaningfully outperform the benchmark over the longer term. In terms of sector attribution in FY19, the largest positive contributors were mining (+1.2pp) and pharmaceuticals & biotechnology (+1.1pp); however, they were more than offset by the trust’s banks exposure (-2.6pp). Looking at individual stocks, the best contributors were Serco Group, due to a positive inflexion in its earnings growth (+1.0pp), and Roche (+0.9pp) following positive news on pipeline products. The largest detractors were Irish banks AIB Group (-1.1pp) and Bank of Ireland Group (-0.8pp), which gave disappointing earnings guidance due to deteriorating industry fundamentals.
|
Exhibit 6: Investment trust performance to 31 October 2019 |
|
Price, NAV and benchmark total return performance, one-year rebased |
Price, NAV and benchmark total return performance (%) |
|
|
|
Source: Refinitiv, Edison Investment Research. Note: Three-, five- and 10-year performance figures annualised. |
|
FSV’s relative performance is highlighted in Exhibits 7 and 8. Its one-year numbers were negatively affected by a period of underperformance during the sharp stock market sell-off in Q418. The trust’s longer-term performance is much more encouraging, with its NAV and share price total returns ahead of the benchmark’s total return over three, five and 10 years.
In recent months, FSV’s performance has benefited from the position in Irish beverage company C&C Group, which is improving its distribution capabilities following the acquisition of Matthew Clark. The trust’s holding in Millennium & Copthorne Hotels also appreciated significantly as a result of a takeover bid from its controlling shareholder, Singaporean real estate investment company City Developments. Not owning large-cap pharma companies AstraZeneca and GlaxoSmithKline detracted from relative performance, as did the position in Pearson. The media company has had a bumpy ride in its transition from a print to a digital product offering, issuing another profit warning in late September due to weakness in its US higher education business. While the manager has confidence in the company’s long-term digital business model, he says the recent warning gives him more concern about the company’s near-term earnings and potential for share price volatility, so he has reduced the size of FSV’s holding.
|
Exhibit 7: Share price and NAV total return performance, relative to indices (%) |
||||||||
|
One month |
Three months |
Six months |
One year |
Three years |
Five years |
10 years |
|
Price relative to FTSE All-Share |
3.2 |
3.3 |
0.2 |
(1.2) |
18.0 |
24.4 |
37.8 |
|
NAV relative to FTSE All-Share |
1.1 |
1.0 |
(0.2) |
(1.9) |
2.6 |
11.9 |
24.5 |
|
Price relative to FTSE 100 |
3.7 |
4.3 |
0.5 |
(0.9) |
19.0 |
26.5 |
45.3 |
|
NAV relative to FTSE 100 |
1.6 |
2.0 |
0.2 |
(1.6) |
3.5 |
13.7 |
31.4 |
|
Price relative to FTSE 250 |
1.1 |
(1.5) |
(2.0) |
(3.2) |
13.4 |
15.7 |
3.2 |
|
NAV relative to FTSE 250 |
(1.0) |
(3.7) |
(2.4) |
(4.0) |
(1.4) |
4.1 |
(6.7) |
|
Price relative to FTSE SmallCap |
1.6 |
1.8 |
2.7 |
1.7 |
16.9 |
17.3 |
18.4 |
|
NAV relative to FTSE SmallCap |
(0.4) |
(0.4) |
2.4 |
0.9 |
1.6 |
5.5 |
7.0 |
|
|
Source: Refinitiv, Edison Investment Research. Note: Data to end-October 2019. Geometric calculation. |
||||||||
|
Exhibit 8: NAV total return performance relative to benchmark over three years |
||||||||
|
||||||||
|
Source: Refinitiv, Edison Investment Research |
||||||||
Discount: Re-rating in recent years
FSV’s shares have re-rated meaningfully over the last few years. Its current 2.3% premium to cum-income NAV compares with the range of a 3.4% premium to a 4.1% discount over the past 12 months. Over the last one, three, five and 10 years FSV has traded at an average premium of 1.0% and average discounts of 1.6%, 3.3% and 6.2% respectively.
The board seeks a single-digit discount or a small premium to NAV (in normal market conditions). Renewed annually, it has authority to purchase up to 14.99% and allot up to 10% of FSV’s issued share capital. In FY19, c 9.6m shares (c 3.6% of the end-FY18 share base) were issued, raising c £24.2m. Allotments have continued in FY20 (Exhibit 1); so far a further c 4.8m shares (c 1.7% of the end-FY19 share base) have been issued, raising c £12.7m.
|
Exhibit 9: Share price premium/discount to NAV (including income) over three years (%) |
|
|
Source: Refinitiv, Edison Investment Research |
Capital structure and fees
FSV is a conventional investment trust with one class of share; there are currently 280.9m ordinary shares in issue. The manager employs net gearing in a range of 0% to 20% in normal market conditions (0.0% at end-October 2019). While the fundamentals of UK companies are not particularly robust, the stock market has performed well; hence, the manager is waiting for a period of market weakness before gearing up the portfolio.
Since 1 September 2018, Fidelity has been paid a tiered annual management fee; 0.85% of NAV up to £700m and 0.75% of NAV above this level (previously a flat fee of 0.875% of NAV). In FY19, FSV’s ongoing charge was 0.97%, 7bp lower than 1.04% in FY18, and meaningfully lower than 1.32% 10 years ago. The reduction in the ongoing charge is helped by the higher number of shares in issue, which spreads fixed costs over a larger base.
FSV is subject to a three-yearly continuation vote; the next is due at the 12 December 2019 AGM.
Dividend policy and record
Starting in 2015, dividends are now paid twice (in June and January) rather than once a year, in order to smooth the payment stream. In FY19, FSV’s regular dividend of 5.75p per share was 15% higher year-on-year. The board also announced a special dividend of 1.50p per share, meaning the total distribution of 7.2p per share (1.2x covered) is 45% higher than in FY18. Regular annual dividends have increased for the last 10 consecutive financial years, compounding at a rate of 12.3% pa. The board has said that unless there are unusual circumstances, special dividends are less likely to be paid in the future. FSV currently offers a 2.1% dividend yield.
Peer group comparison
In Exhibit 10, we show the 13 funds in the AIC UK All Companies sector, which have a variety of investment mandates. FSV’s NAV total returns are above average over the last five years, while trailing over the last one, three and 10 years. The trust is currently the only fund trading at a premium to NAV. Its ongoing charge is modestly above average (no performance fee is payable), and the fund currently has no gearing. While FSV has a focus on capital growth rather than income, it does offer a 2.1% dividend yield.
Exhibit 10: AIC UK All Companies sector as at 27 November 2019*
% unless stated |
Market |
NAV TR |
NAV TR |
NAV TR |
NAV TR |
Discount |
Ongoing charge |
Perf. |
Net |
Dividend |
Fidelity Special Values |
762.8 |
9.0 |
21.5 |
52.7 |
175.5 |
2.0 |
0.9 |
No |
100 |
2.1 |
Artemis Alpha Trust |
123.6 |
11.5 |
25.9 |
17.5 |
68.2 |
(16.9) |
1.0 |
No |
100 |
1.6 |
Aurora |
140.2 |
9.8 |
33.7 |
37.9 |
43.4 |
(0.5) |
0.4 |
Yes |
100 |
1.9 |
Baillie Gifford UK Growth |
278.5 |
13.8 |
20.0 |
32.5 |
132.4 |
(9.7) |
0.5 |
No |
100 |
2.4 |
Henderson Opportunities Trust |
78.3 |
1.6 |
26.7 |
40.0 |
220.2 |
(16.6) |
0.8 |
Yes |
113 |
2.2 |
Independent Investment Trust |
286.2 |
3.4 |
47.5 |
99.6 |
257.1 |
(8.1) |
0.2 |
No |
100 |
1.9 |
Invesco Perp Select UK Equity |
58.1 |
14.0 |
18.8 |
37.4 |
214.0 |
(2.0) |
0.9 |
Yes |
102 |
3.7 |
JPMorgan Mid Cap |
278.0 |
23.8 |
39.9 |
72.1 |
308.6 |
(10.4) |
0.9 |
No |
106 |
2.5 |
Jupiter UK Growth |
44.3 |
2.0 |
6.0 |
4.7 |
83.8 |
(3.2) |
1.2 |
Yes |
106 |
3.0 |
Keystone |
221.7 |
13.6 |
16.9 |
22.8 |
147.3 |
(14.9) |
0.5 |
Yes |
104 |
3.4 |
Mercantile |
1,903.6 |
23.4 |
46.3 |
76.2 |
242.7 |
(4.6) |
0.5 |
No |
101 |
2.6 |
Sanditon Investment Trust |
44.9 |
(3.1) |
(7.1) |
(3.4) |
|
(3.8) |
1.3 |
Yes |
100 |
0.7 |
Schroder UK Mid Cap |
208.2 |
18.9 |
38.5 |
56.6 |
270.0 |
(13.5) |
0.9 |
No |
104 |
2.8 |
Average (13 funds) |
340.6 |
10.9 |
25.7 |
42.0 |
180.3 |
(7.9) |
0.8 |
103 |
2.4 |
|
Trust rank in sector |
2 |
9 |
8 |
5 |
7 |
1 |
4 |
8 |
9 |
Source: Morningstar, Edison Investment Research. Note: *Performance to 26 November 2019 based on ex-par NAV. TR = total return. Net gearing is total assets less cash and equivalents as a percentage of net assets.
The board
FSV’s board has six non-executive directors, five of whom are considered to be independent. The chairman is Andy Irvine (joined the board on 15 April 2010, chairman since 5 July 2016). Sharon Brown has announced her intention to retire at the 12 December 2019 AGM; she was appointed as a director on 15 April 2010 (senior independent director since 5 July 2016, and chair of the audit committee since 26 October 2010). Nigel Foster joined the board on 1 September 2015, Dean Buckley on 3 November 2015 and Claire Boyle on 24 June 2019. Nicky McCabe was appointed as a director on 9 December 2004; due to the length of her tenure and her previous roles at Fidelity, which included head of investment trusts, she is considered to be non-independent.
Following Brown’s departure, Buckley will become senior independent director and Boyle will become chair of the audit committee. A new director, Alison McGregor, will join FSV’s board with effect from 1 January 2020. She is a non-executive director of the Confederation of British Industry (CBI), Scottish Power Energy Networks, Beatson Cancer Charity, and is an adviser to the board at the Adam Smith Business School at Glasgow University and co-chair of the Scottish Apprenticeship Advisory Board.
|
|
Research: TMT
Strong organic revenue growth in H120 was boosted by several multi-year fraud licences and the contribution from the VIX Verify and IDology acquisitions. During H1, GB Group (GBG) made good progress with its strategy to expand internationally and enhance its product functionality and datasets. Management is confident of meeting consensus expectations for FY20; while our forecasts are unchanged at the operating profit level, a higher effective tax rate reduces our normalised EPS forecasts by c 3% in FY20–22e.