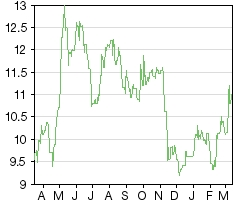
Last close As at 05/08/2026
—
— 0.00 (0.00%)
Market capitalisation
—
Research: TMT
TXT’s FY17 results confirmed that the remaining TXT Next business is showing solid growth. Profitability has been supressed by efforts to widen the customer base as well as the effect of spreading central costs over a smaller revenue base, but we expect margins to improve as the business grows revenues in FY18 and FY19. The company has confirmed a €1 per share dividend for FY17, leaving the majority of TXT Retail disposal proceeds within the business to invest in accretive acquisitions.
TXT e-solutions |
Cash proceeds support ambitious growth plans |
FY17 results |
Software & comp services |
14 March 2018 |
Share price performance
Business description
Next events
Analysts
TXT e-solutions is a research client of Edison Investment Research Limited |
|||||||||||||||||||||||||||||||||||||||||||||||
TXT’s FY17 results confirmed that the remaining TXT Next business is showing solid growth. Profitability has been supressed by efforts to widen the customer base as well as the effect of spreading central costs over a smaller revenue base, but we expect margins to improve as the business grows revenues in FY18 and FY19. The company has confirmed a €1 per share dividend for FY17, leaving the majority of TXT Retail disposal proceeds within the business to invest in accretive acquisitions.
Year end |
Revenue (€m) |
PBT* |
EPS* |
DPS |
P/E |
Yield |
12/16 |
33.1 |
4.0 |
0.27 |
0.30 |
40.4 |
2.7 |
12/17 |
35.9 |
3.0 |
0.19 |
1.00 |
59.0 |
9.1 |
12/18e |
39.2 |
2.7 |
0.17 |
0.16 |
65.1 |
1.5 |
12/19e |
42.1 |
3.7 |
0.23 |
0.17 |
48.0 |
1.6 |
Note: *PBT and EPS are normalised, excluding amortisation of acquired intangibles, exceptional items and share-based payments.
FY17 results substantially in line
TXT e-solutions (TXT) reported 8.4% revenue growth for FY17, with 22% growth in licence and maintenance revenues and 7% growth in services revenues. Gross profits were 10.8% higher y-o-y with gross margin expanding 0.9pp to 43.6%, helped by a slightly higher proportion of high margin licence revenues. EBITDA was in line with our forecast, declining 17% y-o-y as the company invested in growing the business outside of Italy, as well as taking on the full head office and listing costs post the disposal of TXT Retail. TXT ended the year with net cash of €87.3m. We have revised our forecasts to reflect a higher operating cost base as well as the adoption of IFRS 15 and 16. We reduce our normalised FY18 EPS forecast by 22% and introduce a forecast for FY19e EPS growth of 36%.
Acceleration of growth strategy
TXT recently announced its largest shareholder had sold its 25.6% stake to Enrico Magni (via his 60% ownership in Laserline) at €10.5 per share. Mr Magni has expressed his desire to become actively involved with the board and has confirmed that he supports the current corporate structure and listing. TXT announced an extraordinary €1 per share dividend for FY17, significantly higher than the €0.30 in FY16. This will leave TXT with cash of more than €70m to fund future acquisitions – this is higher than the amount we had previously assumed the company would retain. We believe that with the new shareholder on the board, the company may grow the business via acquisition more quickly than we had anticipated.
Valuation: Factors in accretive acquisitions
On price-based valuation metrics, TXT continues to trade at a premium to peers as two-thirds of its market cap is made up by the year-end cash balance of €87.3m. Until the bulk of TXT’s cash is put to use on value-accretive acquisitions, we would expect the stock to trade at a premium to peers on a P/E basis. On an EV basis, TXT trades at a small discount to peers, with forecast EBITDA and EBIT margins slightly below the peer group average.
Review of FY17 results
Exhibit 1: FY17 results highlights
FY16a |
FY17e |
FY17a |
Difference |
y-o-y |
|
Revenues (€m) |
33.1 |
35.5 |
35.9 |
1.1% |
8.4% |
Gross profit |
14.1 |
15.2 |
15.6 |
3.0% |
10.8% |
Gross margin |
42.7% |
42.8% |
43.6% |
0.8% |
0.9% |
EBITDA (€m) |
4.3 |
3.5 |
3.5 |
1.4% |
(17.0%) |
EBITDA margin |
12.9% |
9.8% |
9.9% |
0.0% |
(3.0%) |
Normalised EBIT (€m) |
4.0 |
3.1 |
3.2 |
1.5% |
(19.6%) |
Normalised EBIT margin |
12.0% |
8.8% |
8.9% |
0.0% |
(3.1%) |
Normalised net income (€m) |
3.2 |
2.3 |
2.2 |
(3.8%) |
(31.6%) |
Discontinued operations |
3.0 |
69.1 |
66.8 |
N/A |
N/A |
Normalised EPS (€) |
0.27 |
0.19 |
0.19 |
(3.9%) |
(31.4%) |
Reported basic EPS (€) |
0.48 |
6.10 |
5.87 |
(3.6%) |
1136.4% |
Net cash (€m) |
5.4 |
86.9 |
87.3 |
0.4% |
1525.8% |
Dividend (€) |
0.30 |
0.15 |
1.00 |
566.7% |
233.3% |
Source: TXT e-solutions, Edison Investment Research
TXT reported revenues and gross profits ahead of our forecasts for FY17. The company grew revenues 8.4% y-o-y and increased the gross margin by 90bp. Revenues in Q417 were up 2.4% y-o-y, with 11.3% growth in licence and maintenance income to €1.66m from €0.9m in Q317 and €1.49m in Q416. As expected, EBITDA was lower than the level reported in FY16, partly because the company has increased its investment in growing the business outside of Italy, and also because since the disposal of TXT Retail in October, the company now bears the full central costs (albeit reduced) and costs of being a public company, which were previously spread across the two businesses. The €66.8m contribution from discontinued operations was made up of a €70.6m gain on disposal of TXT Retail, €0.8m net income contributed by TXT Retail in the nine months prior to disposal and €4.6m costs and taxes relating to the disposal. The company closed the year with a net cash balance of €87.3m, substantially in line with our forecast.
The company announced an extraordinary dividend for FY17 of €1.0, significantly higher than the €0.3 paid last year. This will be paid on 9 May, with an ex-dividend date of 7 May. This will use c €12m of the company’s current cash balance, leaving more than €70m to invest in acquisitions. The company is retaining a larger proportion of the proceeds within the business than we had previously expected – we wrote in November that we expected funds of c €35m to be retained. We believe this is related to the recent change in a significant shareholder.
Change in major shareholder signals more ambitious growth plans
On 21 February, the company received notice that its largest shareholder, E-business Consulting, had agreed to sell its 25.62% stake to Laserline for €10.5 per share. Laserline is an Italian company specialising in car security technology and services and is 60% owned by Enrico Magni, an Italian entrepreneur. On 28 February, Mr Magni confirmed he would be seeking active involvement in the board, and that he was happy with the current company structure and for TXT to remain public. We understand there is no plan to combine Laserline and TXT, rather this is just a vehicle for Mr Magni’s ownership of TXT shares. We expect that the company will be targeting larger than originally planned acquisitions in the aerospace and aviation market, and may consider acquisitions in the banking & finance market, hence the retention of a larger proportion of disposal proceeds.
Product launches and customer wins
TXT Next launched two new products in FY17:
■
Pacelab FPO Cloud: this takes Pacelab’s existing Flight Planning Optimisation solution and makes it available in the cloud. This enables pilots to optimise the route during the flight to minimise fuel consumption and emissions and to avoid air turbulence. A proof of concept is underway with a large North American airline.
■
Pacelab WEAVR: this is a platform to facilitate the development and use of training applications for pilots, crew and maintenance staff. This includes support for augmented reality (AR) applications.
In FY17, TXT Next signed up several new customers including Finnair, Saab and Ferchau.
Outlook and changes to forecasts
We have revised our forecasts to reflect FY17 results and to take into account the application of IFRS 15 (revenue recognition) and IFRS 16 (lease accounting). While IFRS 15 adoption is required for the accounting period starting on or after 1 January 2018, IFRS 16 application is not required until the following year, however, TXT has decided to adopt both in FY18. IFRS 15 will have a minimal effect on services and maintenance revenues, however it will affect licence revenues. Currently, most licences are sold on a perpetual basis with 12 months of support and maintenance – when the licence is signed, the full value is recognised and support and maintenance revenues are recognised over the year. Under IFRS 15, as the licence is linked to the term of the initial support and maintenance contract, licence revenues will also be recognised across that same term. As licence revenues only make up a small proportion of total revenues, this should have a limited impact on revenues. Under IFRS 16, the company will need to capitalise operating leases, in particular the lease on the Milan head office. We estimate that this will shift c €0.9m of lease expense from operating costs into depreciation and finance costs and will add c €1.5m to debt.
■
Revenues: we have increased our FY18 forecast by 1.8%, as we expect slightly higher growth in both licences and services. For FY19e, we forecast growth of 7.3%.
■
EBITDA: we have increased our underlying cost forecasts in FY18 to reflect marginally higher spending in R&D (as the company starts to lose the benefit of social contribution grants) and higher commercial and G&A expenses based on the level incurred in Q417; offsetting this we have switched lease costs out of G&A and into depreciation.
■
EBIT: the impact of higher operating expenses reduces FY18 EBIT by 22.4% to €2.6m (6.6% margin). We forecast that EBIT margins will increase in FY19e to 8.5%, as higher revenues drop through.
■
Normalised EPS: the lower EBIT results in a 21.7% reduction in our FY18e EPS forecast. We forecast EPS growth of 35.5% in FY19e.
■
Net cash: we forecast net cash will reduce to €76.5m by the end of FY18, reflecting the €11.7m dividend payout, and increase to €77.8m by the end of FY19.
Exhibit 2: Changes to forecasts
FY18e old |
FY18e new |
Change |
y-o-y |
FY19e new |
y-o-y |
|
Revenues (€m) |
38.5 |
39.2 |
1.8% |
9.3% |
42.1 |
7.3% |
Gross margin |
41.0% |
41.9% |
1.0% |
(1.7%) |
42.1% |
0.2% |
Gross profit |
15.8 |
16.4 |
4.1% |
5.1% |
17.7 |
7.9% |
EBITDA (€m) |
3.6 |
3.8 |
4.2% |
7.5% |
4.8 |
25.7% |
EBITDA margin |
9.5% |
9.7% |
0.2% |
(0.2%) |
11.4% |
1.7% |
Normalised EBIT (€m) |
3.3 |
2.6 |
(22.4%) |
(18.8%) |
3.6 |
37.9% |
Normalised EBIT margin |
8.6% |
6.6% |
(2.1%) |
(2.3%) |
8.5% |
1.9% |
Normalised net income (€m) |
2.5 |
2.0 |
(21.5%) |
(9.3%) |
2.7 |
35.8% |
Normalised EPS (€) |
0.22 |
0.17 |
(21.7%) |
(9.4%) |
0.23 |
35.5% |
Reported basic EPS (€) |
0.19 |
0.14 |
(27.0%) |
(97.6%) |
0.20 |
42.7% |
Net cash (€m) |
87.2 |
76.5 |
(12.2%) |
(12.3%) |
77.8 |
1.7% |
Dividend (€) |
0.16 |
0.16 |
0.0% |
(84.0%) |
0.17 |
6.3% |
Source: Edison Investment Research
Valuation
On price-based valuation metrics, TXT continues to trade at a premium to peers as 66% of its market cap is made up by the year-end cash balance of €84m. Until the bulk of TXT’s cash is put to use on value-accretive acquisitions, we would expect the stock to trade at a premium to peers on a P/E basis. On an EV basis, TXT trades at a small discount to peers, with forecast EBITDA and EBIT margins slightly below the peer group average. We note that earlier this year Assystem bought SQS for £281m at a price equivalent to FY17e EV/Sales of 1.07x, EV/EBITDA of 11.2x and P/E of 20.0x.
Exhibit 3: Peer group operating and valuation metrics
Company |
Share price |
Market cap |
Rev growth |
EBIT margin |
EBITDA margin |
EV/Sales (x) |
EV/EBITDA (x) |
P/E (x) |
||||||
(m) |
CY |
NY |
CY |
NY |
CY |
NY |
CY |
NY |
CY |
NY |
CY |
NY |
||
TXT |
€ 10.96 |
€ 129 |
9.3% |
7.3% |
6.6% |
8.5% |
9.7% |
11.4% |
1.1 |
1.0 |
10.9 |
8.6 |
65.1 |
48.0 |
European engineering and IT services companies |
||||||||||||||
AKKA Technologies |
€ 54.00 |
€ 1,096 |
6.0% |
5.4% |
7.3% |
8.2% |
9.6% |
10.1% |
0.9 |
0.9 |
9.9 |
8.9 |
17.1 |
14.7 |
Alten |
€ 78.75 |
€ 2,664 |
8.1% |
5.5% |
10.1% |
10.3% |
10.8% |
11.0% |
1.2 |
1.2 |
11.6 |
10.7 |
17.3 |
15.9 |
Altran |
€ 14.22 |
€ 2,500 |
9.2% |
5.2% |
11.1% |
11.7% |
12.6% |
13.1% |
1.2 |
1.1 |
9.2 |
8.4 |
13.9 |
12.4 |
AtoS |
€ 112.95 |
€ 11,912 |
-0.6% |
2.6% |
9.7% |
10.2% |
13.4% |
13.9% |
1.0 |
0.9 |
7.2 |
6.8 |
12.8 |
11.8 |
Cap Gemini |
€ 105.85 |
€ 17,844 |
0.9% |
5.3% |
11.2% |
11.6% |
14.1% |
14.3% |
1.5 |
1.4 |
10.5 |
9.8 |
17.3 |
15.8 |
Devoteam |
€ 88.50 |
€ 738 |
14.4% |
8.7% |
10.3% |
10.5% |
10.7% |
10.9% |
1.1 |
1.0 |
10.5 |
9.5 |
23.0 |
19.9 |
ESI Group |
€ 42.70 |
€ 257 |
10.2% |
6.3% |
10.4% |
10.9% |
11.8% |
13.3% |
1.9 |
1.7 |
15.7 |
13.2 |
26.5 |
22.7 |
Exprivia |
€ 1.52 |
€ 79 |
3.9% |
4.3% |
8.0% |
8.2% |
11.6% |
11.5% |
0.8 |
0.7 |
6.5 |
6.3 |
12.6 |
11.7 |
Reply |
€ 52.65 |
€ 1,972 |
10.7% |
9.1% |
13.0% |
13.0% |
14.4% |
14.4% |
2.0 |
1.8 |
13.6 |
12.5 |
22.6 |
20.5 |
SciSys |
£1.35 |
£39 |
1.6% |
4.0% |
9.0% |
0.0% |
10.8% |
11.4% |
0.9 |
0.8 |
8.1 |
7.4 |
13.1 |
11.5 |
Sopra Steria |
€ 169.90 |
€ 3,491 |
5.0% |
4.4% |
8.0% |
8.7% |
9.9% |
10.3% |
1.0 |
1.0 |
10.4 |
9.6 |
15.6 |
13.7 |
Average |
6.3% |
5.5% |
9.8% |
9.4% |
11.8% |
12.2% |
1.2 |
1.2 |
10.3 |
9.4 |
17.4 |
15.5 |
||
Source: Edison Investment Research, Bloomberg. Note: Priced at 12 March.
Exhibit 4: Financial summary
€'000s |
2012 |
2013 |
2014 |
2015 |
2016 |
2017 |
2018e |
2019e |
|||||
Year end 31 December |
IFRS |
IFRS |
IFRS |
IFRS |
IFRS |
IFRS |
IFRS |
IFRS |
|||||
PROFIT & LOSS |
|||||||||||||
Revenue |
|
|
46,499 |
52,560 |
54,410 |
61,540 |
33,060 |
35,852 |
39,186 |
42,061 |
|||
Cost of sales |
(22,351) |
(24,854) |
(26,455) |
(29,189) |
(18,954) |
(20,224) |
(22,764) |
(24,339) |
|||||
Gross profit |
24,148 |
27,706 |
27,955 |
32,351 |
14,106 |
15,628 |
16,422 |
17,721 |
|||||
EBITDA |
|
|
5,322 |
6,263 |
5,324 |
6,659 |
4,260 |
3,536 |
3,802 |
4,781 |
|||
Operating Profit (before amort and except) |
|
|
4,283 |
5,241 |
4,284 |
5,820 |
3,954 |
3,180 |
2,582 |
3,561 |
|||
Amortisation of acquired intangibles |
0 |
(285) |
(285) |
(285) |
(264) |
(439) |
(439) |
(439) |
|||||
Exceptionals and other income |
939 |
0 |
1,468 |
0 |
(557) |
0 |
0 |
0 |
|||||
Other income |
0 |
0 |
0 |
(740) |
0 |
(69) |
0 |
0 |
|||||
Operating Profit |
5,222 |
4,956 |
5,467 |
4,795 |
3,133 |
2,672 |
2,143 |
3,122 |
|||||
Net Interest |
(37) |
(435) |
(249) |
(151) |
48 |
(208) |
150 |
150 |
|||||
Profit Before Tax (norm) |
|
|
4,246 |
4,806 |
4,035 |
5,669 |
4,002 |
2,972 |
2,732 |
3,711 |
|||
Profit Before Tax (FRS 3) |
|
|
5,185 |
4,521 |
5,218 |
4,644 |
3,181 |
2,464 |
2,293 |
3,272 |
|||
Tax |
(188) |
121 |
(1,046) |
(762) |
(661) |
(710) |
(642) |
(916) |
|||||
Profit After Tax (norm) |
4,092 |
4,927 |
3,226 |
4,739 |
3,170 |
2,170 |
1,967 |
2,672 |
|||||
Profit After Tax (FRS 3) |
4,997 |
4,642 |
4,172 |
3,882 |
2,520 |
1,754 |
1,651 |
2,356 |
|||||
Average Number of Shares Outstanding (m) |
11.0 |
11.5 |
11.5 |
11.7 |
11.7 |
11.7 |
11.7 |
11.7 |
|||||
EPS - normalised (c) |
|
|
37 |
43 |
28 |
41 |
27 |
19 |
17 |
23 |
|||
EPS - normalised fully diluted (c) |
|
|
34 |
41 |
28 |
40 |
27 |
19 |
17 |
23 |
|||
EPS - (IFRS) (c) |
|
|
45 |
40 |
36 |
33 |
48 |
587 |
14 |
20 |
|||
Dividend per share (c) |
18.2 |
22.7 |
22.7 |
25.0 |
30.0 |
100.0 |
16.0 |
17.0 |
|||||
Gross margin (%) |
51.9 |
52.7 |
51.4 |
52.6 |
42.7 |
43.6 |
41.9 |
42.1 |
|||||
EBITDA Margin (%) |
11.4 |
11.9 |
9.8 |
10.8 |
12.9 |
9.9 |
9.7 |
11.4 |
|||||
Operating Margin (before GW and except) (%) |
9.2 |
10.0 |
7.9 |
9.5 |
12.0 |
8.9 |
6.6 |
8.5 |
|||||
BALANCE SHEET |
|||||||||||||
Fixed Assets |
|
|
18,570 |
17,850 |
18,019 |
18,132 |
25,428 |
8,860 |
9,120 |
7,881 |
|||
Intangible Assets |
16,621 |
15,370 |
15,078 |
14,692 |
21,296 |
7,332 |
6,888 |
6,445 |
|||||
Tangible Assets |
1,154 |
1,118 |
1,249 |
1,361 |
1,598 |
793 |
1,497 |
701 |
|||||
Other |
795 |
1,362 |
1,692 |
2,079 |
2,534 |
735 |
735 |
735 |
|||||
Current Assets |
|
|
36,769 |
34,914 |
34,892 |
38,946 |
37,085 |
109,426 |
100,390 |
103,105 |
|||
Stocks |
1,388 |
1,451 |
1,820 |
2,075 |
3,146 |
2,528 |
2,628 |
2,728 |
|||||
Debtors |
19,562 |
18,642 |
20,768 |
27,791 |
26,369 |
17,215 |
18,251 |
19,590 |
|||||
Cash |
15,819 |
14,821 |
12,304 |
9,080 |
7,570 |
89,683 |
79,511 |
80,787 |
|||||
Other |
0 |
0 |
0 |
0 |
0 |
0 |
0 |
0 |
|||||
Current Liabilities |
|
|
(20,651) |
(17,864) |
(17,451) |
(18,349) |
(21,051) |
(13,612) |
(15,364) |
(16,357) |
|||
Creditors |
(15,155) |
(14,512) |
(15,297) |
(17,528) |
(20,243) |
(12,937) |
(14,089) |
(15,082) |
|||||
Short term borrowings |
(5,496) |
(3,352) |
(2,154) |
(821) |
(808) |
(675) |
(1,275) |
(1,275) |
|||||
Long Term Liabilities |
|
|
(8,666) |
(6,965) |
(6,491) |
(5,105) |
(7,180) |
(4,781) |
(4,781) |
(4,781) |
|||
Long term borrowings |
(4,301) |
(2,896) |
(1,685) |
0 |
(1,391) |
(1,688) |
(1,688) |
(1,688) |
|||||
Other long term liabilities |
(4,365) |
(4,069) |
(4,806) |
(5,105) |
(5,789) |
(3,093) |
(3,093) |
(3,093) |
|||||
Net Assets |
|
|
26,022 |
27,935 |
28,969 |
33,624 |
34,282 |
99,893 |
89,365 |
89,848 |
|||
CASH FLOW |
|||||||||||||
Operating Cash Flow |
|
|
2,760 |
7,630 |
5,404 |
2,412 |
10,676 |
119 |
3,818 |
4,336 |
|||
Net Interest |
(37) |
(435) |
(249) |
(151) |
105 |
(208) |
150 |
150 |
|||||
Tax |
64 |
(1,615) |
(1,344) |
(1,461) |
(2,022) |
379 |
(642) |
(916) |
|||||
Capex |
(405) |
(483) |
(615) |
(763) |
(738) |
(661) |
(420) |
(420) |
|||||
Acquisitions/disposals |
(8,450) |
19 |
0 |
0 |
(5,403) |
82,250 |
0 |
0 |
|||||
Financing |
1,690 |
(755) |
(597) |
2,215 |
(828) |
(6) |
(440) |
0 |
|||||
Dividends |
0 |
(2,107) |
(2,615) |
(2,678) |
(2,931) |
(3,496) |
(11,738) |
(1,873) |
|||||
Net Cash Flow |
(4,378) |
2,254 |
(16) |
(426) |
(1,141) |
78,377 |
(9,272) |
1,276 |
|||||
Opening net debt/(cash) |
|
|
(10,266) |
(6,023) |
(8,575) |
(8,465) |
(8,259) |
(5,371) |
(87,320) |
(76,548) |
|||
HP finance leases initiated |
0 |
0 |
0 |
0 |
0 |
0 |
0 |
0 |
|||||
Other |
135 |
298 |
(94) |
220 |
(1,747) |
3,572 |
(1,500) |
(0) |
|||||
Closing net debt/(cash) |
|
|
(6,023) |
(8,575) |
(8,465) |
(8,259) |
(5,371) |
(87,320) |
(76,548) |
(77,824) |
|||
Source: TXT e-solutions, Edison Investment Research
Edison is an investment research and advisory company, with offices in North America, Europe, the Middle East and AsiaPac. The heart of Edison is our world-renowned equity research platform and deep multi-sector expertise. At Edison Investment Research, our research is widely read by international investors, advisers and stakeholders. Edison Advisors leverages our core research platform to provide differentiated services including investor relations and strategic consulting. Edison is authorised and regulated by the Financial Conduct Authority. Edison Investment Research (NZ) Limited (Edison NZ) is the New Zealand subsidiary of Edison. Edison NZ is registered on the New Zealand Financial Service Providers Register (FSP number 247505) and is registered to provide wholesale and/or generic financial adviser services only. Edison Investment Research Inc (Edison US) is the US subsidiary of Edison and is regulated by the Securities and Exchange Commission. Edison Investment Research Pty Limited (Edison Aus) [46085869] is the Australian subsidiary of Edison. Edison Germany is a branch entity of Edison Investment Research Limited [4794244]. www.edisongroup.com DISCLAIMER |
Frankfurt +49 (0)69 78 8076 960 Schumannstrasse 34b 60325 Frankfurt Germany |
London +44 (0)20 3077 5700 280 High Holborn London, WC1V 7EE United Kingdom |
New York +1 646 653 7026 295 Madison Avenue, 18th Floor 10017, New York US |
Sydney +61 (0)2 8249 8342 Level 12, Office 1205 95 Pitt Street, Sydney NSW 2000, Australia |
Frankfurt +49 (0)69 78 8076 960 Schumannstrasse 34b 60325 Frankfurt Germany |
London +44 (0)20 3077 5700 280 High Holborn London, WC1V 7EE United Kingdom |
New York +1 646 653 7026 295 Madison Avenue, 18th Floor 10017, New York US |
Sydney +61 (0)2 8249 8342 Level 12, Office 1205 95 Pitt Street, Sydney NSW 2000, Australia |
Redbubble’s (RBL) rapid market growth is driven by three disruptive key trends: customer demand for personally relevant goods; manufacturing- and print-on-demand; and the sharing economy of the internet with economically viable and easily shared technology. These trends mean its individual customised production to order is economically viable. As a result, RBL has a disruptive retail model with long-term growth potential based on low customer acquisition costs, as well as a positive working capital cycle with neither inventory nor warehousing requirements.