Last close As at 05/08/2026
GBP1.32
▲ 1.00 (0.76%)
Market capitalisation
GBP69m
Research: Industrials
Carr’s Group
Written by
Carr's Group |
Focus on growth divisions |
Disposal of Food division |
Consumer staples |
9 September 2016 |
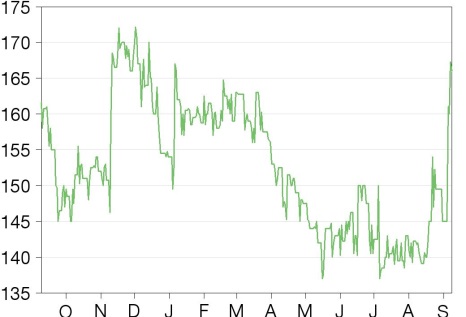
Share price performance
Business description
Next event
Analysts
Carr's Group is a research client of Edison Investment Research Limited |
|||||||||||||||||||||||||||||||||||||||||||||||
Carr’s Group is to sell its Food division to Whitworths for £24.9m net cash. The move enables management to focus investment on the Agriculture and Engineering divisions. These are engaged in geographically diverse activities where there is less competition, defensible IP and substantially greater opportunities for growth. While we believe the disposal is advantageous for the group, in the short term it will reduce earnings. We have revised our FY17 and FY18 estimates and cut our indicative valuation from 197p/share to 161p.
Year |
Revenue (£m) |
PBT* |
EPS* |
DPS |
P/E |
Yield |
08/14 |
429.0 |
17.0 |
13.2 |
3.4 |
12.6 |
2.1 |
08/15 |
411.6 |
18.1 |
14.0 |
3.7 |
11.9 |
2.2 |
08/16e |
403.2 |
18.1 |
13.9 |
3.8 |
11.9 |
2.3 |
08/17e |
332.2 |
14.6 |
10.7 |
21.4** |
15.5 |
12.9 |
Note: *PBT and EPS are normalised, excluding amortisation of acquired intangibles, exceptional items and share-based payments. **Including 17.54p special dividend.
Special dividend for shareholders
Whitworths is paying £24.9m net for the Food division, which generated £2.4m in profit before tax in FY15. We estimate this represents 13.7x historical profit after tax, which is a premium to the P/E multiple for the group as a whole. £16.0m of this cash will be returned to shareholders via a special dividend of 17.54p/share. The remainder will be used to strengthen the balance sheet and invest in acquisitions and organic growth.
Food division operating in difficult markets
As discussed in our November note, the UK flour market continues to suffer from overcapacity, despite the closure of three Premier Food mills. Demand for flour is static and bread manufacturers are under constant pressure from supermarkets to reduce prices. Management has addressed these challenges by investing £17m in the state-of-the art mill in Kirkcaldy, upgrading the Silloth mill to meet newer food-handling standards and focusing the Maldon mill on ethnic products. This has raised divisional profit from £0.4m in FY12 to £2.4m in FY15. Under current market conditions, it would have been difficult to increase divisional profits significantly going forward. Moreover, the division was reliant on a relatively small number of customers at some locations, making it vulnerable to them changing supplier. The disposal, which was initiated by Whitworths, frees management to concentrate on the two divisions capable of delivering strong growth.
Valuation: Share price spike from special dividend
Our sum-of-the parts valuation based on our revised estimates is 161p. This ignores any value ascribed to the special dividend. Anticipation of this payment is likely to provide near-term support to the share price. In the longer term, share price appreciation above our indicative level will be predicated on news that management is using cash from the disposal to accelerate growth in the remaining two divisions.
Transaction releases cash for growth
Carr’s has sold its Food division (£80.3m revenue in the year to August 2015, reported PBT £2.4m, gross assets £44.1m on 29 August 2015) for gross proceeds of £36.0m. After adjusting for the carrying value of net debt (£7.9m) and an estimated £3.2m for working capital, net proceeds were £24.9m, payable in cash. Out of this, management proposes a £16.0m special dividend (17.54p/share), payable to shareholders on the register at 16 September. This leaves £8.9m residual cash available for management to invest in growing the Agriculture and Engineering divisions.
Adjustments to our forecasts
We have adjusted our forecasts to reflect the transaction, which management advises was completed immediately before the FY16 year end. Adjustments include:
■
Removal of an estimated £77.0m and £79.0m Food revenues from FY17e and FY18e, respectively.
■
Removal of an estimated £2.3m profit before tax attributable to the Food division in both FY17e and FY18e.
■
£0.8m additional head office costs that were previously netted in with the Food division profit.
■
£0.2m reduction in interest for FY17e and FY18e to reflect a reduction in debt, though we note that Carr’s Group will continue to incur finance charges on working capital facilities.
■
Reduction in depreciation of £1.6m in both FY17e and FY18e.
■
Reduction in capex of £1.0m in both FY17e and FY18e.
■
Receipt of £24.9m net in respect of the Food division at end FY16e.
■
Reduction of debt at end FY16e by £7.9m to reflect debt sold with the Food division.
■
Reduction in working capital of £9.0m at end of FY16e to reflect the disposal of the Food division.
■
£24.9m reduction in tangible assets at end FY16e.
The impact on the P&L is summarised in Exhibit 1.
Exhibit 1: Changes to estimates
Year end 31 August |
FY16e |
FY17e |
FY18e |
||||||
Old |
New |
% |
Old |
New |
% |
Old |
New |
% |
|
Group revenues (£m) |
403.2 |
403.2 |
0.0 |
409.2 |
332.2 |
-18.8 |
415.0 |
336.0 |
-19.0 |
Group EBITDA (£m) |
22.5 |
22.5 |
0.0 |
22.0 |
17.1 |
-22.3 |
22.3 |
17.4 |
-22.0 |
Group adjusted PBT (£m) |
18.1 |
18.1 |
0.0 |
17.7 |
14.6 |
-17.5 |
18.1 |
15.0 |
-17.1 |
Group adjusted EPS (p) |
13.9 |
13.9 |
0.0 |
13.3 |
10.7 |
-19.5 |
13.6 |
11.0 |
-19.1 |
Group DPS (p) |
3.8 |
3.8 |
0.0 |
3.9 |
21.4* |
+449* |
4.0 |
4.0 |
0.0 |
Net (debt)/cash (£m) |
(21.7) |
11.1 |
N/A |
(7.4) |
0.8 |
N/A |
1.5 |
6.5 |
+333% |
Source: Edison Investment Research. Note: *Including 17.54p special dividend.
Valuation
We continue to use a sum-of-the parts calculation to value this stock. We apply a weighted average prospective P/E multiple of 14.9x to our EPS estimate for FY16e, adjusted as though the Food division was not part of the group during this period. We note that the mean P/E for our sample of agricultural supply companies has increased significantly from the 13.4x in our April note. This improvement is probably related to a stabilisation in farm-gate milk prices, a factor which benefits Carr’s Group as well as NWF and Wynnstay. It is therefore reasonable to apply an increased multiple to Carrs’ agricultural activities as well. This calculation gives an indicative value of 161p.
Exhibit 2: Sum-of-the-parts calculation
% Year 1 PBT |
Year 1 |
Comment |
|
Agriculture including JVs and associates |
80.6% |
14.5x |
Average for sample of agricultural supply companies |
Engineering |
19.4% |
16.8x |
Sector average for German industrial companies |
Weighted |
14.9x |
||
Normalised year 1 EPS |
10.8p |
Adjusted as though Food division was not part of the group during FY16e |
|
Indicative value |
160.8 p |
Source: Bloomberg, Edison Investment Research. Priced at 6 September 2016.
If we adopt this indicative value and compare the resultant multiples for those of our sample of agricultural supply stocks, annualised for an August year-end, Carr’s EV/EBITDA multiples are in line with the sector mean. This validates our calculation of value. Carr’s P/E multiples are slightly above the sector mean. We believe this is appropriate given the higher operating margins potentially obtainable from an engineering business compared with an agricultural supply business. We note that for Carr’s Group, the operating margin for the Agriculture division in FY15 was 3.5%, compared with 3.0% for the Food division and 9.2% for the Engineering division. The difference has been more pronounced historically. FY15 was not a good year for the Engineering division, as weakness in the oil and gas sector led to under-utilisation in the Chirton Engineering business. In FY14, the Engineering division had an operating margin of 13.8%
Exhibit 3: Multiples of listed agricultural supply stocks
Market |
EV/EBITDA |
EV/EBITDA |
P/E |
P/E |
|
BayWa |
£881.0m |
10.3x |
10.0x |
13.9x |
12.8x |
NWF |
£75.9m |
5.2x |
4.9x |
11.3x |
11.2x |
Origiin Enterprises |
£602.6m |
9.4x |
8.5x |
13.1x |
12.2x |
Wynnstay Group |
£105.5m |
7.3x |
7.0x |
17.5x |
17.2x |
Mean |
8.0x |
7.6x |
14.0x |
13.4x |
|
Carr's Group at 161p |
£146.8m |
8.2x |
7.7x |
15.1x |
14.7x |
Source: Bloomberg, Edison Investment Research
We believe it is likely that the share price will see support ahead of 16 September, which is the record date for shareholders to receive the special dividend. What happens after that point depends on whether investors appreciate the difference that this disposal makes to the Group’s opportunities for profit growth. Historically, Carr’s Group has traded at a discount to the mean of the listed peers in our sample of stocks involved in agricultural supply (BayWa, Origin, NWF Group and Wynnstay Group). We believe that this discount was linked to concerns about the severe margin pressures in the UK flour market and consequent risks to profits. This is reflected in the Food division having the lowest operating margin of the three divisions in FY15. Before the Kirkcaldy mill came on stream the divisional operating margin was much lower: only 0.5% in FY12. This reservation concerning potential performance of the Food division is now removed. In our opinion this makes it more likely that the share price will settle on a P/E multiple that is closer to the mean for the sector, as reflected in our indicative share price, rather than significantly discounted, as has been the case for at least a decade. After that, any share price appreciation will be predicated on newsflow confirming that management is using cash from the disposal to accelerate growth in the remaining two divisions.
Management has given some top-level guidance on how this cash may be used. We believe it is likely that the cash will be used to continue the programme of bolt-on acquisitions to expand the Country Store network; to increase feed-block production capacity overseas, possibly in new territories such as New Zealand or Latin America; and to acquire complementary engineering businesses, strengthening the division’s offer in the nuclear, aerospace and defence and oil and gas sectors. Investment in both feed-block production and engineering activity would potentially have a beneficial impact on margins, helping support further upwards re-rating.
Exhibit 4: Financial summary
£m |
2014 |
2015 |
2016e |
2017e |
2018e |
|
Year-end Aug |
||||||
PROFIT & LOSS |
||||||
Revenue |
|
429.0 |
411.6 |
403.2 |
332.2 |
336.0 |
EBITDA |
|
20.9 |
22.2 |
22.5 |
17.1 |
17.4 |
Operating Profit (pre amort. of acq intangibles & SBP) |
15.8 |
17.0 |
17.1 |
13.2 |
13.6 |
|
Amortisation of acquired intangibles |
0.0 |
0.0 |
0.0 |
0.0 |
0.0 |
|
Share-based payments |
(0.4) |
(0.6) |
(0.6) |
(0.6) |
(0.6) |
|
Exceptionals |
0.0 |
0.0 |
0.0 |
0.0 |
0.0 |
|
Operating Profit |
15.4 |
16.4 |
16.5 |
12.7 |
13.0 |
|
Net Interest |
(1.4) |
(1.2) |
(1.0) |
(0.6) |
(0.6) |
|
Share of post-tax profits in JVs and associates |
2.5 |
2.3 |
2.0 |
2.0 |
2.0 |
|
Profit Before Tax (norm) |
|
17.0 |
18.1 |
18.1 |
14.6 |
15.0 |
Profit Before Tax (FRS 3) |
|
16.6 |
17.5 |
17.5 |
14.1 |
14.4 |
Tax |
(3.7) |
(3.8) |
(3.8) |
(3.2) |
(3.3) |
|
Profit After Tax (norm) |
13.3 |
14.3 |
14.2 |
11.4 |
11.7 |
|
Profit After Tax (FRS 3) |
12.9 |
13.7 |
13.6 |
10.9 |
11.1 |
|
Post tax profit (loss) relating to discontinued operations |
0.0 |
0.0 |
0.0 |
0.0 |
0.0 |
|
Minority interest |
(1.5) |
(1.7) |
(1.7) |
(1.7) |
(1.7) |
|
Net income (norm) |
11.8 |
12.6 |
12.5 |
9.7 |
10.0 |
|
Net income (FRS 3) |
11.4 |
12.0 |
11.9 |
9.2 |
9.4 |
|
Average Number of Shares Outstanding (m) |
89.0 |
89.6 |
90.1 |
91.2 |
91.2 |
|
EPS - normalised (p) |
|
13.2 |
14.0 |
13.9 |
10.7 |
11.0 |
EPS - normalised fully diluted (p) |
|
12.8 |
13.6 |
13.4 |
10.3 |
10.6 |
EPS - FRS 3 (p) |
|
12.3 |
13.4 |
13.3 |
10.0 |
10.3 |
Dividend per share (p) |
3.4 |
3.7 |
3.8 |
21.4* |
4.0 |
|
EBITDA Margin (%) |
4.9 |
5.4 |
5.6 |
5.2 |
5.2 |
|
Operating Margin (before GW and except.) (%) |
3.7 |
4.1 |
4.2 |
4.0 |
4.0 |
|
BALANCE SHEET |
||||||
Fixed Assets |
|
83.4 |
86.5 |
65.4 |
64.9 |
64.5 |
Intangible Assets |
10.3 |
11.3 |
11.1 |
10.9 |
10.9 |
|
Tangible Assets and Deferred tax assets |
73.1 |
75.2 |
54.3 |
54.0 |
53.7 |
|
Current Assets |
|
114.3 |
116.9 |
109.6 |
98.4 |
102.8 |
Stocks |
33.3 |
35.0 |
31.4 |
32.4 |
33.0 |
|
Debtors |
63.7 |
65.3 |
55.1 |
56.1 |
57.1 |
|
Cash |
17.3 |
16.5 |
23.2 |
10.0 |
12.7 |
|
Current Liabilities |
|
(75.6) |
(70.2) |
(60.8) |
(58.9) |
(56.7) |
Creditors including tax, social security and provisions |
(55.9) |
(55.0) |
(48.7) |
(49.7) |
(50.5) |
|
Short term borrowings |
(19.7) |
(15.2) |
(12.2) |
(9.2) |
(6.2) |
|
Long Term Liabilities |
|
(32.3) |
(34.2) |
(8.5) |
(8.5) |
(8.5) |
Long term borrowings |
(22.2) |
(25.7) |
0.0 |
0.0 |
0.0 |
|
Retirement benefit obligation |
0.0 |
0.0 |
0.0 |
0.0 |
0.0 |
|
Other long term liabilities |
(10.1) |
(8.5) |
(8.5) |
(8.5) |
(8.5) |
|
Net Assets |
|
89.8 |
99.0 |
105.8 |
96.0 |
102.1 |
Minority interest |
(10.2) |
(11.9) |
(11.9) |
(11.9) |
(11.9) |
|
Shareholders’ equity |
|
79.7 |
87.1 |
93.8 |
84.1 |
90.2 |
CASH FLOW |
||||||
Operating Cash Flow |
|
17.1 |
15.1 |
20.3 |
16.2 |
16.5 |
Net Interest |
(1.4) |
(1.2) |
(1.0) |
(0.6) |
(0.6) |
|
Tax |
(3.2) |
(4.0) |
(3.8) |
(3.2) |
(3.3) |
|
Investment activities |
(7.5) |
(4.0) |
(8.4) |
(3.4) |
(3.4) |
|
Acquisitions/disposals |
(3.6) |
(1.7) |
23.9 |
0.0 |
0.0 |
|
Equity financing and other financing activities |
(4.1) |
(1.8) |
7.9** |
0.0 |
0.0 |
|
Dividends |
(2.9) |
(3.1) |
(3.3) |
(19.2) |
(3.6) |
|
Net Cash Flow |
(5.7) |
(0.7) |
35.5 |
(10.2) |
5.7 |
|
Opening net debt/(cash) |
|
22.1 |
24.6 |
24.4 |
(11.1) |
(0.8) |
HP finance leases initiated |
(2.3) |
0.0 |
0.0 |
0.0 |
0.0 |
|
Other |
(5.5) |
(0.9) |
0.0 |
0.0 |
0.0 |
|
Closing net debt/(cash) |
|
24.6 |
24.4 |
(11.1) |
(0.8) |
(6.5) |
Source: Edison Investment Research. Note: *Including 17.54p Special Dividend. **£7.9m debt sold with Food division.
|
|
Research: Investment Companies
Tetragon Financial Group