Martin Currie Asia Unconstrained Trust (MCP) aims to deliver returns in line with nominal Asia ex-Japan GDP growth on a rolling three-year basis. It aims to achieve this through a rigorous ‘forensic’ analysis, to build a relatively concentrated portfolio of c 30 high-conviction stocks. This strategy was adopted in August 2014 and has since delivered annualised total returns of 11.6% to end-May 2018, with lower volatility relative to the MSCI AC Asia ex-Japan index. Following a change in dividend policy in April 2017, MCP’s 4.1% yield is one of the highest among peers, although its discount to cum-income NAV is one of the widest, suggesting scope to narrow over time.
Written by
Martin Currie Asia Unconstrained Trust |
Capital growth with attractive yield |
Investment trusts |
21 June 2018 |
Share price/discount performance
Three-year performance vs index
Gearing
Analysts
|
|||||||||||||||||||||||||||||||||||||||||||||||||||||||||||||||||||||||||||||||||||||||||||||
Martin Currie Asia Unconstrained Trust (MCP) aims to deliver returns in line with nominal Asia ex-Japan GDP growth on a rolling three-year basis. It aims to achieve this through a rigorous ‘forensic’ analysis, to build a relatively concentrated portfolio of c 30 high-conviction stocks. This strategy was adopted in August 2014 and has since delivered annualised total returns of 11.6% to end-May 2018, with lower volatility relative to the MSCI AC Asia ex-Japan index. Following a change in dividend policy in April 2017, MCP’s 4.1% yield is one of the highest among peers, although its discount to cum-income NAV is one of the widest, suggesting scope to narrow over time.
12 months ending |
Share price |
NAV |
Blended |
MSCI AC Asia ex-Japan (%) |
3Y GDP growth Asia ex-Japan (%) |
31/05/14 |
(5.9) |
(7.8) |
(1.7) |
(2.8) |
11.6 |
31/05/15 |
16.0 |
13.6 |
8.7 |
21.6 |
8.2 |
31/05/16 |
(13.0) |
(8.8) |
8.1 |
(13.2) |
8.1 |
31/05/17 |
46.9 |
43.0 |
9.6 |
44.8 |
9.6 |
31/05/18 |
8.0 |
6.7 |
12.6 |
14.1 |
12.6 |
Source: Thomson Datastream, IMF, Edison Investment Research. Note: All % on a total return basis in GBP. *Blended benchmark is MSCI AC Asia Pacific Index (Japan fixed at 40%) until 30 June 2008, MSCI AC Asia Pacific Index from 1 July 2008 to 30 June 2011, MSCI AC Asia Pacific Index (Japan fixed at 25%) from 1 July 2011 to 10 July 2014, and three-year rolling nominal Asian GDP growth from 1 August 2014.
Investment strategy: Rigorous bottom-up approach
The managers follow a rigorous approach, with an absolute-return mindset, to find companies with strong balance sheets, robust business models, and sustainable cash flow growth with reasonable valuations. Unconstrained by index considerations, the manager and Martin Currie’s Asian team conduct over 500 company visits pa and undertake detailed ‘forensic’ fundamental analysis, as well as corporate governance assessments, to help build high-conviction on its potential investments. The companies in the portfolio are typically less volatile than the market, and the strategy aims to offer downside protection.
Market outlook: Solid prospects for Asia
Asian equities have performed strongly since early 2016; however, following 27% earnings growth in 2017 for Asia ex-Japan corporates, valuations are not yet stretched. Consensus earnings estimates for 2018 are still above trend, while favourable demographics and a rapidly rising middle-class provide compelling medium-term investment opportunities for disciplined investors.
Valuation: Scope for discount to narrow
MCP currently trades on a 12.9% discount to its cum-income NAV, which is towards the lower end of its three-year range of 7.6% to 13.8%. Last year’s change in dividend policy to pay an additional distribution from capital reserves, has doubled the trust’s yield, currently 4.2%, without changing the investment focus on capital growth. This yield compares favourably among peers, including the income-focused funds, which trade at premiums or narrower discounts.
Exhibit 1: Trust at a glance
Investment objective and fund background |
Recent developments |
||||||||||||||||||||||||||||||||||||||||||||||||||||||||||||||||||||||
Martin Currie Asia Unconstrained Trust aims to achieve returns commensurate with Asia ex-Japan nominal GDP growth, unconstrained by an equity benchmark, over a long-term time horizon from a concentrated portfolio of 20–30 stocks. Before its change of investment objective in August 2014, it invested in a pan-Asian portfolio with a benchmark of MSCI AC Asia Pacific (Japan fixed at 25%). |
■ 7 June 2018: Annual report for 12 months ending 31 March 2018. NAV TR +6.3% versus benchmark TR+12.0%. Share price TR +9.8%. ■ 7 June 2018: Declaration of final dividend of 14.0p per share. ■ 16 November 2017: Interim report for six months ending 30 September 2017. NAV TR +3.6% versus benchmark TR+7.8%. Share price TR +6.8%. ■ 16 November 2017: Declaration of interim dividend of 2.7p per share. |
||||||||||||||||||||||||||||||||||||||||||||||||||||||||||||||||||||||
Forthcoming |
Capital structure |
Fund details |
|||||||||||||||||||||||||||||||||||||||||||||||||||||||||||||||||||||
AGM |
July 2018 |
Ongoing charges |
FY18 1.08% (see page 7) |
Group |
Martin Currie Investment Management |
||||||||||||||||||||||||||||||||||||||||||||||||||||||||||||||||||
Interim results |
November 2018 |
Net gearing |
0.4% end-April 2018 |
Manager |
Andrew Graham |
||||||||||||||||||||||||||||||||||||||||||||||||||||||||||||||||||
Year end |
31 March |
Annual mgmt fee |
Tiered, 0.60–0.75% of net assets |
Address |
Saltire Court, 20 Castle Terrace, Edinburgh EH1 2ES |
||||||||||||||||||||||||||||||||||||||||||||||||||||||||||||||||||
Dividend paid |
December and August |
Performance fee |
None |
||||||||||||||||||||||||||||||||||||||||||||||||||||||||||||||||||||
Launch date |
1985 |
Trust life |
Indefinite |
Phone |
0131 229 5252 |
||||||||||||||||||||||||||||||||||||||||||||||||||||||||||||||||||
Continuation vote |
Three-year, next in July 2018 |
Loan facilities |
£15m (see page 7) |
Website |
|||||||||||||||||||||||||||||||||||||||||||||||||||||||||||||||||||
Dividend policy and history (financial years) |
Share buyback policy and history (financial years) |
||||||||||||||||||||||||||||||||||||||||||||||||||||||||||||||||||||||
MCP pays dividends twice a year in December and August. MCP has recently changed its dividend policy (see details on page 7). |
MCP is authorised to repurchase up to 14.99% and allot up to 5% of its ordinary shares. A tender offer for 10% of the issued shares was made in August 2014. |
||||||||||||||||||||||||||||||||||||||||||||||||||||||||||||||||||||||
|
|
||||||||||||||||||||||||||||||||||||||||||||||||||||||||||||||||||||||
Shareholder base (as at 30 April 2018) |
Portfolio exposure by sector (as at 30 April 2018) |
||||||||||||||||||||||||||||||||||||||||||||||||||||||||||||||||||||||
|
|
||||||||||||||||||||||||||||||||||||||||||||||||||||||||||||||||||||||
Top 10 holdings (as at 30 April 2018) |
|||||||||||||||||||||||||||||||||||||||||||||||||||||||||||||||||||||||
|
|||||||||||||||||||||||||||||||||||||||||||||||||||||||||||||||||||||||
Source: Martin Currie Asia Unconstrained Trust, Edison Investment Research, Bloomberg, Thomson Reuters. Note: *N/A where not in April 2017 top 10.
Market outlook: Asia relatively attractive
The rally in the MSCI Asia ex-Japan index, which started in early 2016, extended into the beginning of 2018, driven by synchronous global growth and strong upward momentum in corporate earnings revisions. Asia ex-Japan’s earnings increased by an impressive 27% in 2017 (source: Factset), following a few weak years. As a result, valuations do not appear stretched. As shown in the right-hand chart in Exhibit 2, Asia ex-Japan’s current forward P/E multiple of c 13.1x, is just slightly above its 10-year average of 12.2x, while consensus expectations for 2018 earnings growth is a robust 13%. Asian equities also appear relatively attractively valued compared to global equities, and continue to trade at a significant P/E multiple discount, despite having higher growth prospects. As shown in the left-hand chart, the IMF expects compound annual GDP growth for Asia of 6.4% between 2018 and 2023, versus 3.5% for the world. Reasonable valuations and an earnings recovery continuing for a second year could be supportive for Asian equities.
|
Exhibit 2: Emerging Asia vs advanced and world markets – GDP growth and valuation metrics |
|
GDP growth rates – emerging Asia vs advanced economies and world |
DS Asia ex-Japan vs DS World valuation comparison |
|
|
|
Source: IMF WEO April 2018, Thomson Datastream, Edison Investment Research |
|
Fund profile: High yield, fundamental approach
Since 1 August 2014, MCP adopted Martin Currie’s Asia Long-Term Unconstrained (ALTU) strategy. This strategy is designed to capture capital growth in line with nominal GDP growth in Asia over a rolling three-year period, which conventional indices have failed to deliver over the past ten years. It aims to achieve this through a rigorous bottom-up approach to selecting stocks, unconstrained by benchmark considerations, focusing on quality companies with strong balance sheets and robust business models to underpin growing free cash flow. Since its adoption, the ALTU strategy has delivered returns that are less volatile than the market, and may offer downside protection. The portfolio is relatively concentrated with c 30 high-conviction companies, which the manager believes can be held for the long-term. Its highly detailed, ‘forensic’ approach to analysing companies is facilitated by an experienced and well-resourced team consisting of lead manager, Andrew Graham, and six other portfolio manager/analysts. Following the adoption of a new dividend policy in 2017, MCP has materially raised its dividend payments without changing its focus on capital growth. The dividend yield of 4.1% is one of the highest among peers (see page 8).
The fund manager: Andrew Graham
The manager’s view: Asia looks attractive
Graham believes the global macroeconomic environment is becoming more challenging for equities in general. Following c 18 months of earnings upgrades, he observes this momentum may be petering out. The consensus for MSCI Asia ex-Japan earnings growth for 2018 in January was in excess of 15% and it is currently around 13%. The manager notes, however, that this is still an attractive level, and above the long-term trend for Asian earnings growth of around 6%. Global leading indicators (such as purchasing managers indices) are getting weaker; however, such observations are too short term so far to be conclusive. Meanwhile, after an unprecedented period of low interest rates, the global monetary environment has started to tighten, and Graham expects the cost of capital for companies to increase and stock markets to become more volatile. Against this backdrop of growing concerns, he is relatively positive about the prospects for Asian equities, citing unstretched valuations and neutral fund allocations to the region. The manager also believes MCP’s portfolio of stocks, well-underpinned by strong financials with few ‘over-owned’ names, to be lower risk than the index and well-placed in this changing environment.
Asia ex-Japan’s population of 3.7 billion is forecast to grow to 4.1 billion by the end of 2020, which is four times the population of the G7 countries. A recent report from the Carnegie Institute suggested that Asia will account for 88% of the next one billion people entering the middle-class cohort, which is growing by around 140 million pa. Graham finds that the long-term secular dynamics in Asia, primarily driven by positive demographics and the rapid growth of its middle class, provide compelling reasons to invest in well-run businesses that can capture the long-term growth in Asia’s consumption. MCP’s largest sector overweight is consumer discretionary; however, exposure to this secular growth theme is also found through other sectors, including financials and information technology.
Asset allocation
Investment process: ‘Forensic’ bottom-up approach
MCP follows Martin Currie’s Asia Long-Term Unconstrained (ALTU) strategy, which has been developed to deliver returns consistent with nominal GDP growth in the Asia region, adopting an absolute-return mindset, unencumbered by constraints against indices. The manager believes this strategy can outperform conventional equity indices, which historically have lagged Asian economic growth, over the longer term.
The investment process is bottom-up and draws on the resources of an experienced Asian equity team, which conducts over 500 company visits a year to identify companies with sustainable growth, strong management and a strategic market position. All companies are valued on their long-term cash flow potential and target companies are subject to further due diligence. This involves a ‘forensic’ review of historical financials, and a detailed analysis of financial statements to determine the quality of a company’s earnings and health of its balance sheet. A typical review involves a minimum of 250 man-hours. Potential investee companies also undergo a corporate governance assessment, which seeks to understand the extent of alignment of interest with minority shareholders. The manager has a ‘buy-and-hold’ approach, to minimise transaction costs and maximise the positive effect of compounding returns. However, he is also disciplined in the approach to selling an investment in one or more of the following situations: a structural change in the business, which has a negative impact on a company’s long-term potential; a breach of good corporate governance; if the market’s valuation of the business is meaningfully above that of the manager’s; or if other investment ideas offer significantly superior potential.
The portfolio consists of c 30 high-conviction stocks. Risk is primarily managed through knowing the underlying investments’ businesses well, with particular focus on sustainable cash flows and good corporate governance. It is also mitigated through diversification across countries and sectors.
Current portfolio positioning
As shown in Exhibit 3, MCP’s largest sector exposures are information technology (29.0%), financials (24.5%) and consumer discretionary (22.8%). The manager notes this belies the true extent of the portfolio’s exposure to companies that are beneficiaries of the long-term compelling theme of Asia’s rising middle class. Financial holdings are typically beneficiaries of the growing number of people captured by the formal banking sector, while technology holdings typically provide services to consumers, or manufacture products for consumer devices.
Recent purchases include Indian bank, HDFC Bank, one of the largest private sector banks with well-regarded management. The retail banking sector in India is attractive, given its rising middle class and a government desire to promote the formal economy, raising transparency. Private banks such as HDFC are also well-placed to take share from the state sector banks, which currently account for around 70% of the industry, but are challenged by low levels of capital and poor asset quality. Also in India, MCP purchased a position in Vakrangee, a technology company that provides ‘e-services’ on behalf of the government and for the private sector. Services include pension payments, tax collection and basic banking services. Its strategic advantage is its ability to reach a large population through a hard-to-replicate network of over 43,000 small outlets (known as kendras) in inner urban and more remote rural communities. This reach is attractive as a ‘last-mile’ logistic to many commercial companies, including Amazon, as the kendras can provide online access to a population without access to the internet, and offer in-store collection of goods. In China, MCP also recently invested in TravelSky, which provides digital logistics solutions for the travel industry. It has a monopoly position in Chinese airline global distribution systems, with solid barriers to entry. Although both Vakrangee and TravelSky are technology companies, the manager views them primarily as attractive plays on rising income and consumption.
|
Exhibit 3: Geographical exposure at 30 April 2018 |
Exhibit 4: Portfolio characteristics |
||||||||||||||||||||||||
|
|
||||||||||||||||||||||||
|
Source: Martin Currie Asia Unconstrained Trust, Edison Investment Research. Note: Net of gearing. |
Source: Martin Currie and UBS PAS, as at 30 April 2018. Note: *Indicates consensus. |
|
Exhibit 3: Geographical exposure at 30 April 2018 |
||||||||||||||||||||||||
|
||||||||||||||||||||||||
|
Source: Martin Currie Asia Unconstrained Trust, Edison Investment Research. Note: Net of gearing. |
||||||||||||||||||||||||
|
Exhibit 4: Portfolio characteristics |
||||||||||||||||||||||||
|
||||||||||||||||||||||||
|
Source: Martin Currie and UBS PAS, as at 30 April 2018. Note: *Indicates consensus. |
Given the ALTU strategy’s focus on well-managed, strong business franchises, good free cash flow and reasonable valuation, the portfolio has high-quality characteristics. As shown in Exhibit 4, compared with the MSCI Asia ex-Japan index, MCP’s portfolio has similar valuation profiles in EV/EBIT and EV/EBITDA terms; however, its return on equity is significantly higher than that of the index (15.4% versus 12.1%), despite net cash (versus 23% net debt). Should equity market conditions become more challenging, MCP’s portfolio appears lower risk than the index.
Performance: Aims to outperform Asia GDP
MCP’s investment objective is to generate returns in-line with Asia ex-Japan nominal GDP growth on a rolling three-year basis. This objective was adopted in August 2014 and therefore the relevant performance periods shown in Exhibits 5 and 6 are since change (SC). MCP’s NAV total return has outperformed its benchmark SC and over three years, although has underperformed over one year. This partly reflects the nature of the stock market rally, with strong index returns in the past year largely concentrated in a few names (mainly in technology, internet and energy) driven by inflows into index funds that do not focus on company fundamentals. It also reflects a few poor stock-specific performances, particularly over the past six months. Vakrangee’s share price has been especially weak in response to the resignation of its auditor, as well as a news article querying the existence of some of its kendras. The manager has conducted follow-up due diligence, which is still ongoing, alongside engagement with company management. The manager maintains a positive view of Vakrangee’s business and investment case, and clarity on these issues could provide a catalyst for a share price recovery. Samsonite was also weak following a critical report issued by a short-seller. This resulted in a sharp drop in its share price and trading in the shares was temporarily suspended twice. The team’s ‘forensic’ analysis helped validate the investment case and, subsequently, a robust response to the report from Samsonite, plus the appointment of a new CEO has been well received by investors. Samonsite’s share price has rebounded more recently (not captured in the performance numbers below).
|
Exhibit 5: Investment trust performance to 31 May 2018 |
||||||||
Price, NAV and blended benchmark TR performance, three years rebased |
Price, NAV and blended benchmark TR performance (%) |
|||||||
|
|
|||||||
|
Source: Thomson Datastream, Edison Investment Research. Note: Three, five and 10-year performance figures annualised. |
||||||||
|
Exhibit 6: Share price and NAV total return performance, relative to indices (%) |
||||||||
|
One month |
Three months |
Six months |
One year |
Three years |
SC |
Five years |
|
Price relative to blended benchmark |
1.2 |
(0.3) |
(4.3) |
(4.1) |
3.4 |
10.3 |
5.7 |
|
NAV relative to blended benchmark |
(0.3) |
(1.3) |
(4.9) |
(5.3) |
4.3 |
7.1 |
2.2 |
|
Price relative to MSCI AC Asia ex-Japan |
0.1 |
1.4 |
(2.8) |
(5.4) |
(3.8) |
(5.8) |
(11.1) |
|
NAV relative to MSCI AC Asia ex-Japan |
(1.4) |
0.3 |
(3.4) |
(6.5) |
(3.0) |
(8.5) |
(14.0) |
|
Price relative to MSCI World |
(1.9) |
(0.5) |
(2.1) |
(0.8) |
(5.2) |
(8.3) |
(17.9) |
|
NAV relative to MSCI World |
(3.4) |
(1.5) |
(2.7) |
(2.0) |
(4.4) |
(11.0) |
(20.6) |
|
|
Source: Thomson Datastream, Edison Investment Research. Note: Data to 31 May 2018. Geometric calculation. SC = since change of investment objective on 1 August 2014. |
||||||||
Discount: Scope for discount to narrow
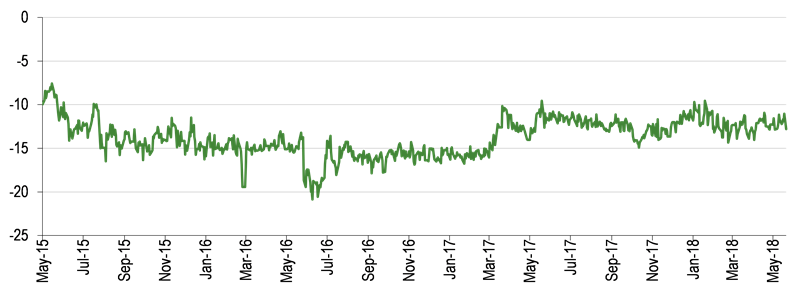
MCP is currently trading on a 12.8% discount to cum-income NAV, which is towards the wider end of its three-year range of 13.8% to 7.6%. The board is committed to managing the trust’s discount and seeks to achieve this through broadening the shareholder base of MCP, including implementing a change in dividend policy (see page 7) and marketing efforts to promote the trust to new potential investors. It also has the ability to manage the supply and demand for MCP’s shares through the authority to repurchase up to 14.99% of shares (renewable annually). The board believes, through a combination of an attractive yield, without compromising the capital-growth-focused strategy, and active promotion of the trust, the discount to NAV could narrow over time.
|
Exhibit 7: Share price discount to NAV (including income) over three years (%) |
|
|
Source: Thomson Datastream, Edison Investment Research |
Capital structure and fees
MCP is a conventional investment trust with one class of share; there are currently 36.1m ordinary shares outstanding and a further 3.4m shares held in treasury. The trust has a loan facility of £15m with RBS and as at end-April 2018, had gross gearing of 3.0% and net gearing of 0.4%. MCP is subject to a three-yearly continuation vote, with a vote due at this year’s AGM on 11 July 2018.
Martin Currie is paid an annual management fee of 0.75% of net assets up to £150m and 0.60% on net assets above £150m. This is allocated one-third to the revenue account and two-thirds to the capital account, reflecting the board’s expected long-term split of returns from income and capital gains. There is no performance fee. For FY18, the going charge was 1.08% (1.1% in FY17).
Dividend policy and record
The board identified investors’ appetite for income and in July 2017, received shareholder approval to distribute 2% of NAV from capital reserves, in addition to the traditional distributions from revenue income. This effectively doubled MCP’s yield in FY17. The board has recently proposed a final FY18 dividend of 14p, which would raise the total payment to 16.70p (16.28p in FY17), representing a 4.1% yield. Dividends are paid twice a year; the income derived dividend is paid in December and August, while the capital derived dividend is payable in August only.
Peer group comparison
Exhibit 8 shows the AIC Asia Pacific ex-Japan peer group, which has 15 members. This is a relatively disparate group, with some funds more focused on income, or the Pacific region (which includes Australasia), therefore direct comparisons are less meaningful. As the current MCP strategy was adopted in August 2014, the most relevant periods for comparing NAV total returns are one and three years, where MCP ranks 11th and 8th respectively among peers. Many of the peer group employ gearing, whereas MCP has minimal net gearing at 0.4%, ranking ninth. In terms of dividend yield, MCP ranks fourth, although its yield is comparable to those of the income-focused funds in the group, which trade at premiums to NAV or at relatively narrow discounts to NAV. MCP’s discount to ex-par NAV, however, ranks ninth among peers, suggesting scope for narrowing over time.
Exhibit 8: AIC Asia Pacific ex-Japan peer group as at 16 June 2018*
% unless stated |
Market cap £m |
NAV TR |
NAV TR |
NAV TR |
NAV TR 10 year |
Discount (ex-par) |
Ongoing charge |
Perf. |
Net gearing |
Dividend yield (%) |
Martin Currie Asia Unconstrained |
143.8 |
5.8 |
46.8 |
57.0 |
93.9 |
(10.7) |
1.1 |
No |
100.0 |
4.0 |
Aberdeen Asian Income |
375.6 |
3.2 |
36.1 |
33.7 |
197.3 |
(8.4) |
1.1 |
No |
106 |
4.4 |
Aberdeen Asian Smaller |
383.6 |
2.4 |
36.3 |
31.7 |
313.6 |
(12.7) |
1.2 |
No |
106 |
1.1 |
Aberdeen New Dawn |
267.0 |
6.9 |
44.2 |
52.6 |
168.7 |
(12.4) |
0.9 |
No |
108 |
1.7 |
Edinburgh Dragon |
708.6 |
6.7 |
45.3 |
55.7 |
181.7 |
(13.0) |
1.0 |
No |
102 |
0.9 |
Fidelity Asian Values |
281.9 |
3.7 |
51.5 |
95.3 |
211.8 |
(1.1) |
1.3 |
No |
96 |
1.1 |
Henderson Far East Income |
446.4 |
6.2 |
34.9 |
53.4 |
141.4 |
(0.3) |
1.1 |
No |
99 |
5.9 |
Invesco Asia |
206.7 |
8.4 |
58.6 |
107.7 |
224.3 |
(9.5) |
1.0 |
No |
97 |
1.5 |
JPMorgan Asian |
340.6 |
16.3 |
66.9 |
100.8 |
142.9 |
(11.7) |
0.7 |
No |
100 |
4.3 |
Pacific Assets |
323.1 |
7.9 |
42.9 |
85.1 |
157.7 |
(2.6) |
1.3 |
No |
100 |
1.0 |
Pacific Horizon |
218.9 |
28.7 |
78.6 |
121.2 |
181.1 |
1.4 |
1.1 |
No |
99 |
0.0 |
Schroder Asia Pacific |
784.2 |
14.6 |
75.3 |
105.0 |
240.1 |
(10.6) |
1.0 |
No |
104 |
1.2 |
Schroder Asian Total Return Inv. Co |
326.8 |
16.7 |
77.0 |
105.7 |
188.5 |
2.4 |
1.0 |
Yes |
102 |
1.3 |
Schroder Oriental Income |
639.8 |
7.6 |
48.8 |
66.8 |
226.8 |
(0.5) |
0.9 |
Yes |
106 |
3.9 |
Scottish Oriental Smaller Cos |
304.8 |
0.2 |
34.6 |
51.3 |
306.0 |
(14.3) |
1.2 |
Yes |
100 |
1.2 |
Average |
383.4 |
9.0 |
51.9 |
74.9 |
198.4 |
(6.9) |
1.1 |
102 |
2.2 |
|
Rank in sector (out of 15 trusts) |
15 |
11 |
8 |
9 |
15 |
10 |
7 |
8 |
4 |
Source: Morningstar, Edison Investment Research. Note: *Performance data to 15 June 2018. TR = total return. Net gearing is total assets less cash and equivalents as a percentage of net assets.
The board
The MCP board consists of five independent non-executive directors, chaired by Harry Wells, who was appointed a director in 2003 and assumed his current role in 2014. The other members are Gregory Shenkman (appointed in 2007 as senior independent director), Peter Edwards (appointed in 2007), Anja Balfour (appointed in 2012), and Martin Shenfield (appointed in 2015). The directors have backgrounds in asset management, finance and law.
|
|
Research: Financials
Record is in its 35th year and underlying its longevity are expertise and service levels that have sustained a client base through changing markets. FY18 saw further investment in personnel to support customised services, while a new product offering in passive hedging has the potential to earn performance fees that we have not included in our estimates. Similarly, positive net AUME flows could allow earnings to beat our expectations.