Canadian Overseas Petroleum
Written by
Canadian Overseas Petroleum |
Liberia – looking for Liza’s conjugate |
Company update |
Oil & gas |
2 August 2016 |
Share price performance
Business description
Next events
Analysts
Canadian Overseas Petroleum is a research client of Edison Investment Research Limited |
|||||||||||||||||||||||||||||||||||||||||||||||||
Canadian Overseas Petroleum’s (COPL) Mesurado-1 prospect in Liberia is set to be drilled in late 2016 or early 2017 by operator ExxonMobil, targeting multiple Santonian deepwater channel sands. Interest in block LB-13 has increased in recent months following ExxonMobil’s discovery of the prolific Liza oil field in the conjugate basin in Guyana. Mesurado-1 has been de-risked through the use of modern seismic techniques as well as the discovery of oil in offset wells. Mesurado-1’s pre-drill gross P50 unrisked resource is estimated at c 400mmbbl, hence success could prove to be game changing for COPL. COPL remains funded through US$120m of gross exploration costs by partner and operator ExxonMobil.
Year |
Revenue (US$m) |
EBITDA |
PBT* |
Net cash |
Capex |
12/14 |
0.0 |
(7.7) |
(6.6) |
4.7 |
(0.5) |
12/15 |
0.0 |
(6.5) |
(7.8) |
2.0 |
(0.2) |
12/16e |
0.0 |
(4.2) |
(4.2) |
4.4 |
(0.1) |
12/17e |
0.0 |
(4.4) |
(4.4) |
0.1 |
0.0 |
Note: *PBT and EPS are normalised, excluding amortisation of acquired intangibles, exceptional items and share-based payments.
Looking for Liza’s conjugate ‘twin sister’
After recent appraisal, ExxonMobil believes that the Liza oil discovery offshore Guyana could hold up to 1.4bnboe, making it one of the largest oil discoveries since the start of the decade. ExxonMobil is to looking to replicate this success by targeting a possible Liza Atlantic conjugate, Mesurado-1 offshore Liberia. Mesurado-1 is de-risked by the discovery of oil at the Montserrado-1 offset well on an adjacent licence (LB-15) as well as advanced seismic techniques (extended elastic impedance and full waveform inversion).
Path to monetisation key in success case
COPL is funded through the upcoming Liberia exploration programme operated by ExxonMobil up to a maximum gross carry of US$120m. We expect this to include drilling of the Mesurado-1 prospect, which we estimate at a P50 prospective resource of c 400mmbbl and geological chance of success (GCoS) of 30% (commercial chance of success 19.5%). Under Liberian PSC terms, we estimate a development could generate a 37% gross post exploration and appraisal IRR, and be underpinned by an NPV10 break-even oil price of c US$35/bbl. Monetisation in the success case will be key in determining the value of a discovery net to COPL. We provide a valuation based on COPL farming-down (farminee requiring a 20% IRR) as well as a ‘high case’ valuation based on asset sale at NPV10 – possible in the event of a major/NOC seeking strategic basin entry.
Valuation: Attractive risk/reward
We see few small-cap E&Ps that offer a funded exploration programme targeting over 400mmbbl of prospective resource over the next 12 months. We value COPL on the basis of a post-discovery farm-down, driving a C$0.15/share RENAV, and also provide a potential strategic asset valuation of C$0.22/share.
Liberia – looking for Liza’s conjugate
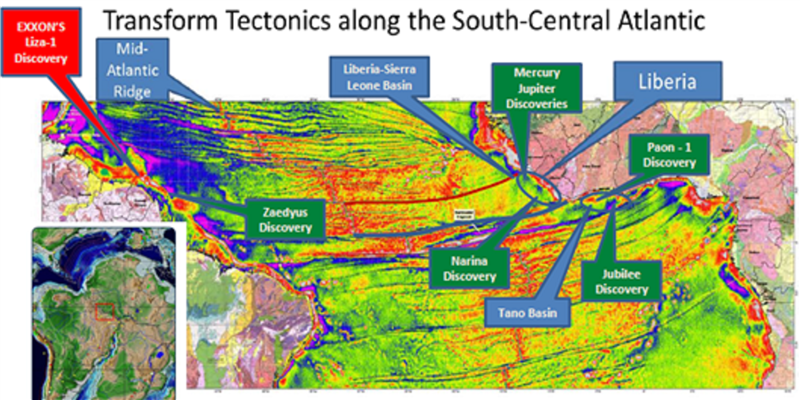
Modern reconstructions of West Gondwana combining plate tectonics and geophysical data have provided for accurate correlations between the Amazonian and West African cratons. A number of operators have focused their exploration efforts on targeting cross Atlantic analogues in order to extend West African exploration across to South America (eg Tullow’s knowledge of the Tano Basin in Ghana contributed to exploration success in French Guiana). Operator ExxonMobil and COPL are looking to follow recent exploration success in Guyana in similar aged stratigraphy offshore Liberia. ExxonMobil’s Liza-2 exploration/appraisal well, deep-water Guyana, confirmed an 800-1,400mmboe discovery and has added weight to the upcoming LB-13 exploration programme.
Conjugate Atlantic margins
The opening of the southern Atlantic Ocean in the Early Cretaceous separated South America from Africa, fully separating by the Early Albian age with the West African Transform Margin, from Ghana to Liberia, the last region to fully separate. In the late Cretaceous, source rocks were formed by Cenomanian to Turonian organic-rich marine shales with multiple turbidite sandstone reservoirs overlying potential source rock intervals. The Liberian basin is known to be structurally complex, however between major fracture zones the upper Cretaceous was less affected by major faulting, allowing for the deposition of thick deepwater shales and turbidite sands. The combination of mature hydrocarbon source and multiple sandstone intervals provides for a prospective basin.
Exploration of the late Cretaceous has led to several discoveries along the West African Transform Margin including those made offshore Ghana, Sierra Leone and Liberia. On the conjugate margin, several discoveries have been made in French Guiana, Suriname and Guyana.
|
Exhibit 1: Transform tectonics along the South-Central Atlantic |
|
|
Source: COPL |
The fall in oil price over the last 18 months has led to a significant reduction in global deepwater exploration activity. A stand-out is ExxonMobil’s Liza discovery in the Guyana-Suriname Basin, which the operator has estimated to hold 800-1,400mmboe. The Liza-1 well drilled in May 2015 encountered 90m of high-quality oil-bearing sand at 5,433m TVDSS and was followed by the Liza-2 discovery in June 2016. Liza-2 confirmed the presence of high-quality oil from the same reservoirs as Liza-1, encountering 58m of oil bearing sand in Upper Cretaceous formations. COPL believes that Liza is an analogue to the Mesurado-1 prospect in Liberia, a Santonian to Turonian channel/fan complex. The operator of Liza, ExxonMobil, has provided little detail on the discovery, other than stating that sands were oil bearing in the Upper Cretaceous. If it is found that Mesurado-1 has a similar AVO response and stratigraphy to Liza, it may be significantly de-risked pre-drill.
|
Exhibit 2: Liza a game-changing discovery in deep-water Guyana |
|
|
Source: Spectrum |
The Mesurado-1 prospect
Partners ExxonMobil (83%) and COPL (17%) are planning to drill the Mesurado-1 prospect offshore Liberia in late 2016 or early 2017. In addition to recent success across the Atlantic, Mesurado-1 is partly de-risked by offset wells on block LB-12 (Carmine-Deep and Goshtern-1) and block LB-15 oil discovery (Montserrado-1). The closest offset well, Montserrado-1, drilled to 5,400m in the late Cretaceous, has helped prove a light oil source. The well encountered good-quality, water-bearing sands at the primary objective and 8m of hydrocarbon pay (light oil) at a deeper secondary objective. COPL believes the trap was breached by an erosive channel at the primary objective, and does not see a similar erosive channel at Mesurado-1. In addition, slumping features give confidence that a seal is present. In addition to Monsterrado-1, the Narina-1 discovery in January 2012 made by African Petroleum in LB-9 encountered a total of 31m of light oil pay in Cretaceous age sand reservoirs.
ExxonMobil and COPL have de-risked Mesurado-1 through the interpretation of modern 3D seismic in combination with log data from Montserrado-1. We describe two inversion techniques used by the partnership for lithology and fluid prediction below:
1.
Extended elastic impedance: a sophisticated manipulation that extends beyond the typical incident angle range for seismic data and allows better distinction between a seismic anomaly caused by lithology and one caused by fluid content. For Mesurado-1, work carried out by COPL and partners demonstrates that the LB-13 block holds a number of channel features and fans, which tie with EEI anomalies associated with lithology and fluid content.
2.
Full waveform inversion: ExxonMobil is a proponent of full waveform inversion (FWI), a technique that has been used to highlight sands potentially filled with oil in Exhibit 3. FWI is a method that optimises a subsurface model by minimising the difference between field data and simulated data, resulting in a highly resolved image of the subsurface, as shown in the exhibit below.
|
Exhibit 3: Mesurado-1 full waveform inversion and well location |
|
|
Source: COPL |
Our interpretation of pre-drill risks is outlined in Exhibit 4. We believe that the Mesurado-1 prospect has been significantly de-risked through the use of modern seismic techniques, analysis of West African and Amazonian analogues as well as offset well logs such that it is no longer high risk. DeGolyer & MacNaughton (D&M) quote a GCoS of c 23%, however there is reason to believe that this is conservative based on more recent interpretation and Guyana exploration success. In our valuation we use a GCoS of 30% (commercial CoS of 19.5%) applied to a pre-drill volume of 400mmbbl gross. Gross prospective recoverable resources on LB-13 estimated by D&M range from P90 1.8bnbbl to P10 4.2bnbbl (P50: 2.6bnbbl).
Exhibit 4: Mesurado-1 geological risks
Source |
Montserrado-1 drilled to 5,400m made a late Cretaceous oil discovery. Source rocks Cenomanian to Turonian organic rich-shales. |
Migration |
Reservoir directly above source. EEI anomalies associated with oil fluid contact. |
Trap |
Stratigraphic trap (turbidite channel) with up-dip pinch-out. No major faults. |
Seal |
Slump features seen at stratigraphic pinch-out on many channels and fans. Some similarities to slump related seals seen in Angola. Up-dip pinchout confirmed by AVO response. Shales above and below. |
Reservoir |
Santonian-aged reservoir sand targets in levee-controlled turbidite channel complexes. Lateral accretion packages (LAPs) visible on seismic. Quartz-rich turbidite sands. Pre-drill expectations are of porosity 20-30% and permeability of 100mD to over 1,300mD. |
Source |
Migration |
Trap |
Seal |
Reservoir |
Montserrado-1 drilled to 5,400m made a late Cretaceous oil discovery. Source rocks Cenomanian to Turonian organic rich-shales. |
Reservoir directly above source. EEI anomalies associated with oil fluid contact. |
Stratigraphic trap (turbidite channel) with up-dip pinch-out. No major faults. |
Slump features seen at stratigraphic pinch-out on many channels and fans. Some similarities to slump related seals seen in Angola. Up-dip pinchout confirmed by AVO response. Shales above and below. |
Santonian-aged reservoir sand targets in levee-controlled turbidite channel complexes. Lateral accretion packages (LAPs) visible on seismic. Quartz-rich turbidite sands. Pre-drill expectations are of porosity 20-30% and permeability of 100mD to over 1,300mD. |
Source: Edison Investment Research
Mesurado-1 deepwater channel complex
COPL believes that the Mesurado-1 prospect has geological similarities to Tullow’s Enyenra discovery offshore Ghana and ExxonMobil’s multi-billion barrel Dalia oil field in Angola. The bulk of Mesurado-1 prospective volume is expected to be within deepwater sinuous channels including localised thick sand packages known as lateral accretion packages (LAPs). LAPs are formed during lateral and down-dip migration of a channel where sand is deposited on the inner side of a bend (erosion occurring on the outside of the bend). These localised sand packages can be large in size and can make up a significant component of overall reservoir in prospective channel systems. These sand packages can be identified on high-resolution seismic and stacked sands targeted for exploration. The channel system being targeted at Mesurado-1 can be seen in the top maps in Exhibits 3 and 5.
|
Exhibit 5: LB-13 multiple fans vertically stacked |
|
|
Source: COPL |
ExxonMobil cost carry
COPL is carried for 17% of all costs until ExxonMobil spends US$120m gross on drilling. At current day rates, this should fund COPL through at least two exploration wells. There are a number of suitable drillships hot-stacked in West Africa (eg Seadrill West Capella and Deepsea Metro I), which should enable the deep-water well to be drilled at a fraction of 2014 costs; current spread rates should drive a dry hole cost of c US$50m to US$70m, enabling COPL to be carried through a multiple-well exploration programme. We await further details on a rig contract and Mesurado-1 spud date.
Valuation and funding
COPL’s LB-13 production sharing contract (PSC) is a public document, available through the Alberta Securities Commission. The terms of the LB-13 PSC are used to drive our LB-13 asset valuation. Key terms include a water depth based royalty, 70% oil cost recovery, sliding scale production based profit share (60% to 40%), corporation tax (currently 30%) and also state back-in rights.
Based on our valuation of a c 400mmbbl gross oil development, using unit costs comparable to West Africa analogues such as Tullow’s Jubilee, we believe economics are attractive, based on Edison’s base case long-term oil price of US$70/bbl. Gross value per barrel recovered under the contract is estimated at just over US$5/bbl.
Exhibit 6: Liberia development key assumptions
Opex (US$/bbl) |
13.3 |
Capex (US$/bbl) |
14.5 |
Prospect size (mmbbl) |
409 |
Completed well cost (US$m) |
44 |
Gross project IRR |
37% |
First oil |
2020 |
Plateau production rate (mb/d) |
110,040 |
Gross value per bbl (US$/bbl) |
5.2 |
Source: Edison Investment Research, LB-13 PSC
Our well count and production assumptions are outlined in Exhibit 7, with first oil modelled for 2020 and peak production at c 110mb/d. Our analysis suggests a post exploration and appraisal gross project IRR of 37% at US$70/bbl long-term or an NPV10 break-even oil price of US$35/bbl assuming unchanged costs. In a success case, we see a project that is likely to justify development given its relatively low break-even oil price and the potential to extend the production plateau as the play is fully explored.
|
Exhibit 7: Liberia assumed production profile and well count |
|
|
Source: Edison Investment Research |
In the current market, we see limited availability of reserve based lending (RBL) ahead of first oil and expect the most logical monetisation routes to be asset sale or farm-down. If ExxonMobil is able to open up the Santonian oil play in Liberia, we believe that COPL will have an extremely attractive acreage position with material further prospective upside as well as a best-in-class development partner in the form of operator ExxonMobil.
We remain conservative in our pre-drill risked valuation, assuming COPL farms down its equity interest for a full development carry. A farminee would need to carry COPL for up to US$300m of costs ahead of first oil under this scenario (see Exhibit 8).
|
Exhibit 8: Capex carry provided by farminee (full cost carry to first oil) versus COPL’s retained working interest |
|
|
Source: Edison Investment Research |
Our analysis suggests that a farminee would be required to acquire c 9.5% of COPL’s 17% interest (prior to state back-in) in order to provide a full cost carry as well as generate a 20% IRR. Farminee IRR increases towards our gross project IRR of 37% in the case of acquisition (at zero cost/carry).
|
Exhibit 9: Farminee IRR increases with acquired WI |
|
|
Source: Edison Investment Research |
COPL’s LB-13 risked value remains geared to the oil price (Exhibit 10) and we estimate an NPV12.5 break-even at just below US$40/bbl and NPV10 break-even at c US$35/bbl, making a success case 400mmbbl development project attractive even in the current oil price and cost environment. At a corporate level, our RENAV sensitivity to the oil price is shown below.
|
Exhibit 10: COPL RENAV sensitivity to oil price (no farm down) |
|
|
Source: Edison Investment Research |
ShoreCan: Building a sub-Saharan portfolio
COPL’s 50/50 JV with Shoreline Energy International Limited, or ShoreCan, continues to pursue upstream and gas-to-power asset acquisitions across sub-Saharan Africa. Its recent focus has been on securing ministerial approval for the acquisition of OPL 226 in Nigeria.
Nigeria
ShoreCan is currently awaiting ministerial approval of the purchase of a 100% interest in OPL 226 in Nigeria (via 80% of the issued share capital of a 100% foreign owned Nigerian company). Management expects the deal to complete imminently, granting ShoreCan access to a proven basin and licence containing an existing shallow water oil discovery (Noa-1).
Five wells have been drilled on OPL 226 by previous operators and include one oil discovery and four gas discoveries. There is thought to be significant follow-up potential to the 2001 Noa-1 oil discovery along the seismically mapped ‘footwall-trap’. COPL expects to publish a commissioned Netherland Sewell & Associates (NSAI) contingent and prospective resource report that incorporates the result of a 2013 3D seismic programme on completion of the OPL 226 deal.
We expect to include a more comprehensive analysis of OPL 226 and ShoreCan once the JV has received ministerial approval and published its revised resource report.
Equatorial Guinea
ShoreCan is in direct negotiations towards the award of a PSC for EG-018. PSC terms are currently under negotiation and final terms as well as government ratification are expected in Q416.
Namibia
ShoreCan has an 80% interest in three blocks – 1708, 1808 and 1709 – which have been ratified by the ministry of energy in Namibia. The blocks are located north of the Walvis ridge on the Namibia/Angola border. There are no current exploration plans.
Valuation and financials
We provide two valuation scenarios for COPL, firstly a valuation made on the basis of COPL farming down its LB-13 working interest in exchange for a full cost carry through to first oil. Under this scenario COPL retains a 7.5% working interest after state back-in. Our post-farm-down RENAV stands at C$0.15/share or 8.5p/share, offering substantial upside to the current share price.
Exhibit 11: COPL Scenario 1: summary valuation assuming farm-down* and cost-carry
Asset |
|
Diluted WI |
|
Recoverable reserves |
|
Net risked |
Value per share |
||
Country |
(pre back-in) |
CoS |
Gross |
Net |
NPV/boe |
value |
Risked |
Risked |
|
|
% |
% |
mmboe |
mmboe |
US$/boe** |
US$m |
C$/share |
p/share |
|
Net (debt)/cash post Q216 fund raise |
6 |
0.01 |
0.6 |
||||||
SG&A 3 years |
(11) |
(0.02) |
(1.1) |
||||||
Core NAV |
|
|
|
|
|
|
(5) |
(0.01) |
(0.5) |
Exploration (2016) |
|||||||||
Block LB-13 |
Liberia |
7.5% |
19.5% |
409 |
31 |
9.0 |
47 |
0.08 |
4.6 |
Block LB-13 |
Liberia |
7.5% |
19.5% |
400 |
30 |
9.0 |
46 |
0.08 |
4.4 |
RENAV |
|
|
|
|
|
|
88 |
0.15 |
8.5 |
Source: Edison Investment Research. Note: *Farminee 20% IRR. **Includes impact of cost-carry.
We also provide an undiluted valuation, which reflects the full NPV10 risked value of COPL’s 17% share of LB-13. This gives a company RENAV of C$0.22/share. Asset valuations close to or above NPV10 have been achieved by E&Ps in the past, often when the asset is sold to an oil major or NOC seeking strategic basin entry. An example of a strategic basin entry by an NOC would be PTTEP’s acquisition of Cove Energy’s East African asset base in 2011. PTTEP paid a significant premium to consensus NPV10 at the time of the transaction, potentially for exposure to follow-on exploration potential and to meet state-led goals of resource access.
The valuation provided in the table below is more indicative of a ‘high case’, at a 39% premium to our farm-out RENAV. Under both scenarios, we see significant upside from the current share price, however we caveat that based on COPL’s current asset base (excluding to be acquired ShoreCan assets), success or failure of the company is driven by a single exploration programme on the LB-13 licence. We await further details on the ShoreCan asset base before including it in our RENAV.
Exhibit 12: COPL Scenario 2: summary valuation
Asset |
|
Diluted WI |
|
Recoverable reserves |
|
Net risked |
Value per share |
||
Country |
(pre back-in) |
CoS |
Gross |
Net |
NPV/boe |
value |
Risked |
Risked |
|
|
% |
% |
mmboe |
mmboe |
US$/boe |
US$m |
C$/share |
p/share |
|
Net (debt)/cash post Q216 fund raise |
6 |
0.01 |
0.6 |
||||||
SG&A 3 years |
(11) |
(0.02) |
(1.1) |
||||||
Core NAV |
|
|
|
|
|
|
(5) |
(0.01) |
(0.5) |
Exploration (2016) |
|||||||||
Block LB-13 |
Liberia |
17% |
19.5% |
409 |
70 |
5.2 |
64 |
0.11 |
6.2 |
Block LB-13 |
Liberia |
17% |
19.5% |
400 |
68 |
5.2 |
63 |
0.11 |
6.1 |
RENAV |
|
|
|
|
|
|
122 |
0.22 |
11.8 |
Source: Edison Investment Research
After an equity injection of just over C$8m in Q216, COPL is funded for the remainder of 2016 and 2017 based on our SG&A forecasts. Further capital will be required for full appraisal of a discovery in Liberia and for ShoreCan’s Nigerian capital commitments, which remain contingent on deal completion.
Exhibit 13: Financial summary
|
|
US$000s |
|
2013 |
2014 |
2015 |
2016e |
2017e |
Year end 31 December |
|
|
|
IFRS |
IFRS |
IFRS |
IFRS |
IFRS |
PROFIT & LOSS |
||||||||
Revenue |
|
|
|
0 |
0 |
0 |
0 |
0 |
Cost of Sales |
0 |
0 |
0 |
0 |
0 |
|||
Gross Profit |
0 |
0 |
0 |
0 |
0 |
|||
EBITDA |
|
|
|
(9,166) |
(7,685) |
(6,505) |
(4,152) |
(4,360) |
Operating Profit (before amort. and except.) |
|
|
|
(9,225) |
(7,747) |
(6,564) |
(4,184) |
(4,379) |
Intangible Amortisation |
0 |
0 |
0 |
0 |
0 |
|||
Exceptionals |
0 |
0 |
0 |
0 |
0 |
|||
Other |
0 |
0 |
0 |
0 |
0 |
|||
Operating Profit |
(9,225) |
(7,747) |
(6,564) |
(4,184) |
(4,379) |
|||
Net Interest |
23 |
28 |
41 |
23 |
17 |
|||
Forex gains/(losses) |
729 |
1,138 |
(530) |
(46) |
0 |
|||
Derivative gain/(losses) |
0 |
27 |
1,097 |
(654) |
0 |
|||
Share in JVs/associates |
0 |
0 |
(729) |
(2) |
0 |
|||
Profit Before Tax (norm) |
|
|
|
(8,473) |
(6,581) |
(7,782) |
(4,209) |
(4,363) |
Profit Before Tax (FRS 3) |
|
|
|
(8,473) |
(6,554) |
(6,685) |
(4,863) |
(4,363) |
Tax |
0 |
0 |
0 |
0 |
0 |
|||
Profit After Tax (norm) |
(8,473) |
(6,581) |
(7,782) |
(4,209) |
(4,363) |
|||
Profit After Tax (FRS 3) |
(8,473) |
(6,554) |
(6,685) |
(4,863) |
(4,363) |
|||
|
||||||||
Average Number of Shares Outstanding (m) |
301.9 |
365.2 |
440.5 |
575.1 |
606.1 |
|||
EPS - normalised (c) |
|
|
|
(2.8) |
(2.2) |
(1.7) |
(0.7) |
(0.7) |
EPS - normalised fully diluted (c) |
|
|
|
(2.8) |
(2.2) |
(1.7) |
(0.7) |
(0.7) |
EPS - (IFRS) (c) |
|
|
|
(2.8) |
(1.8) |
(1.5) |
(0.8) |
(0.7) |
Dividend per share (c) |
0.0 |
0.0 |
0.0 |
0.0 |
0.0 |
|||
|
||||||||
Gross Margin (%) |
N/A |
N/A |
N/A |
N/A |
N/A |
|||
EBITDA Margin (%) |
N/A |
N/A |
N/A |
N/A |
N/A |
|||
Operating Margin (before GW and except.) (%) |
N/A |
N/A |
N/A |
N/A |
N/A |
|||
|
||||||||
BALANCE SHEET |
||||||||
Fixed Assets |
|
|
|
16,581 |
16,502 |
16,615 |
16,665 |
16,646 |
Intangible Assets |
16,347 |
16,305 |
16,455 |
16,537 |
16,537 |
|||
Tangible Assets |
175 |
134 |
109 |
77 |
58 |
|||
Investments |
60 |
63 |
51 |
51 |
51 |
|||
Current Assets |
|
|
|
2,580 |
5,203 |
2,383 |
4,711 |
368 |
Stocks |
0 |
0 |
0 |
0 |
0 |
|||
Debtors |
67 |
134 |
149 |
139 |
139 |
|||
Cash |
2,227 |
4,705 |
2,015 |
4,412 |
69 |
|||
Other |
286 |
364 |
219 |
160 |
160 |
|||
Current Liabilities |
|
|
|
(1,736) |
(1,437) |
(1,791) |
(2,741) |
(2,741) |
Creditors |
(1,736) |
(1,437) |
(1,791) |
(2,741) |
(2,741) |
|||
Short term borrowings |
0 |
0 |
0 |
0 |
0 |
|||
Long Term Liabilities |
|
|
|
0 |
0 |
0 |
0 |
0 |
Long term borrowings |
0 |
0 |
0 |
0 |
0 |
|||
Other long term liabilities |
0 |
0 |
0 |
0 |
0 |
|||
Net Assets |
|
|
|
17,425 |
20,268 |
17,207 |
18,635 |
14,273 |
|
||||||||
CASH FLOW |
||||||||
Operating Cash Flow |
|
|
|
(7,483) |
(7,515) |
(6,255) |
(3,850) |
(4,360) |
Net Interest |
23 |
28 |
41 |
23 |
17 |
|||
Tax |
0 |
0 |
0 |
0 |
0 |
|||
Capex |
(1,434) |
(507) |
(190) |
(82) |
0 |
|||
Acquisitions/disposals |
0 |
0 |
0 |
0 |
0 |
|||
Equity financing and convertible debt |
6,952 |
10,842 |
4,951 |
6,229 |
0 |
|||
Dividends |
0 |
0 |
0 |
0 |
0 |
|||
Other |
83 |
(384) |
(1,237) |
77 |
0 |
|||
Net Cash Flow |
(1,859) |
2,464 |
(2,690) |
2,397 |
(4,343) |
|||
Opening net debt/(cash) |
|
|
|
(4,405) |
(2,241) |
(4,705) |
(2,015) |
(4,412) |
HP finance leases initiated |
0 |
0 |
0 |
0 |
0 |
|||
Other |
(305) |
0 |
(0) |
0 |
||||
Closing net debt/(cash) |
|
|
|
(2,241) |
(4,705) |
(2,015) |
(4,412) |
(69) |
Source: Edison Investment Research, Canadian Overseas Petroleum accounts. Note: 2013 audited IFRS financials have been converted from reported currency of C$ to US$ at an average annual FX rate of US$0.934/C$. 2014 financials are for comparative purposes only and are as provided by the company in the 2015 financial report, which reflects the change in accounting policy resulting from a change in currency presentation to US$. 2015 financials are IFRS audited US$ accounts. Effective 1 January 2015 the functional currency was changed from Canadian dollar to US dollar.
|