BTG
Written by
BTG |
Varithena slows, but IO strong and Lemtrada leaps |
Close period update |
Pharma & biotech |
30 October 2015 |
ADR research
ADR share price performance
Business description
Next events
Analysts
BTG is a research client of Edison Investment Research Limited |
|||||||||||||||||||||||||||||||||||||
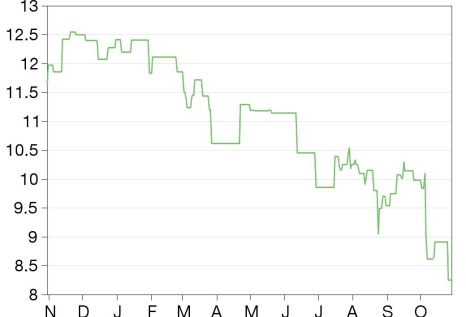
BTG’s close period update saw a revision to its FY16 revenue guidance, targeting sales in the lower half of $660-708m (at $1.61/£). This is based on slower-than-expected Varithena sales, despite a strong performance in the Interventional Oncology (IO) and EkoSonic businesses. We have made a number of changes to our forecasts, and even with a decrease to near-term Varithena sales, our FY16e total revenue has increased owing to upwards revisions to IO and a large increase in Lemtrada royalties. We continue to expect ongoing investment for the future, with our FY16e net profit largely unchanged. Our updated valuation is $5.31bn or $13.87/ADR.
Year end |
Revenue ($m) |
PTP* |
EPADR |
DPADR |
P/E |
Gross Yield |
03/14 |
450.3 |
118.7 |
0.29 |
0.0 |
28.4 |
N/A |
03/15 |
570.1 |
89.0 |
0.27 |
0.0 |
30.6 |
N/A |
03/16e |
669.6 |
125.5 |
0.30 |
0.0 |
27.5 |
N/A |
03/17e |
753.7 |
162.0 |
0.33 |
0.0 |
25.0 |
N/A |
Note: Converted at $1.55/US$. Dividend yield excludes withholding tax. Investors should consult their tax advisor regarding the application of any domestic and foreign tax laws.
Varithena delays but pick up still possible
BTG now expects broadly flat Varithena sales in FY16 ($1.55m in FY15). This is owing to claim settlement processing delays leading to lower re-ordering patterns. However, with the number of physicians with experience of Varithena (including training or active treatment), in addition to patient lives covered by payers continuing to increase, we have made no changes to our peak Varithena sales ($340m), but have delayed the near-term sales ramp.
Tough Spec Pharma comp but Lemtrada uptick
Spec Pharma has delivered >20% growth in the last two years, with DigiFab +65% in FY15, aided by restocking (three-year replacement cycle). This division is expected to revert to mid-to-high single digit growth in the future; however, with the tough comp we now expect broadly flat growth in FY16e. Helping to offset both Varithena and Spec Pharma, Lemtrada sales materially increased; Q215 already accounts for 83% of total FY15 sales so we raise our Lemtrada royalty forecasts.
Key growth driver is delivering with strong IO
There was a strong H1 performance in Interventional Oncology (IO) and EkoSonic (Interventional Vascular), which is expected to deliver >20% growth. PneumRx (Interventional Pulmonology) is in early-stage launches in a few markets, with BTG seeking broader access and wider EU reimbursement coverage to drive sales. The Interventional Medicine franchise is likely to be BTG’s key future revenue driver, with margin expansion possible beyond near-term heavy investment.
Valuation: DCF valuation of $5.31bn, $13.87/ADR
Our valuation is adjusted to $5.31bn (from $5.36bn) or $13.87/ADR. The changes to our underling valuation are a result of the forecast changes and also owing to an updated FX headwind which counteracts the revenue and profit upgrades.
Financials
Following the close period update we have made a number of revisions to our revenue forecasts, mainly:
■
Slower than expected Varithena sales: BTG now expects flat Varithena sales this year owing to slower than anticipated insurance/reimbursement processes leading to delays in physician re-ordering. We have therefore reduced Varithena sales in the near term, with our forecasts now essentially flat compared to last year. We have maintained our peak $340m sales in FY20, although we have slowed the near-term sales ramp.
■
Upgrades to Interventional Oncology and EkoSonic: BTG highlighted a strong performance in both the Interventional Oncology (TheraSphere and Beads) and the Interventional Vascular (EkoSonic) divisions, now anticipating EkoSonic growth in excess of 20%. BTG continues to expect mid-teens IO growth this year. We are more optimistic on both and have raised forecasts for this year, anticipating 21% growth for the IO franchise and nearly 30% EkoSonic growth (both at constant FX). We do also expect higher growth in future years (20% for EkoSonic and 15% for IO in FY17e) from the now increased FY16e base.
■
Flat Specialty Pharma revenues in FY16e: We have revised down both our CroFab and DigiFab estimates for FY16, now anticipating a small decline in DigiFab revenues owing to stocking last year (which helped drive +65% growth), and only limited CroFab growth. This leads to flat revenues this year, which is more conservative than BTG’s outlook for single-digit growth. We have not made any changes to our longer-term growth forecasts, which generally assume around 2% underlying growth, although these are based from the now lower FY16e base.
■
Lemtrada leaps ahead: Sanofi reported Q215 Lemtrada sales of €56m. This compares to sales of €67m in the 12 months ending March 2015 (equivalent to BTG’s FY15 reporting period) on which BTG recorded $7.9m (£4.9m at $1.61/£) of royalty income. With the jump in sales, we have substantially increased our future Lemtrada royalty income. Note that this only has an impact for the next few years as we do not expect Lemtrada royalty income beyond FY18/19e owing to patent expiry.
With all these changes, our updated total revenue forecast is $688.3m from $679.6m (at constant FX of $1.61/£) as the Lemtrada uptick (+$21.3 at $1.61/£) more than offsets the Varithena slowdown (-$18.7m at $1.61/£) in addition to the IO and EkoSonic upgrades. This equates to 16% revenue growth (at constant FX). This is now slightly ahead of BTG’s refined revenue guidance. With an updated FX of $1.55/£ this leads to our new total revenue forecast of $669.6m (from $667.9m, which was based on $1.50/£). A summary of the changes to our revenue forecasts are shown in Exhibit 1.
Exhibit 1: Summary of changes to revenue forecasts
$m |
FY15 |
FY16e |
FY17e |
||
Old |
New |
Old |
New |
||
Specialty Pharma |
187.7 |
197.0 |
188.9 |
207.4 |
198.9 |
Interventional Medicine |
174.7 |
254.4 |
243.7 |
348.3 |
346.8 |
Licensing |
207.7 |
216.5 |
237.0 |
181.6 |
208.0 |
Total Revenues |
570.1 |
667.9 |
669.6 |
737.3 |
753.7 |
Source: BTG accounts, Edison Investment Research. Note that both our old and new forecasts are convenience translations using our underlying GBP based forecasts, converted at current FX of $1.55/£.
Although there is a slight boost to revenues in FY16e, the changed product mix results in a slightly lower gross margin (as BTG pays away around 50% of licensing revenues versus higher gross margins on Specialty Pharma and Interventional Medicine). We also expect continued investment to drive innovation and to accelerate newly-launched commercial products. Specifically, we have raised both our R&D and our SG&A forecasts in FY16e, owing to spend on ongoing and new trials (including the PneumRx coils RENEW study and the OPTALYSE EkoSonic trial) in addition to expanding commercial activities for TheraSphere in Europe, to support the Canadian TheraSphere approval, securing reimbursement across Europe for PneumRx plus potential additional spend to try and accelerate Varithena processes.
With a slightly lower gross margin in addition to raised R&D and SG&A, we now forecast an underlying operating profit (which excludes acquisition adjustments and reorganisation costs) of $108.3m equivalent to a 16% margin (from $122.9m and a margin of 18%). However, we do now believe that BTG’s tax burden in FY16e could be reduced owing to utilisation of tax loss carryforwards and we have halved tax; this is complicated to predict with any accuracy and we expect further insights with interim results on 10 November. This leads to a largely unchanged net profit. A summary of the main changes to our forecasts are shown in Exhibit 2.
Exhibit 2: Summary of the main changes to our BTG financial forecasts
$m |
FY15 |
FY16e |
FY17e |
||
Old |
New |
Old |
New |
||
Revenue |
570.1 |
667.9 |
669.6 |
737.3 |
753.7 |
COGS |
(177.8) |
(200.2) |
(206.0) |
(215.1) |
(225.8) |
Gross profit |
392.3 |
467.8 |
463.7 |
522.2 |
527.9 |
Gross margin |
69% |
70% |
69% |
71% |
70% |
R&D |
(105.9) |
(120.2) |
(122.8) |
(130.7) |
(130.5) |
SG&A |
(193.4) |
(224.6) |
(232.5) |
(252.2) |
(256.5) |
Operating profit (reported) |
54.1 |
71.8 |
55.6 |
80.5 |
82.0 |
Operating profit (normalised) |
101.7 |
131.6 |
117.0 |
148.0 |
149.6 |
Operating profit (underlying) |
105.2 |
122.9 |
108.3 |
139.4 |
140.9 |
Net Income (reported) |
52.1 |
65.8 |
57.7 |
71.5 |
72.7 |
Net Income (normalised) |
99.7 |
114.9 |
113.0 |
123.5 |
124.8 |
Basic EPADR |
0.14 |
0.17 |
0.15 |
0.19 |
0.19 |
Normalised EPADR |
0.27 |
0.30 |
0.30 |
0.32 |
0.33 |
Source: BTG accounts, Edison Investment Research. Note: Normalised numbers exclude amortisation, exceptional items (such as FX gains, profits on disposals) and share-based payments; Underlying is as per BTG’s definition, which excludes acquisition related and reorganisation costs. Note that both our old and new forecasts are convenience translations using our underlying GBP based forecasts, converted at current FX of $1.55/£.
Valuation
As a result of the changes to our model, our valuation is adjusted to $5.31bn (from $5.36bn) or $13.87/ADR (with a higher underlying share count). Within the changes to our underling valuation, this is predominantly owing to updated FX, providing a headwind (from $1.50/£1 to $1.55/£), which is not fully offset by upgrades to IO, EkoSonic and Lemtrada. Our updated valuation is shown in Exhibit 3.
The main upside to our valuation comes from BTG being able to deliver on its target of IM sales of >$1.25bn in FY21. We estimate that the division will generate sales of c. $930m in FY21, with the main difference between our forecasts and BTG’s target being with Varithena ($330m vs >$500m), as we have conservatively excluded the product’s potential in the cosmetic, non-reimbursed US market and in other geographies. If Varithena can achieve peak sales of $500m, our valuation would be $6.3bn ($16.46/ADR), all else being equal.
Exhibit 3: Summary of sum-of-the-parts DCF valuation of BTG
Product |
DCF ($m) |
Partner |
Indication |
Peak sales/ Royalty ($m) |
Probability of success |
Specialty Pharma (SP) |
604 |
|
|||
CroFab |
- |
Snake anti-venom |
104 |
100% |
|
DigiFab |
- |
Digoxin tocixity |
71 |
100% |
|
Voraxaze |
- |
Methotrexate toxicity |
32 |
100% |
|
Uridine triacetate |
Wellstat |
5-FU toxicity |
44 |
60% |
|
Interventional Medicine (IM) |
1,950 |
|
|||
DC/LC Bead |
Distributors ex-US & EU |
Liver tumours |
119 |
100% |
|
PRECISION Bead |
- |
Intermediate HCC (Asia) |
23 |
60% |
|
PARAGON bead |
- |
Third-line mCRC |
35 |
60% |
|
TheraSphere |
Distributors ex-US & EU |
Advanced HCC, Second-line mCRC |
201 |
100% / 60%* |
|
EkoSonic |
Distributors ex-US |
Severe blood clots |
157 |
100% |
|
RePneumRx |
Distributors ex-US |
Emphysema |
196 |
100% |
|
Varithena |
- |
Varicose veins - US reimbursed |
340 |
100% |
|
Licensing (LG) |
136 |
|
|||
Zytiga |
J&J |
Prostate cancer |
171 |
100% |
|
Lemtrada |
Sanofi/Genzyme |
Multiple sclerosis |
36 |
100% (EU & US) |
|
Two-part hip cup |
Various |
Hip replacement |
23 |
100% |
|
Other recurring |
Various |
- |
17 |
100% |
|
Total DCF |
2,689 |
|
|||
Terminal value |
3,250 |
|
|||
R&D |
(668) |
|
|||
Capex |
(76) |
|
|||
Net cash |
114 |
|
|||
Total value ($m) |
5,309 |
|
|||
Value per ADR ($) |
13.87 |
|
|
|
|
Source: Edison Investment Research
Exhibit 4: Financial summary
$m |
2013 |
2014 |
2015 |
2016e |
2017e |
2018e |
||
Year end 31 March |
IFRS |
IFRS |
IFRS |
IFRS |
IFRS |
IFRS |
||
PROFIT & LOSS |
||||||||
Revenue |
|
|
362.2 |
450.3 |
570.1 |
669.6 |
753.7 |
828.7 |
COGS/revenue sharing |
(104.2) |
(147.3) |
(177.8) |
(206.0) |
(225.8) |
(231.0) |
||
Gross profit |
258.0 |
303.0 |
392.3 |
463.7 |
527.9 |
597.7 |
||
R&D expenses |
(63.9) |
(73.2) |
(105.9) |
(122.8) |
(130.5) |
(135.8) |
||
SG&A expenses |
(89.9) |
(130.2) |
(193.4) |
(232.5) |
(256.5) |
(296.7) |
||
EBITDA |
|
|
116.4 |
114.7 |
110.2 |
125.5 |
162.0 |
186.3 |
Operating Profit (norm) |
111.6 |
109.4 |
101.7 |
117.0 |
149.6 |
173.9 |
||
Operating Profit (BTG underlying) |
106.9 |
96.5 |
105.2 |
108.3 |
140.9 |
165.2 |
||
Amortisation and impairment |
(67.3) |
(37.7) |
(44.0) |
(52.7) |
(58.9) |
(58.9) |
||
Profit on disposals |
0.6 |
1.7 |
0.5 |
0.0 |
0.0 |
0.0 |
||
Write-offs |
(2.8) |
0.0 |
0.0 |
0.0 |
0.0 |
0.0 |
||
Restructuring costs |
5.0 |
(22.9) |
4.7 |
0.0 |
0.0 |
0.0 |
||
Share based payments |
(7.3) |
(8.2) |
(8.7) |
(8.7) |
(8.7) |
(8.7) |
||
Operating Profit |
|
39.8 |
42.3 |
54.1 |
55.6 |
82.0 |
106.3 |
|
Net Interest |
(2.5) |
9.3 |
(12.7) |
8.5 |
12.4 |
18.6 |
||
Pre-tax profit (norm) |
109.1 |
118.7 |
89.0 |
125.5 |
162.0 |
192.5 |
||
Pre-tax profit (reported) |
37.3 |
51.6 |
41.4 |
64.1 |
94.4 |
124.9 |
||
Tax |
(11.9) |
(14.0) |
10.7 |
(6.4) |
(21.7) |
(32.5) |
||
Profit After Tax (norm) |
0.0 |
0.0 |
0.0 |
0.0 |
0.0 |
0.0 |
||
Profit After Tax (reported) |
0.0 |
0.0 |
0.0 |
0.0 |
0.0 |
0.0 |
||
Average Number of ADRs Outstanding (m) |
326.9 |
355.2 |
367.9 |
382.3 |
382.9 |
382.9 |
||
EPADR - reported ($) |
0.08 |
0.11 |
0.14 |
0.15 |
0.19 |
0.24 |
||
EPADR - normalised ($) |
0.30 |
0.29 |
0.27 |
0.30 |
0.33 |
0.37 |
||
Dividend per ADR ($) |
0.0 |
0.0 |
0.0 |
0.0 |
0.0 |
0.0 |
||
Gross Margin (%) |
71.2 |
67.3 |
68.8 |
69.2 |
70.0 |
72.1 |
||
EBITDA Margin (%) |
32.1 |
25.5 |
19.3 |
18.7 |
21.5 |
22.5 |
||
Operating Margin (before GW and except.) (%) |
30.8 |
24.3 |
17.8 |
17.5 |
19.9 |
21.0 |
||
BALANCE SHEET |
||||||||
Fixed assets |
|
477.4 |
876.5 |
1,299.4 |
1,254.3 |
1,199.1 |
1,143.9 |
|
Intangible assets |
324.3 |
616.7 |
926.7 |
876.2 |
819.5 |
762.8 |
||
Goodwill |
91.8 |
191.6 |
284.9 |
284.9 |
284.9 |
284.9 |
||
Tangible assets |
39.4 |
48.5 |
55.0 |
60.5 |
62.0 |
63.6 |
||
Investment in associates |
22.0 |
19.7 |
32.7 |
32.7 |
32.7 |
32.7 |
||
Current assets |
|
367.2 |
226.6 |
321.8 |
422.8 |
533.3 |
623.8 |
|
Stocks |
36.1 |
41.9 |
62.8 |
64.9 |
81.9 |
104.6 |
||
Debtors |
84.5 |
116.4 |
142.4 |
154.0 |
173.3 |
190.6 |
||
Cash |
245.9 |
59.2 |
114.4 |
201.7 |
275.9 |
326.5 |
||
Other |
0.6 |
9.1 |
2.2 |
2.2 |
2.2 |
2.2 |
||
Current liabilities |
|
(101.7) |
(136.1) |
(179.2) |
(174.5) |
(195.6) |
(214.3) |
|
Creditors |
(95.5) |
(123.8) |
(172.1) |
(167.4) |
(188.4) |
(207.2) |
||
Accruals/deferred income |
0.0 |
0.0 |
0.0 |
0.0 |
0.0 |
0.0 |
||
Employees/provs/tax |
(2.8) |
(12.2) |
(5.7) |
(5.7) |
(5.7) |
(5.7) |
||
Derivative instruments |
(3.4) |
0.0 |
(1.4) |
(1.4) |
(1.4) |
(1.4) |
||
Short-term borrowings |
0.0 |
0.0 |
0.0 |
0.0 |
0.0 |
0.0 |
||
Long-term liabilities |
|
(69.3) |
(144.9) |
(266.1) |
(266.1) |
(266.1) |
(266.1) |
|
Long-term borrowings |
0.0 |
0.0 |
0.0 |
0.0 |
0.0 |
0.0 |
||
Other long-term liabilities |
(69.3) |
(4.0) |
(27.7) |
(27.7) |
(27.7) |
(27.7) |
||
Net assets |
|
673.6 |
822.1 |
1,175.8 |
1,236.4 |
1,270.7 |
1,287.3 |
|
CASH FLOW |
||||||||
Operating cash flow |
|
94.5 |
86.0 |
97.2 |
111.4 |
99.6 |
122.4 |
|
Net interest |
1.1 |
0.3 |
(0.2) |
8.5 |
12.4 |
18.6 |
||
Tax |
(8.5) |
(10.9) |
(23.6) |
(6.4) |
(21.7) |
(32.5) |
||
Acquisition/disposal of intangibles |
(4.0) |
3.6 |
(2.0) |
(2.2) |
(2.2) |
(2.2) |
||
Capital expenditure |
(11.8) |
(18.0) |
(15.2) |
(14.0) |
(14.0) |
(14.0) |
||
Acquisitions/disposals |
0.0 |
(403.5) |
(228.9) |
0.0 |
0.0 |
(41.9) |
||
Financing |
0.0 |
159.2 |
228.2 |
0.0 |
0.0 |
0.0 |
||
Dividends |
0.0 |
0.0 |
0.0 |
0.0 |
0.0 |
0.0 |
||
Other |
0.5 |
(3.6) |
(0.3) |
(10.0) |
0.0 |
0.0 |
||
Net cash flow |
71.7 |
(186.8) |
55.2 |
87.4 |
74.2 |
50.6 |
||
Opening net debt/(cash) |
(174.2) |
(245.9) |
(59.2) |
(114.4) |
(201.7) |
(275.9) |
||
HP finance leases initiated |
0.0 |
0.0 |
0.0 |
0.0 |
0.0 |
0.0 |
||
Other |
0.0 |
0.0 |
0.0 |
0.0 |
0.0 |
0.0 |
||
Closing net debt/(cash) |
(246.0) |
(59.1) |
(114.4) |
(201.7) |
(275.9) |
(326.5) |
||
Source: Edison Investment Research, company accounts. Note: Solely for the convenience of the reader the financial summary table has been converted at a rate of US$1.55/£. BTG reports statutory accounts in pounds. These translations should not be considered representations that any such amounts have been or could be converted into US dollars at the assumed conversion rate.
|
Research: Investment Companies
BlackRock Latin American IT