7digital’s interims show good progress in developing its B2B offering, with revenues up by 52% on H117 (including acquisitions). This reflects strong demand from brands for music as an adjunct to other products and services, as a differentiator and in order to improve brand loyalty. With an expanding portfolio of commercial content and the brand relationships, 7digital is well placed to exploit its independence and build a sizeable business. With management reiterating its expectations of the group moving into profit in H218, our revenue and EBTIDA forecasts are unchanged. We expect EBITDA to move ahead strongly in FY19e, given growing revenues on a lower fixed cost base. This puts the shares on a rating well below software peers, currently valued on a P/E of 21.6x.
7digital Group |
Broadening the base |
Interim results |
Media |
1 October 2018 |
Share price performance
Business description
Next events
Analysts
7digital Group is a research client of Edison Investment Research Limited |
|||||||||||||||||||||||||||||||||||||||||||||||||
7digital’s interims show good progress in developing its B2B offering, with revenues up by 52% on H117 (including acquisitions). This reflects strong demand from brands for music as an adjunct to other products and services, as a differentiator and in order to improve brand loyalty. With an expanding portfolio of commercial content and the brand relationships, 7digital is well placed to exploit its independence and build a sizeable business. With management reiterating its expectations of the group moving into profit in H218, our revenue and EBTIDA forecasts are unchanged. We expect EBITDA to move ahead strongly in FY19e, given growing revenues on a lower fixed cost base. This puts the shares on a rating well below software peers, currently valued on a P/E of 21.6x.
Year end |
Revenue (£m) |
EBITDA (£m) |
PBT* |
EPS* |
DPS |
EV/ EBITDA |
P/E |
12/16^^ |
11.2 |
(4.3) |
(5.6) |
(4.9) |
0.0 |
N/A |
N/A |
12/17^^ |
16.8 |
(1.6) |
(3.8) |
(2.3) |
0.0 |
N/A |
N/A |
12/18e |
21.8 |
2.4 |
(1.0) |
(0.2) |
0.0 |
7.2 |
N/A |
12/19e |
26.5 |
6.5 |
3.0 |
0.7 |
0.0 |
2.7 |
6.4 |
Note: *PBT and EPS are normalised, excluding amortisation of acquired intangibles, exceptional items and share-based payments. ^^restated.
Good momentum in demand
Interim figures show top line growth of 52% over H117, bolstered by acquisitions in 2017. Licensing revenues (typically generating over 90% gross margin) accounted for 65% of H118 group total and were up 49%. Over 70% of the licensing revenue was generated on a monthly recurring (MRR) basis, as opposed to set-up fees, with MRR up 36% year-on-year. Commercial appetites for using music to enhance the consumer offering continue to grow and broaden, and sales momentum for 7digital’s licensing is positive. The customer range is widening, from PEEX in live music enhancements through to a ‘global provider of music to the retail and hospitality industries,’ to Triller, the AI-powered music video platform. The group is also rolling-out MediaMarktSaturn’s ‘Juke’ digital music service to more countries. Increasing penetration of connected devices in and out of the home provides a further growth strand to the positive backdrop.
Improving margin trend
Much of management’s efforts have recently been focused on the integration of the three platforms (two from companies acquired in 2017). This has been an extensive project that has required expert technical resource. Once complete, scheduled for October 2018, management anticipates that group costs will reduce by £5m annualised, bolstering our modelled EBITDA margin improvement.
Valuation: Waiting for move into profit
On a FY19e P/E of 6.4x, 7digital trades at a considerable discount to software peers (UK sector, excluding outliers, on 21.6x). With a strong trading backdrop and improving margins, confirmation that the group is indeed moving into profit and is turning cash flow positive should start to close the valuation gap.
Momentum building
Progress across segments
Exhibit 1: Summary H118 figures
£'000s |
Revenue |
% change |
Operating profit/loss |
% change |
Operating margin H118 |
Operating margin H117 |
|||
MRR |
4,323 |
36% |
|||||||
Set-up fees |
1,702 |
101% |
|||||||
Licensing |
6,025 |
49% |
5,908 |
68% |
98.1% |
87.4% |
|||
Content |
2,057 |
84% |
34 |
10% |
1.7% |
2.8% |
|||
Production |
1,257 |
28% |
632 |
16% |
50.3% |
55.6% |
|||
Central costs |
(9,410) |
43% |
|||||||
Total |
9,339 |
52% |
(2,836) |
14% |
-30.4% |
-40.6% |
|||
Other income |
243 |
-18% |
|||||||
Operating loss |
(2,593) |
11% |
-27.8% |
-38.2% |
|||||
Amortisation of intangible assets |
1,689 |
269% |
|||||||
Depreciation |
80 |
-55% |
|||||||
Share-based payments |
30 |
||||||||
EBITDA |
(794) |
-51% |
|||||||
Source: Company accounts
Forecast adjustments
While our revenue and EBITDA forecasts are unchanged, we have made an upwards adjustment to our expected amortisation charge to reflect the capital spending on the platform integration project. This has reduced our forecast PBT for FY18e breakeven to a loss of £1.1m; for FY19e a reduction from £3.4m to £3.0m.
Cash at the half year end was £0.7m. The short-term funding requirement to meet restructuring payments is to be met by loans from two of the group’s largest shareholders. With management indicating a strong rebound in operating profit in H218, the cash position should also strengthen, albeit that this is likely to be weighted to Q418. We have built a little more caution on this front, with our modelling suggesting an operating cash outflow for the year of around £0.9m, with a swing to operating cash flow positive for FY19e predicated on the stronger move into profit.
|
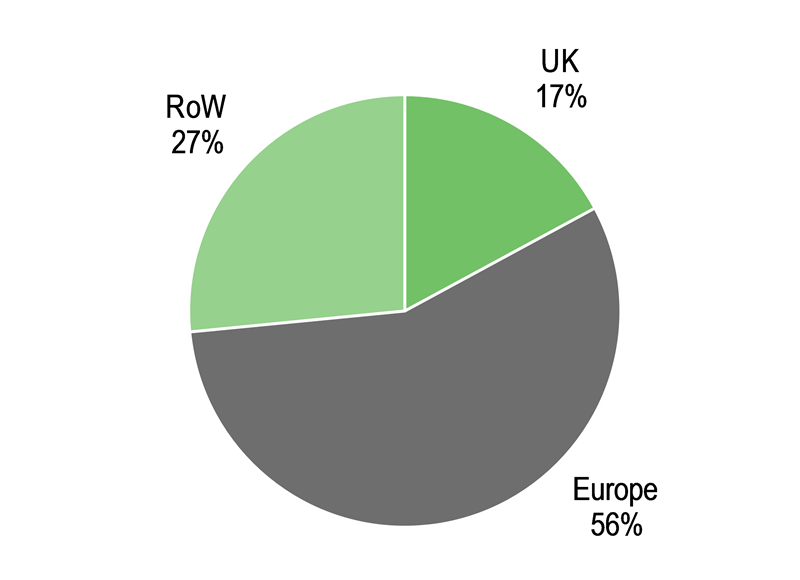
Exhibit 2: Geographic split of H118 revenues |
Exhibit 3: Activity split of H118 revenues |
|
|
|
Source: Company accounts |
|
Exhibit 2: Geographic split of H118 revenues |
|
|
Source: Company accounts |
|
Exhibit 3: Activity split of H118 revenues |
|
|
Source: Company accounts |
In order to achieve our revenue and EBITDA forecasts for the full year, the turnaround in H218 is relatively demanding, requiring revenue of £12.4m and EBITDA of £3.2m. The combination of the new business momentum and the cost reductions, which should start to take hold in Q418, nevertheless makes this outcome achievable in our view. On a full year basis, management is indicating overhead savings of £5m, consisting of £2m in staff costs and £3m platform/other overhead savings.
Increasing internationalisation
There has been a substantial shift in the regional breakdown of revenues, largely reflecting the acquisition of 24-7 from MediaMarktSaturn (MMS) in May 2017. As part of this transaction, 7digital not only acquired 24-7’s roster of clients (the largest of which are Juke and Danish telco TDC), but also agreed the additional project work for MMS. Juke has been launched in Germany and the Netherlands and Spain is set to follow over the next few months. MMS’s ambition is to expand this service to 15 countries. In H117, the UK was the largest region, at 43%, with Europe accounting for another 18%. Lower UK revenues, the acquisition and new business won have dramatically altered the profile, shown in Exhibit 1 above.
With the broadening out of the range of customers across the retail, telecoms, automotive, broadcast radio, and connected devices, amongst others, the addressable market is expanding and is not restricted to any limited geography. With its platform-based solutions and relatively fixed cost-base, and its relationships with the music industry majors, 7digital should be able to continue to grow its revenues strongly and benefit from increasing operating margins.
Content and Creative also in growth mode
Exhibit 3 shows the split of revenue by activity, MRR and set-up fees combined comprising Licensing. Historically, we had assumed this revenue stream atrophying as digital music downloads decrease (and streaming increases). However, this assumption did not take into account the growth in sales of Hi-Res audio, which now accounts for over £1m of revenue.
Creative is winning projects from a broader set of customers across audio and video, including one for a major music label producing video content.
Valuation: Substantial discount to streaming peers
Exhibit 4: Music and video streaming peers
Name |
Market cap (m) |
Sales growth 1FY (%) |
Sales growth 2FY (%) |
EBITDA margin 1FY (%) |
EBITDA margin 2FY (%) |
EV/Sales 1FY (x) |
EV/Sales 2FY (x) |
EV/EBITDA 1FY (x) |
EV/EBITDA 2FY (x) |
P/E 1FY (x) |
P/E 2FY (x) |
7 DIGITAL GROUP |
17.9 |
29.5 |
21.8 |
11.0 |
24.5 |
0.5 |
0.4 |
4.5 |
1.7 |
(16.1) |
6.7 |
PANDORA MEDIA |
2,438.4 |
5.7 |
12.5 |
(7.2) |
(1.1) |
1.8 |
1.6 |
(24.6) |
(144.3) |
(15.6) |
(27.9) |
SIRIUS XM HOLDINGS |
28,053.7 |
6.2 |
5.9 |
37.9 |
38.7 |
6.0 |
5.6 |
15.7 |
14.5 |
25.4 |
22.5 |
BRIGHTCOVE |
298.1 |
7.5 |
8.1 |
1.3 |
4.7 |
1.6 |
1.5 |
124.7 |
31.4 |
(96.5) |
78.3 |
LIMELIGHT NETWORKS |
594.7 |
10.0 |
9.9 |
18.1 |
20.3 |
2.7 |
2.5 |
14.9 |
12.1 |
35.1 |
25.0 |
QUMU CORP |
25.7 |
(10.4) |
8.9 |
(13.7) |
(3.0) |
1.1 |
1.0 |
(8.3) |
(34.5) |
(3.8) |
(8.2) |
ZIX CORP |
299.0 |
6.4 |
6.4 |
27.9 |
32.7 |
4.0 |
3.8 |
14.4 |
11.6 |
17.8 |
15.8 |
TIVO CORP |
1,605.9 |
(14.9) |
0.1 |
28.6 |
33.5 |
3.2 |
3.2 |
11.0 |
9.4 |
11.9 |
10.2 |
SEACHANGE INTERNATIONAL |
64.3 |
(13.2) |
5.1 |
(5.3) |
6.9 |
0.4 |
0.4 |
(8.2) |
6.0 |
(10.1) |
22.4 |
HARMONIC |
468.9 |
12.1 |
11.6 |
8.1 |
10.0 |
1.3 |
1.2 |
16.3 |
11.9 |
56.7 |
25.0 |
Average - video streaming |
N/A |
7.2 |
20.7 |
17.5 |
2.1 |
1.9 |
14.1 |
14.1 |
21.6 |
19.0 |
Source: Edison Investment Research, Bloomberg. Note: Prices as at 26 September 2018.
Our peer set consists of music discovery and video streaming quoted companies globally. Subscription radio company Sirius XM has recently bid for Pandora (a music streaming and discovery company, with areas of direct comparison with 7digital’s business) at $10.14/share. The table above shows multiples calculated on the then current share price of $9.01, implying that 7digital is trading on an even greater discount, despite its imminent expected move into profit. It should be noted, however, that there is a considerable discrepancy in scale between the two businesses.
Exhibit 5: Financial summary
£'k |
2015 |
2016 |
2017 |
2018e |
2019e |
||
31-December |
IFRS |
IFRS |
IFRS |
IFRS |
IFRS |
||
INCOME STATEMENT |
|||||||
Revenue |
|
|
10,392 |
11,216 |
16,801 |
21,750 |
26,500 |
Cost of Sales |
(3,308) |
(3,446) |
(4,766) |
(5,821) |
(5,812) |
||
Gross Profit |
7,084 |
7,770 |
12,035 |
15,929 |
20,688 |
||
EBITDA |
|
|
(2,102) |
(4,310) |
(1,608) |
2,400 |
6,500 |
Normalised operating profit |
|
|
(2,862) |
(5,603) |
(3,761) |
(1,000) |
3,000 |
Amortisation of acquired intangibles |
0 |
0 |
0 |
0 |
0 |
||
Exceptionals / FX |
(128) |
313 |
(1,124) |
(1,100) |
0 |
||
Share-based payments |
(137) |
(172) |
(86) |
(60) |
0 |
||
Reported operating profit |
(3,127) |
(5,462) |
(4,971) |
(2,160) |
3,000 |
||
Net Interest |
11 |
(13) |
(55) |
25 |
2 |
||
Joint ventures & associates (post tax) |
0 |
0 |
0 |
0 |
0 |
||
Exceptionals |
(4,767) |
0 |
0 |
(0) |
0 |
||
Profit Before Tax (norm) |
|
|
(7,618) |
(5,616) |
(3,816) |
(975) |
3,003 |
Profit Before Tax (reported) |
|
|
(7,883) |
(5,475) |
(5,026) |
(2,135) |
3,003 |
Reported tax |
(3) |
(12) |
380 |
0 |
(300) |
||
Profit After Tax (norm) |
(7,621) |
(5,628) |
(3,816) |
(975) |
2,702 |
||
Profit After Tax (reported) |
(7,886) |
(5,487) |
(4,646) |
(2,135) |
2,702 |
||
Minority interests |
0 |
0 |
0 |
0 |
0 |
||
Discontinued operations |
0 |
0 |
0 |
0 |
0 |
||
Net income (normalised) |
(7,621) |
(5,628) |
(3,816) |
(975) |
2,702 |
||
Net income (reported) |
(7,886) |
(5,487) |
(4,646) |
(2,135) |
2,702 |
||
Average Number of Shares Outstanding (m) |
108 |
114 |
170 |
399 |
399 |
||
EPS - normalised (p) |
|
|
(7.1) |
(4.9) |
(2.3) |
(0.2) |
0.7 |
EPS - diluted normalised (p) |
|
|
(7.1) |
(4.9) |
(2.3) |
(0.2) |
0.7 |
EPS - basic reported (p) |
|
|
(7.3) |
(4.8) |
(2.7) |
(0.5) |
0.7 |
Dividend (p) |
0.00 |
0.00 |
0.00 |
0.00 |
0.00 |
||
Revenue growth (%) |
1.8 |
7.9 |
49.8 |
29.5 |
21.8 |
||
Gross Margin (%) |
68.2 |
69.3 |
71.6 |
73.2 |
78.1 |
||
EBITDA Margin (%) |
N/A |
N/A |
N/A |
11.0 |
24.5 |
||
Normalised Operating Margin |
N/A |
N/A |
N/A |
-4.6 |
11.3 |
||
BALANCE SHEET |
|||||||
Fixed Assets |
|
|
1,127 |
2,676 |
6,481 |
8,137 |
8,137 |
Intangible Assets |
423 |
2,201 |
6,157 |
7,813 |
7,813 |
||
Tangible Assets |
704 |
475 |
324 |
324 |
324 |
||
Investments & other |
0 |
0 |
0 |
0 |
0 |
||
Current Assets |
|
|
6,212 |
4,664 |
13,980 |
8,491 |
10,131 |
Stocks |
0 |
0 |
0 |
0 |
0 |
||
Debtors |
4,556 |
3,826 |
7,002 |
7,866 |
7,841 |
||
Cash & cash equivalents |
1,656 |
838 |
6,978 |
625 |
2,289 |
||
Other |
0 |
0 |
0 |
0 |
0 |
||
Current Liabilities |
|
|
(3,201) |
(6,223) |
(11,951) |
(10,636) |
(9,349) |
Creditors |
(3,031) |
(6,080) |
(11,917) |
(10,602) |
(9,315) |
||
Tax and social security |
0 |
0 |
0 |
0 |
0 |
||
Short term borrowings |
0 |
0 |
0 |
0 |
0 |
||
Other |
(170) |
(143) |
(34) |
(34) |
(34) |
||
Long Term Liabilities |
|
|
0 |
(2,057) |
(2,078) |
(2,078) |
(878) |
Long term borrowings |
0 |
0 |
0 |
0 |
0 |
||
Other long term liabilities |
0 |
(2,057) |
(2,078) |
(2,078) |
(878) |
||
Net Assets |
|
|
4,138 |
(940) |
6,432 |
3,913 |
8,041 |
Minority interests |
0 |
0 |
0 |
0 |
0 |
||
Shareholders' equity |
|
|
4,138 |
(940) |
6,432 |
3,913 |
8,041 |
CASH FLOW |
|||||||
Op Cash Flow before WC and tax |
(2,102) |
(4,310) |
(1,608) |
2,400 |
6,500 |
||
Working capital |
(2,439) |
3,400 |
2,188 |
(2,178) |
(1,263) |
||
Exceptional & other |
(150) |
(465) |
(676) |
(1,100) |
0 |
||
Tax |
(3) |
(12) |
294 |
0 |
(75) |
||
Operating cash flow |
|
|
(4,694) |
(1,387) |
198 |
(878) |
5,162 |
Capex |
(848) |
(447) |
(4,881) |
(5,500) |
(3,500) |
||
Acquisitions/disposals |
1,828 |
109 |
297 |
0 |
0 |
||
Net interest |
11 |
(7) |
55 |
25 |
2 |
||
Equity financing |
0 |
0 |
10,694 |
0 |
0 |
||
Dividends |
0 |
(1) |
0 |
0 |
0 |
||
Other |
0 |
(4) |
135 |
0 |
0 |
||
Net Cash Flow |
(3,703) |
(1,737) |
6,498 |
(6,353) |
1,665 |
||
Opening net debt/(cash) |
|
|
(5,312) |
(1,656) |
(838) |
(6,978) |
(625) |
FX |
48 |
919 |
(358) |
0 |
0 |
||
Other non-cash movements |
0 |
0 |
0 |
0 |
0 |
||
Closing net debt/(cash) |
|
|
(1,656) |
(838) |
(6,978) |
(625) |
(2,289) |
Source: Company accounts, Edison Investment Research
|
|
Destiny Pharma’s H118 financial results were less about the numbers and more about the preparation for XF-73’s US Phase IIb study in the prevention of post-surgical infections. Destiny’s operating loss was £2.7m, largely due to the build-up to the US Phase IIb study, which is expected to continue into FY19. The net loss was £2.3m. Cash at the end of H118 was £15.1m, which we estimate provides a runway through to 2020.