Brady — Update 16 December 2015

Brady — Update 16 December 2015

Brady

Analyst avatar placeholder

Written by

Brady

Contract deferrals

Trading update

Software & comp services

17 December 2015

Price

49p

Market cap

£41m

Net cash (£m) at 30 June

6.2

Shares in issue

83.0m

Free float

77.8%

Code

BRY

Primary exchange

AIM

Secondary exchange

N/A

Share price performance

%

1m

3m

12m

Abs

(40.1)

(46.7)

(28.8)

Rel (local)

(39.5)

(45.5)

(27.6)

52-week high/low

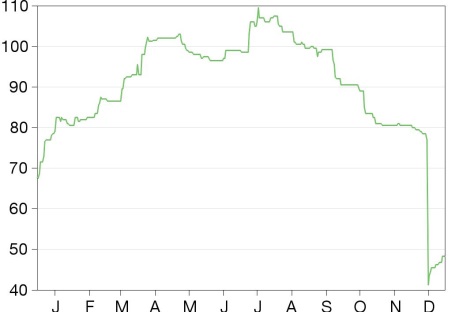
109.5p

41.2p

Business description

Brady is the largest Europe-based E/CTRM player. It provides a range of transaction and risk management software applications, which help producers, consumers, financial institutions and trading companies manage their commodity transactions in a single, integrated solution.

Next events

Trading update

January 2016

Final results

March 2016

Analysts

Richard Jeans

+44 (0)20 3077 5700

Dan Ridsdale

+44 (0)20 3077 5729

Brady is a research client of Edison Investment Research Limited

In its recent update, Brady said that it was seeing a lengthening of sales cycles, due to a deterioration of market conditions in the commodity sector. Consequently, FY15 revenues and EBITDA will be materially below market expectations. While volatile commodity prices can help to drive software sales, the commodity selloff has been persistent and severe as to force restructurings across the commodity trading sphere, and hence players are deferring deals and conserving cash. Nevertheless, Brady says the deals have been deferred rather than cancelled, and as participants require modern software for their business processes, a bounce back in FY16 with a stabilising commodity sector looks fair in our view.

Year
end

Revenue (£m)

PBT*
(£m)

EPS*
(p)

DPS
(p)

P/E
(x)

Yield
(%)

12/13

29.4

2.5

2.8

1.7

17.6

3.5

12/14

31.0

5.1

5.3

1.9

9.2

3.8

12/15e

27.4

0.9

1.0

2.0

49.0

4.0

12/16e

29.0

3.4

3.3

2.1

14.8

4.3

Note: *PBT and EPS are normalised, excluding amortisation of acquired intangibles, exceptional items and share-based payments.

Trading update: Deals deferred, not cancelled

While Brady had c 17 deals in its pipeline at the time of its H1 results in September, only seven have converted into sales. This includes several attractive cloud deals, which will add to the group’s c 55% recurring revenue run rate. The main fallbacks are in the Commodity division where commodity traders, which represent around a half of the group’s target market, have been struggling due to the extremely weak commodity prices. The Recycling unit has also suffered – Sims Metal Management (ASX:SGM), the world’s largest recycling company, released a profits warning in early November due to a sharp deterioration in market conditions. Following Brady’s H1 results, we reported that Sims had selected Brady to further support managing its global recycling operations, with a roll-out beginning in Australia. We understand this roll-out has been deferred into FY16. While the Norway-based Energy business has been making progress, the NOK has fallen c 10% against the pound this year, and is down by a third from its peak in 2012.

Forecasts: Conservatively cut in both FY15 and FY16

Brady has said it will cut its costs by £1.7m, which we understand will mainly come from a combination of staff costs and the trimming of management. We have assumed that restructuring costs of £0.5m will be charged in FY15, and expensed in FY16. In all, EPS falls by 82% in FY15 and 48% in FY16, while FY15 year-end net cash comes back from £11.2m to £5.0m, which includes a conservative assumption on working capital outflows in FY15.

Valuation: 10x FY16 earnings when adjusted for cash

Brady trades on c 14x our cash-adjusted FY16 EPS, 1.2x EV/sales and c 9.2x EV/EBITDA. We note that Brady bounced back in FY14 from a disappointing FY13, and the shares now look undervalued if it can stage a similar recovery in FY16.

Forecasts

In September, management stated that the group had 80% of FY15 revenues in the bag. At that time, Brady had c 17 deals in its pipeline, and more than double that number in prospects. However, it has been a challenge to convert the pipeline with only seven sales since then. This reflects the deteriorating commodity markets with commodity indices at multi-year lows and scrap metal prices hammered since August in wake of the Chinese market sell-off.

The group finished H1 with £6.2m cash, which had risen to c £7.5m at the end of July. The acquisition of ScrapRunner in September absorbed c £1.2m and cash was in excess of £4m at the time of the trading update last week. The group has no debt. Licences are typically sold at the end of H1 and H2 as budgets are used up. December is usually the most cash-generative month, so we expect the cash position to improve by the year end.

Brady has been building its recurring revenues, which represent c 55% of total revenues, and constitute rental revenues (mainly from the Energy unit), maintenance (relating to term licences) and hosting fees (relating to the cloud solution). Nevertheless, the business is still quite lumpy, and Brady is reliant on high-margin term licence sales to make up revenues and boost profitability. If commodity prices remain subdued, there clearly is a risk of further deferrals in FY16. However, the group is streamlining its cost base and we would expect some deal flow from the pipeline unless there is a broader economic malaise resulting in more general pressure on IT budgets. This is because commodity firms need to maintain their IT systems and the group also sells to fabricators and consumer product companies, which benefit from lower commodity prices.

We have reduced our revenue forecasts by £5.9m in FY15 to £27.4m and by £6.6m in FY16 to £29.0m. Brady has said it will cut its costs by £1.7m and we have assumed that restructuring costs of £0.5m will be charged in FY15, with the cash utilised in FY16. Our PBT (norm) falls by £4.7m in FY15 to £0.9m and by £3.0m in FY16 to £3.4m, while EPS falls by 4.7p in FY15 to 1.0p and by 4.0p in FY16 to 3.3p. FY15 year-end net cash comes back from £11.2m to £5.0m, which includes a conservative £1.6m assumption on working capital outflows in FY15, along with the recent £0.25m share buyback. The net cash position eased to £4.9m a year later, on our forecasts. We are maintaining our dividend forecasts, which imply a 4.0% yield for FY15, rising to 4.3% in FY16.

Exhibit 1: Forecast changes

Revenue (£m)

PBT (norm, £m)

EPS (p)

Old

New

% chg.

Old

New

% chg.

Old

New

% chg.

2015e

33.3

27.4

(18)

5.6

0.9

(84)

5.7

1.0

(82)

2016e

35.6

29.0

(19)

6.4

3.4

(39)

6.3

3.3

(40)

Source: Edison Investment Research

We note that since the trading news, Kestrel Partners, Brady’s largest shareholder, increased its stake from 14% to 20%, while Investec has reduced its stake from 8% to 4%.


Exhibit 2: Financial summary

£'000s

2011

2012

2013

2014

2015e

2016e

Year end 31 December

IFRS

IFRS

IFRS

IFRS

IFRS

IFRS

PROFIT & LOSS

Revenue


19,155

28,136

29,355

31,015

27,408

29,016

Cost of Sales

(9,323)

(10,063)

(11,119)

(10,977)

(9,837)

(10,560)

Gross Profit

9,832

18,073

18,236

20,038

17,570

18,456

EBITDA


3,653

5,440

3,122

5,592

1,433

3,852

Adjusted Operating Profit


3,241

4,924

2,470

5,019

890

3,277

Amortisation of acquired intangibles

(616)

(1,276)

(1,613)

(1,613)

(1,613)

(1,613)

Exceptionals items

(326)

(2,563)

355

(2,143)

(500)

0

Share based payments

(269)

(345)

(313)

(232)

(250)

(275)

Operating Profit

2,030

740

899

1,031

(1,473)

1,389

Net Interest

68

64

29

58

40

80

Profit Before Tax (norm)


3,309

4,988

2,499

5,077

930

3,357

Profit Before Tax (FRS 3)


2,098

804

928

1,089

(1,433)

1,469

Tax

(162)

(345)

189

(630)

(139)

(587)

Profit After Tax (norm)

3,147

4,643

2,249

4,315

790

2,770

Profit After Tax (FRS 3)

1,936

459

1,117

459

(1,573)

882

Average Number of Shares Outstanding (m)

54.2

75.6

80.9

81.3

82.5

83.6

EPS – normalised (p)


5.8

6.1

2.8

5.3

1.0

3.3

EPS – FRS 3 (p)


3.6

0.6

1.4

0.6

(1.9)

1.1

Dividend per share (p)

1.50

1.60

1.70

1.85

1.95

2.10

Gross Margin (%)

51.3

64.2

62.1

64.6

64.1

63.6

EBITDA Margin (%)

19.1

19.3

10.6

18.0

5.2

13.3

Adjusted Operating Margin (%)

16.9

17.5

8.4

16.2

3.2

11.3

BALANCE SHEET

Fixed Assets


16,859

42,851

39,137

32,614

34,304

34,583

Intangible Assets

16,002

40,999

37,519

30,996

31,626

30,741

Tangible Assets

857

1,158

983

1,076

2,136

3,300

Deferred tax

0

694

635

542

542

542

Current Assets


15,513

16,874

15,420

16,948

12,456

12,526

Stocks

0

0

0

0

0

0

Debtors

5,209

9,036

8,198

7,368

7,419

7,650

Cash

10,304

7,838

7,222

9,580

5,037

4,876

Current Liabilities


(6,283)

(11,401)

(11,200)

(10,545)

(9,030)

(9,239)

Creditors

(6,283)

(11,401)

(11,200)

(10,545)

(9,030)

(9,239)

Short-term borrowings

0

0

0

0

0

0

Long-Term Liabilities


(2,138)

(6,717)

(4,467)

(4,651)

(4,651)

(4,651)

Long-term borrowings

0

0

0

0

0

0

Other long-term liabilities

(2,138)

(6,717)

(4,467)

(4,651)

(4,651)

(4,651)

Net Assets


23,951

41,607

38,890

34,366

33,079

33,220

CASH FLOW

Operating Cash Flow


3,000

1,459

4,277

6,209

815

4,452

Net Interest

68

64

29

58

40

80

Tax

(161)

(168)

(378)

(420)

(600)

(470)

Capex

(1,695)

(2,374)

(2,442)

(2,419)

(2,535)

(2,466)

Acquisitions/disposals

(1,853)

(17,983)

(751)

0

(1,180)

(66)

Financing

188

17,780

125

338

441

0

Dividends

(759)

(1,206)

(1,296)

(1,378)

(1,525)

(1,690)

Net Cash Flow

(1,212)

(2,428)

(436)

2,388

(4,543)

(160)

Opening net debt/(cash)


(11,614)

(10,304)

(7,838)

(7,222)

(9,580)

(5,037)

Other

(98)

(38)

(180)

(30)

0

()

Closing net debt/(cash)


(10,304)

(7,838)

(7,222)

(9,580)

(5,037)

(4,876)

Source: Brady (historicals), Edison Investment Research (forecasts)

Edison, the investment intelligence firm, is the future of investor interaction with corporates. Our team of over 100 analysts and investment professionals work with leading companies, fund managers and investment banks worldwide to support their capital markets activity. We provide services to more than 400 retained corporate and investor clients from our offices in London, New York, Frankfurt, Sydney and Wellington. Edison is authorised and regulated by the Financial Conduct Authority (www.fsa.gov.uk/register/firmBasicDetails.do?sid=181584). Edison Investment Research (NZ) Limited (Edison NZ) is the New Zealand subsidiary of Edison. Edison NZ is registered on the New Zealand Financial Service Providers Register (FSP number 247505) and is registered to provide wholesale and/or generic financial adviser services only. Edison Investment Research Inc (Edison US) is the US subsidiary of Edison and is regulated by the Securities and Exchange Commission. Edison Investment Research Limited (Edison Aus) [46085869] is the Australian subsidiary of Edison and is not regulated by the Australian Securities and Investment Commission. Edison Germany is a branch entity of Edison Investment Research Limited [4794244]. www.edisongroup.com

DISCLAIMER
Copyright 2015 Edison Investment Research Limited. All rights reserved. This report has been commissioned by Brady and prepared and issued by Edison for publication globally. All information used in the publication of this report has been compiled from publicly available sources that are believed to be reliable, however we do not guarantee the accuracy or completeness of this report. Opinions contained in this report represent those of the research department of Edison at the time of publication. The securities described in the Investment Research may not be eligible for sale in all jurisdictions or to certain categories of investors. This research is issued in Australia by Edison Aus and any access to it, is intended only for "wholesale clients" within the meaning of the Australian Corporations Act. The Investment Research is distributed in the United States by Edison US to major US institutional investors only. Edison US is registered as an investment adviser with the Securities and Exchange Commission. Edison US relies upon the "publishers' exclusion" from the definition of investment adviser under Section 202(a)(11) of the Investment Advisers Act of 1940 and corresponding state securities laws. As such, Edison does not offer or provide personalised advice. We publish information about companies in which we believe our readers may be interested and this information reflects our sincere opinions. The information that we provide or that is derived from our website is not intended to be, and should not be construed in any manner whatsoever as, personalised advice. Also, our website and the information provided by us should not be construed by any subscriber or prospective subscriber as Edison’s solicitation to effect, or attempt to effect, any transaction in a security. The research in this document is intended for New Zealand resident professional financial advisers or brokers (for use in their roles as financial advisers or brokers) and habitual investors who are “wholesale clients” for the purpose of the Financial Advisers Act 2008 (FAA) (as described in sections 5(c) (1)(a), (b) and (c) of the FAA). This is not a solicitation or inducement to buy, sell, subscribe, or underwrite any securities mentioned or in the topic of this document. This document is provided for information purposes only and should not be construed as an offer or solicitation for investment in any securities mentioned or in the topic of this document. A marketing communication under FCA Rules, this document has not been prepared in accordance with the legal requirements designed to promote the independence of investment research and is not subject to any prohibition on dealing ahead of the dissemination of investment research.
Edison has a restrictive policy relating to personal dealing. Edison Group does not conduct any investment business and, accordingly, does not itself hold any positions in the securities mentioned in this report. However, the respective directors, officers, employees and contractors of Edison may have a position in any or related securities mentioned in this report. Edison or its affiliates may perform services or solicit business from any of the companies mentioned in this report. The value of securities mentioned in this report can fall as well as rise and are subject to large and sudden swings. In addition it may be difficult or not possible to buy, sell or obtain accurate information about the value of securities mentioned in this report. Past performance is not necessarily a guide to future performance. Forward-looking information or statements in this report contain information that is based on assumptions, forecasts of future results, estimates of amounts not yet determinable, and therefore involve known and unknown risks, uncertainties and other factors which may cause the actual results, performance or achievements of their subject matter to be materially different from current expectations. For the purpose of the FAA, the content of this report is of a general nature, is intended as a source of general information only and is not intended to constitute a recommendation or opinion in relation to acquiring or disposing (including refraining from acquiring or disposing) of securities. The distribution of this document is not a “personalised service” and, to the extent that it contains any financial advice, is intended only as a “class service” provided by Edison within the meaning of the FAA (ie without taking into account the particular financial situation or goals of any person). As such, it should not be relied upon in making an investment decision. To the maximum extent permitted by law, Edison, its affiliates and contractors, and their respective directors, officers and employees will not be liable for any loss or damage arising as a result of reliance being placed on any of the information contained in this report and do not guarantee the returns on investments in the products discussed in this publication. FTSE International Limited (“FTSE”) © FTSE 2015. “FTSE®” is a trade mark of the London Stock Exchange Group companies and is used by FTSE International Limited under license. All rights in the FTSE indices and/or FTSE ratings vest in FTSE and/or its licensors. Neither FTSE nor its licensors accept any liability for any errors or omissions in the FTSE indices and/or FTSE ratings or underlying data. No further distribution of FTSE Data is permitted without FTSE’s express written consent.

Frankfurt +49 (0)69 78 8076 960

Schumannstrasse 34b

60325 Frankfurt

Germany

London +44 (0)20 3077 5700

280 High Holborn

London, WC1V 7EE

United Kingdom

New York +1 646 653 7026

245 Park Avenue, 39th Floor

10167, New York

US

Sydney +61 (0)2 9258 1161

Level 25, Aurora Place

88 Phillip St, Sydney

NSW 2000, Australia

Wellington +64 (0)48 948 555

Level 15, 171 Featherston St

Wellington 6011

New Zealand

Frankfurt +49 (0)69 78 8076 960

Schumannstrasse 34b

60325 Frankfurt

Germany

London +44 (0)20 3077 5700

280 High Holborn

London, WC1V 7EE

United Kingdom

New York +1 646 653 7026

245 Park Avenue, 39th Floor

10167, New York

US

Sydney +61 (0)2 9258 1161

Level 25, Aurora Place

88 Phillip St, Sydney

NSW 2000, Australia

Wellington +64 (0)48 948 555

Level 15, 171 Featherston St

Wellington 6011

New Zealand

Research: Industrials

Cohort — Update 16 December 2015

Cohort

Continue Reading
Cookie Policy Overview
Edison Group

This website uses cookies so that we can provide you with the best user experience possible. Cookie information is stored in your browser and performs functions such as recognising you when you return to our website and helping us understand which section of the website you find more interesting and useful. See our Cookie Policy for more information.

Strictly necessary and functional

These cookies are used to deliver our website and content. Strictly necessary cookies relate to our hosting environment, and functional cookies are used to facilitate social logins, social sharing and rich-media content embeds.

Advertising

Advertising Cookies collect information about your browsing habits such as the pages you visit and links you follow. These audience insights are used to make our website more relevant.

Performance

Performance Cookies collect anonymous information designed to help us improve the site and respond to the needs of our audiences. We use this information to make our site faster, more relevant and improve the navigation for all users.