Last close As at 05/08/2026
—
— 0.00 (0.00%)
Market capitalisation
—
Research: Healthcare
Laboratorios Farmacéuticos ROVI (ROVI) has reported 9M18 operating revenue of €218.9m (+7.6% y-o-y), driven by substantial growth in the speciality pharmaceutical business (9M18: €180.3m, +14.7% y-o-y). Management has upgraded FY18 guidance for operating revenue to a high single-digit growth rate (from mid-single digit). ROVI reported €16.7m sales of Becat (enoxaparin biosimilar) in 9M18 and its performance benefits from ongoing roll-out in several European countries during 2018. In October, ROVI raised gross proceeds of €88m from a capital raise, which will be used to fund R&D efforts (DORIA Phase III and Letrozole ISM Phase I) and the ongoing marketing of Becat. We value ROVI at €1.13bn.
Written by
Laboratorios Farmacéuticos ROVI |
Becat on track; guidance uplifted |
Q3 results |
Pharma & biotech |
14 November 2018 |
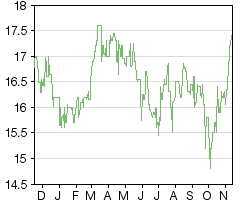
Share price performance
Business description
Next events
Analysts
Laboratorios Farmacéuticos ROVI is a research client of Edison Investment Research Limited |
|||||||||||||||||||||||||||||||||||||||||||||||||||||
Laboratorios Farmacéuticos ROVI (ROVI) has reported 9M18 operating revenue of €218.9m (+7.6% y-o-y), driven by substantial growth in the speciality pharmaceutical business (9M18: €180.3m, +14.7% y-o-y). Management has upgraded FY18 guidance for operating revenue to a high single-digit growth rate (from mid-single digit). ROVI reported €16.7m sales of Becat (enoxaparin biosimilar) in 9M18 and its performance benefits from ongoing roll-out in several European countries during 2018. In October, ROVI raised gross proceeds of €88m from a capital raise, which will be used to fund R&D efforts (DORIA Phase III and Letrozole ISM Phase I) and the ongoing marketing of Becat. We value ROVI at €1.13bn.
Year end |
Operating revenue (€m) |
PBT* |
EPS* |
DPS |
P/E |
Yield |
12/16 |
265.2 |
30.3 |
0.58 |
0.18 |
30.0 |
1.0 |
12/17 |
275.6 |
20.3 |
0.40 |
0.12 |
43.5 |
0.7 |
12/18e |
299.3 |
17.5 |
0.32 |
0.09 |
54.4 |
0.5 |
12/19e |
322.0 |
26.1 |
0.47 |
0.14 |
37.0 |
0.8 |
Note: *PBT and EPS are normalised, excluding amortisation of acquired intangibles, exceptional items and share-based payments.
LMWH franchise: strong uplift in Becat sales
Becat has now launched in Germany, the UK, Italy and Spain, and additionally in France through an agreement with Biogaran. Of the reported $16.7m sales in 9M18, 70% were in Germany and 16% in Italy. ROVI now expect FY18 sales to be at the higher end of its earlier €20–30m guidance range for 2018. While the company will focus on marketing in Europe, its international plans to commercialise Becat through out-licensing deals are underway (agreements are now in place with Sandoz and Hikma). Flagship product Hibor (bemiparin) sales grew to €68.7m (9M17: €61.7m) with sales in Spain up 21.4% to €49.5m, but international sales declined by 8.0% to €19.2m as a result of seasonality.
Pharma products stable as service revenues decline
Growth in sales for Volutsa, Neparvis and the respiratory franchise highlight the strength of the wider pharmaceutical product portfolio. Toll manufacturing revenues were down 16.5% to €38.5m in 9M18 as a result of exceptionally high volumes for its injectable business in 9M17. R&D expenses increased by 30.1% y-o-y to €24.6m, driven by both the ongoing Risperidone ISM Phase III trial and Letrozole ISM Phase I trial. PRISMA-3 DORIA data will present an important inflection point; results are due in Q219 and ROVI expects to file the US NDA in H219.
Valuation: €1.13bn or €20.2 per share
Our valuation of ROVI has decreased to €1.13bn or €20.2 per share from €1.21bn. We have rolled forward our model and updated for net debt at 30 September, which reflects the recent capital raise. We have reviewed our gross margin and operating margin expectations for the business in the mid to long term. We expect some gross margin erosion in 2019-21 due to the lower launch price of Becat in Europe. This is offset somewhat by reducing our operating expense assumptions in Europe, as ROVI should leverage DORIA through its newly formed EU infrastructure. We have made minor changes to our sales forecasts in 2018 and 2019.
9M18: Speciality pharmaceuticals growing in strength
ROVI reported operating revenue of €218.9m for 9M18 (+7.6% y-o-y), driven by strong growth in the speciality pharmaceutical business (+14.7% to €180.3m), offsetting declines in the toll manufacturing business (-16.5% to €38.5m). Total revenues (including other operating income of €1.1m) grew 7.6% to €220.0m in 9M18. Highlights for 9M18 include:
■
The speciality pharmaceutical business consists of approximately 40 marketed products across nine core franchises. For 9M18, Hibor (bemiparin) total sales grew 11.5% y-o-y to €68.7m, where sales in Spain grew 21.4% to €49.5m but declined in international markets (-8.0%) to €19.2m. Hibor sales growth through 9M18 was due to shifts in market dynamics, caused by both the launch of Becat (enoxaparin biosimilar) in Europe and the impact of the European Medicines Agency’s introduction of new posology (dosing) guidelines for enoxaparin in 2017. This translates to the need for a treatment dose of two injections per day for enoxaparin. However, for Hibor only one injection of the same dose is required, so ROVI’s salesforce has been actively promoting this advantage (one injection a day vs two).
■
Becat has experienced a strong uptake in sales (€16.7m) for 9M18, despite only being directly marketed in Germany since September 2017, the UK (March 2018), Italy (April 2018) and, more recently, Spain (September 2018). Sales for 9M18 were split 70% to Germany and 16% to Italy. Sales in the UK have been slower than initially anticipated due to difficulties in getting the drug on formularies. However, ROVI believes this is a short-term problem. An agreement was signed with Biogaran in September 2018 to market Becat in France, and direct marketing in both Austria and Latvia commenced in October 2018. In addition, ROVI has signed out-licensing agreements that cover 63 countries, notably with Sandoz and Hikma.
■
In the portfolio of in-licensed products, Volutsa (benign prostate hyperplasia, in-licensed from Astellas and launched in Spain in February 2015) grew 25.4% to €8.2m for 9M18, and Neparvis (heart failure, in-licensed from Novartis and launched in Spain in December 2016) posted €9.3m for 9M18 (+230%). The cholesterol franchise consists of Vytorin, Orvatez and Absorcol, and faces challenging conditions as the active principle of these products (ezetimibe) went off-patent in Q218. As a result, Absorcol and Vytorin prices were reduced to remain competitive and sales have declined slightly for 9M18 to €28.0m (-3.0%). However, growth in the respiratory franchise (Ulunar and Hirobriz) to €11.4m (+9.4%) has helped offset this slowdown.
■
Toll manufacturing sales declined 16.5% to €38.5m for 9M18, largely due to declines in the injectables business (-26.9% y-o-y to €19.8m). The first nine months of 2017 benefited from exceptionally high volumes for some customers, which resulted in the dramatic drop-off in 2018.
■
ROVI has updated its expectation of revenue growth in 2018, from mid-single digit growth to high single-digit growth. Management is now guiding to the upper range of €20–30m for Becat sales. We have increased our FY18 operating revenue forecast to €299.3m from €293.6m (implying 8.6% y-o-y growth) and increased our Becat sales forecasts to €29.2m from €26.7m in 2018. Our moderate increase in 2019 operating revenues to €322m is driven by Neparvis, but partly offset by a slight reduction in Hibor international sales.
■
Reported EBITDA decreased slightly to €25.9m in 9M18 (-4.1%), leading to a lower EBITDA margin of 11.9% vs 13.2% in 9M17. During the period, ROVI’s gross margin declined to 59.7% vs 60.1% in 9M17 due to the impact of the reduction in sales volumes in the injectables business. Sales of Becat had a positive impact on gross margin, but margin erosion is expected as this product launches at lower prices in other markets. 9M18 saw a rise in R&D expenses (30.1% y-o-y) to €24.6m to support investment in portfolio products, DORIA (Risperidone ISM) and Letrozole ISM, which are in Phase III (data expected in 2019) and Phase I clinical trials, respectively. EBIT also decreased to €17.1m in 9M18 (-5.5%), reflecting a decrease in EBIT margin to 7.8% from 8.9%. The effective tax rate was 4.7% in 9M18 vs 2.3% in 9M17, due to the deduction of R&D expenses plus the capitalisation of negative tax bases from Frosst Ibérica, and its German and Italian franchises (Rovi GmbH and Rovi Biotech S.R.L.). ROVI expects to maintain a mid-single digit effective tax rate for the foreseeable future. Net profit decreased by 8.0% to €15.7m from €17.0m in 9M17.
Enoxaparin biosimilar Becat off to a great start
ROVI has set out a clear strategy to launch its enoxaparin biosimilar, Becat, into key countries in the EU. As of 30 September, Becat received approval in 23 countries. ROVI has successfully launched Becat in Germany (September 2017), the UK, Italy, Spain (9M18), as well as Austria and Latvia in October 2018. Becat has been launched in France (September 2018) through an agreement with Biogaran, a leading hospital player in the French biosimilar market. ROVI reported €16.7m sales of Becat (enoxaparin biosimilar) in 9M18, of which 70% were in Germany and 16% in Italy, and expects FY18 sales to be at the higher end of its earlier €20–30m guidance for 2018. We have increased our forecast for Becat to €29.2m from €26.7m for FY18, given better than anticipated sales ytd. We continue to forecast total peak sales of €160.2m, which includes Europe and the international opportunity ex-US. Exhibit 1 highlights the sales trajectory across the last four quarters.
|
Exhibit 1: Enoxaparin biosimilar Becat sales ramp-up |
|
|
Source: ROVI corporate presentations |
ROVI intends to launch Becat in other key European markets before Q119 and has recently established European sales offices that will facilitate the launch. Furthermore, this pan-European sales infrastructure will be leveraged to launch products from its wider portfolio offering in the future.
In terms of international commercialisation strategies, ROVI has signed a licensing agreement with Hikma (April 2018) for the distribution and marketing of its enoxaparin biosimilar across 17 countries in the MENA region (Kingdom of Saudi Arabia, Jordan, Algeria, Egypt, Tunisia, Sudan, Syria, Yemen, Iraq, Oman, UAE, Kuwait, Qatar, Bahrain, Libya, Palestine and Lebanon). Hikma has strong and long-established presence in these countries and this partnership bodes well for enoxaparin in these regions. In June 2018, ROVI signed a licensing agreement with Sandoz (Novartis’ generic and biosimilar division) to distribute and market its enoxaparin biosimilar in 14 countries/regions (Australia, New Zealand, Philippines, Hong Kong, Singapore, Vietnam, Malaysia, Canada, South Africa, Brazil, Colombia, Argentina, Mexico and Central America). Furthermore, under the terms of the agreement, Sandoz has exclusive rights in three of these countries (Hong Kong, Singapore and Vietnam). Partnering with Sandoz (and by extension Novartis) serves as an important validation, given its international presence in global generic and biosimilar markets.
PRISMA-3 DORIA data expected in Q219
ROVI’s internally developed biosimilar of enoxaparin, Becat, is a key driver of near-term, top-line growth. Future top-line growth and margin expansion rests on the broader portfolio offering. ROVI’s R&D focus is on its proprietary ISM technology, which centres on developing novel, long-acting (once a month or once every three months) formulations of approved drugs. Assets include DORIA ISM (Phase III schizophrenia) and Letrozole ISM (Phase I breast cancer). DORIA is a fast onset of action LAI version of risperidone (off-patent). As well as rapid onset of action, the key advantages are that there is no need for a loading dose or oral supplementation. The schizophrenia market is vast and growing steadily. We believe DORIA’s profile will provide it with a 5% share of the LAI (long-acting injectable) market and drive peak sales of US$411m (US and Europe) in 2027. DORIA is a high gross margin asset (85-95%) and will be the critical long-term driver of operating margins. ROVI expects to present PRISMA-3 DORIA data in Q219 and file the US NDA in H219.
Valuation
Our valuation of ROVI has decreased to €1.13bn or €20.2 per share from €1.21bn. We have rolled forward our model and updated for net debt at 30 September, which reflects the recent capital raise. We have reviewed our gross margin and operating margin expectations for the business in the mid to long term. We expect some gross margin erosion in 2019-21 due to the lower launch price of Becat in Europe, which we expect to be offset somewhat by reducing our operating expense assumptions in Europe in the longer term as ROVI should leverage DORIA through its newly formed EU infrastructure. We make no change to our US DORIA SGA expenses nor to the cost of sales reps for DORIA EU. We have increased our forecast for Becat sales in 2018 and increased our Neparvis sales in 2018 and 2019, which has been offset by a slight reduction in Hibor international sales. Our valuation is underpinned by the sales potential of Becat and the base business retaining stable, low single-digit growth rates.
We value DORIA US and EU using a standalone NPV calculation (Exhibit 4) and derive value for the rest of the business by using a DCF of our sales and P&L model excluding DORIA (Exhibit 2). Compared to ROVI’s current portfolio of drugs and footprint, the US opportunity for DORIA is large and a key valuation driver (accounting for 17% of our valuation; EU DORIA accounts for 10%).
Exhibit 2: ROVI sum-of-the-parts valuation
Value (€m) |
Value per share (€) |
|
DCF of base business |
826.6 |
14.7 |
rNPV of DORIA |
306.6 |
5.5 |
Valuation |
1,133.2 |
20.2 |
Source: Edison Investment Research
Exhibit 3: Three-stage DCF valuation of base business (excludes DORIA cash flows)
€m |
|
Sum of for DCF for forecast period to 2025 |
294 |
Sum of DCF for growth 2026 to 2030 (transition period) |
164 |
Terminal value |
389 |
Enterprise value |
847 |
Net debt at 30 September 2018* |
(20.6) |
Value of equity of base business |
826.6 |
Value per share of base business |
14.7 |
Discount rate |
10% |
Terminal growth rate |
2% |
Number of shares outstanding (m) |
56.07 |
Sum of for DCF for forecast period to 2025 |
Sum of DCF for growth 2026 to 2030 (transition period) |
Terminal value |
Enterprise value |
Net debt at 30 September 2018* |
Value of equity of base business |
Value per share of base business |
Discount rate |
Terminal growth rate |
Number of shares outstanding (m) |
€m |
294 |
164 |
389 |
847 |
(20.6) |
826.6 |
14.7 |
10% |
2% |
56.07 |
Source: Edison Investment Research. Note: *Reflects recent capital raise.
Exhibit 4: DORIA NPV
Indication |
Launch |
Peak sales ($m) |
Value (€m) |
Probability |
rNPV (€m) |
rNPV per share |
|
NPV DORIA US |
Schizophrenia |
2022 |
236 |
262.8 |
75% |
192.0 |
3.4 |
NPV DORIA Europe |
Schizophrenia |
2022 |
176 |
160.7 |
75% |
114.6 |
2.0 |
Source: Edison Investment Research
Our sum-of-the-parts valuation consists of:
■
NPV calculation for DORIA US and EU opportunity. We forecast US peak sales of $236m (€195m) and EU peak sales of $176m (€145m) in 2027; this is predicated on achieving a 5% peak penetration rate of the LAI antipsychotic market in both territories. DORIA is a high-margin asset and we discuss our DORIA-related cost assumptions in our note ‘DORIA low risk, high reward’. We assume a probability of launch of 75% and apply a 12.5% discount rate commensurate with our treatment of clinical-stage assets.
■
DCF for ROVI’s base business of marketed products and toll manufacturing revenue (we strip out DORIA sales and associated costs). We utilise our sales and P&L forecasts in these cash flows (out to 2025) and from 2026 to 2030 apply a transition growth rate (reflecting the fact that ROVI is growing at a high rate during our forecast period). Finally, we apply a 2.0% terminal growth rate (terminal value represents 30% of our total ROVI valuation). 10% is our standard discount rate assumption for companies with approved products and minimal development risk.
■
We use a 15% tax rate from 2030. The current tax rate is c 8%, but over time this is expected to normalise to the mid-teens.
Financials
In October 2018 ROVI raised gross proceeds of €88m from a capital raise that will be used to fund R&D efforts (DORIA Phase III and Letrozol ISM Phase I) and the ongoing marketing of Becat. We forecast a year-end cash position €88.4m. ROVI is a profit-generating company and the capital raise will ensure that near-term R&D costs are covered and, more importantly, provide an increase in liquidity to the stock with the improvement in free float.
We believe investors should focus on longer-term margin growth prospects for the group. While ROVI reports pre-R&D metrics such as ‘pre-R&D EBITDA’, which helps to demonstrate the profitability (and growth) of the underlying business as it stands currently, fluctuations in R&D and SG&A costs are likely to vary as management looks to maximise return on internal investment by investing in R&D and SG&A as necessary, and should be seen as part and parcel of the business.
ROVI has given guidance for R&D expenses (October 2017 DORIA presentation) in the region of €32m pa in 2018-19 and €22m in 2020 and 2021 to support clinical trials for Risperidone ISM and Letrozole ISM.
EB is a product of the R&D invested by ROVI and the ramp-up of enoxaparin sales has positive longer-term implications for development, mainly through operational leverage. Our original forecast for Becat was at a similar gross margin to Hibor (ROVI does not disclose divisional margins). At the 9M18 results, management outlined an expectation of gross margin erosion in the near term as Becat launches at lower prices in additional countries. We have therefore lowered our gross margin expectations in 2019-20 to reflect this. Gross margin evolution should benefit from 2022 as the high-margin asset DORIA starts to contribute to the top line.
In terms of operating margin, we believe that after the costs of the initial launch period for Becat are met (as ROVI invests in European selling infrastructure) and DORIA is launched in the US and European markets, longer-term total SG&A for the group will grow at a slower rate than sales, and this should provide the operational leverage to enable operating margin expansion.
However, in the near term, operating margins will be affected by the increased R&D spend relating to the Phase III risperidone and Phase I letrozole trials. We expect operating margins to further decrease in 2018 (from 10.7% in 2016 and 6.9% in 2017) to 4.9%, mainly due to higher R&D expenses, but also due to the increase in SG&A to support new product launches. We now anticipate operating margin growth in 2019 to 6.9% (from our pervious assumption of 7.9%), reflecting the reduction in gross margin forecasts. We forecast an absolute 1.4pp improvement in operating margin from 10.7% in 2016 to 12.1% in 2020. Margins should continue to ramp up beyond this period as the operating leverage from enoxaparin sales starts to flow through to the P&L, while R&D levels will decrease to €22m pa in 2020-21.
Exhibit 5: Financial summary
Accounts: IFRS, Year-end: December, €m |
|
2014 |
2015 |
2016 |
2017 |
2018e |
2019e |
PROFIT & LOSS |
|||||||
Hibor revenue |
|
72.7 |
75.1 |
79.7 |
83.9 |
85.0 |
81.3 |
Enoxaparin revenue |
|
0.0 |
0.0 |
0.0 |
1.5 |
29.2 |
44.5 |
Other (Pharma & Manufacturing) |
|
165.4 |
170.9 |
185.5 |
190.3 |
185.1 |
196.1 |
Operating revenues |
|
238.0 |
246.0 |
265.2 |
275.6 |
299.3 |
322.0 |
Cost of sales |
|
(94.6) |
(97.1) |
(112.0) |
(110.2) |
(122.7) |
(133.6) |
Gross profit |
|
143.5 |
148.9 |
153.1 |
165.5 |
176.6 |
188.3 |
Gross margin % |
|
60.3% |
60.5% |
57.8% |
60.0% |
59.0% |
58.5% |
SG&A (expenses) |
|
(97.8) |
(101.7) |
(101.9) |
(108.5) |
(118.8) |
(122.3) |
R&D costs |
|
(12.0) |
(16.5) |
(17.5) |
(28.3) |
(32.0) |
(32.0) |
Other income/(expense) |
|
2.9 |
1.0 |
5.6 |
1.8 |
1.8 |
1.8 |
EBITDA (reported) |
|
36.6 |
31.8 |
39.3 |
30.5 |
27.5 |
35.8 |
Depreciation and amortisation |
|
(8.9) |
(10.0) |
(11.0) |
(11.5) |
(12.8) |
(13.6) |
Normalised Operating Income |
|
29.2 |
23.8 |
30.7 |
21.8 |
18.2 |
25.7 |
Reported Operating Income |
|
27.7 |
21.8 |
28.3 |
19.0 |
14.7 |
22.2 |
Operating Margin % |
|
11.6% |
8.9% |
10.7% |
6.9% |
4.9% |
6.9% |
Finance income/(expense) |
|
(2.1) |
(0.9) |
(0.5) |
(0.9) |
(0.7) |
0.5 |
Exceptionals and adjustments |
|
0.0 |
0.0 |
0.0 |
0.0 |
0.0 |
0.0 |
Normalised PBT |
|
27.1 |
22.9 |
30.3 |
20.3 |
17.5 |
26.1 |
Reported PBT |
|
25.6 |
20.9 |
27.9 |
17.5 |
14.0 |
22.7 |
Income tax expense (includes exceptionals) |
|
(1.5) |
(1.1) |
(1.8) |
(0.3) |
(0.7) |
(1.2) |
Normalised net income |
|
25.6 |
21.8 |
28.5 |
20.0 |
16.8 |
25.0 |
Reported net income |
|
24.1 |
19.8 |
26.1 |
17.2 |
13.3 |
21.5 |
Basic average number of shares, m |
|
49.8 |
49.5 |
49.0 |
50.0 |
52.8 |
52.8 |
Basic EPS (€) |
|
0.48 |
0.40 |
0.53 |
0.34 |
0.25 |
0.41 |
Normalised EPS (€) |
|
0.51 |
0.44 |
0.58 |
0.40 |
0.32 |
0.47 |
Dividend per share (€) |
|
0.17 |
0.14 |
0.18 |
0.12 |
0.09 |
0.14 |
BALANCE SHEET |
|
||||||
Property, plant and equipment |
|
73.6 |
81.8 |
82.8 |
89.1 |
95.9 |
103.2 |
Goodwill |
|
0.0 |
0.0 |
0.0 |
0.0 |
0.0 |
0.0 |
Intangible assets |
|
17.2 |
18.9 |
24.9 |
27.1 |
27.1 |
23.7 |
Other non-current assets |
|
8.5 |
9.1 |
13.1 |
14.1 |
14.1 |
14.1 |
Total non-current assets |
|
99.3 |
109.8 |
120.8 |
130.2 |
137.1 |
141.0 |
Cash and equivalents |
|
26.7 |
29.3 |
41.4 |
40.7 |
115.7 |
114.5 |
Inventories |
|
67.6 |
63.9 |
67.4 |
75.5 |
70.6 |
73.2 |
Trade and other receivables |
|
63.7 |
57.0 |
53.8 |
49.7 |
57.4 |
57.3 |
Other current assets |
|
4.1 |
3.9 |
4.5 |
2.2 |
2.2 |
2.2 |
Total current assets |
|
162.0 |
154.1 |
167.1 |
168.2 |
245.9 |
247.3 |
Non-current loans and borrowings |
|
32.0 |
32.6 |
20.8 |
27.0 |
17.5 |
0.2 |
Other non-current liabilities |
|
8.7 |
7.2 |
7.2 |
6.4 |
5.9 |
5.3 |
Total non-current liabilities |
|
40.7 |
39.8 |
28.0 |
33.5 |
23.4 |
5.5 |
Trade and other payables |
|
55.0 |
45.7 |
59.9 |
52.9 |
57.9 |
59.7 |
Current loans and borrowings |
|
4.3 |
10.1 |
13.0 |
16.2 |
9.5 |
17.3 |
Other current liabilities |
|
2.8 |
3.3 |
3.6 |
4.1 |
4.1 |
4.1 |
Total current liabilities |
|
62.1 |
59.2 |
76.4 |
73.2 |
71.5 |
81.0 |
Equity attributable to company |
|
158.5 |
164.8 |
183.4 |
191.7 |
288.1 |
301.7 |
CASH FLOW STATEMENT |
|
||||||
Profit before tax |
|
25.6 |
20.9 |
27.9 |
17.5 |
14.0 |
22.7 |
Depreciation and amortisation |
|
8.9 |
10.0 |
11.0 |
11.5 |
12.8 |
13.6 |
Share based payments |
|
0.0 |
0.0 |
0.0 |
0.0 |
0.0 |
0.0 |
Other adjustments |
|
2.5 |
(1.1) |
(2.7) |
(1.2) |
0.7 |
(0.5) |
Movements in working capital |
|
(7.4) |
2.3 |
12.7 |
(9.8) |
1.7 |
(1.4) |
Interest paid / received |
|
(2.7) |
(0.6) |
0.0 |
0.0 |
(1.1) |
(0.7) |
Income taxes paid |
|
(3.9) |
(2.0) |
(3.4) |
0.1 |
(0.7) |
(1.2) |
Cash from operations (CFO) |
|
23.0 |
29.4 |
45.5 |
18.0 |
27.4 |
32.5 |
Capex |
|
(25.1) |
(19.9) |
(18.1) |
(19.9) |
(19.7) |
(17.4) |
Acquisitions & disposals net |
|
0.0 |
0.0 |
0.0 |
0.0 |
0.0 |
0.0 |
Other investing activities |
|
16.6 |
0.6 |
1.7 |
0.7 |
0.4 |
1.2 |
Cash used in investing activities (CFIA) |
|
(8.5) |
(19.3) |
(16.3) |
(19.2) |
(19.3) |
(16.3) |
Net proceeds from issue of shares |
|
(2.0) |
(5.1) |
(0.5) |
0.5 |
88.0 |
0.0 |
Movements in debt |
|
2.7 |
5.9 |
(9.7) |
9.0 |
(16.2) |
(9.5) |
Other financing activities |
|
(8.0) |
(8.3) |
(6.9) |
(9.0) |
(4.9) |
(7.9) |
Cash from financing activities (CFF) |
|
(7.3) |
(7.6) |
(17.1) |
0.5 |
66.9 |
(17.4) |
Cash and equivalents at beginning of period |
|
19.4 |
26.7 |
29.3 |
41.4 |
40.7 |
115.7 |
Increase/(decrease) in cash and equivalents |
|
7.3 |
2.6 |
12.1 |
(0.7) |
75.0 |
(1.2) |
Cash and equivalents at end of period |
|
26.7 |
29.3 |
41.4 |
40.7 |
115.7 |
114.5 |
Net (debt)/cash |
|
(9.6) |
(13.5) |
7.6 |
(2.5) |
88.7 |
97.0 |
Source: Company accounts, Edison Investment Research
|
|
Despite the deluge of negative news across the UK gaming sector, JPJ Group plc (JPJ) has produced another strong quarter, with gaming revenue growth of 8% to £77.8m and an EBITDA margin of 37%. The strategy to expand beyond the UK is clearly paying off; Vera&John revenues increased 40% and international now represents 44% of total revenues. Net debt is reducing rapidly, helped by Q318 operating cash flow of £33m, as well as the £18m cash from the disposal of the social business, and we anticipate dividends from next year. JPJ shares have fallen by c 30% ytd June and now trade at only 5.2x P/E, 7.0x EV/EBITDA and 16.6% free cash flow yield for FY19e.